@public_citizen
Instagram · Carousel
@public_citizen People with extraordinary wealth are controlling the levers of power in our government.

@public_citizen
Instagram · Carousel
@public_citizen People with extraordinary wealth are controlling the levers of power in our government.
Performance
Video #39589 · Carousel
[01]
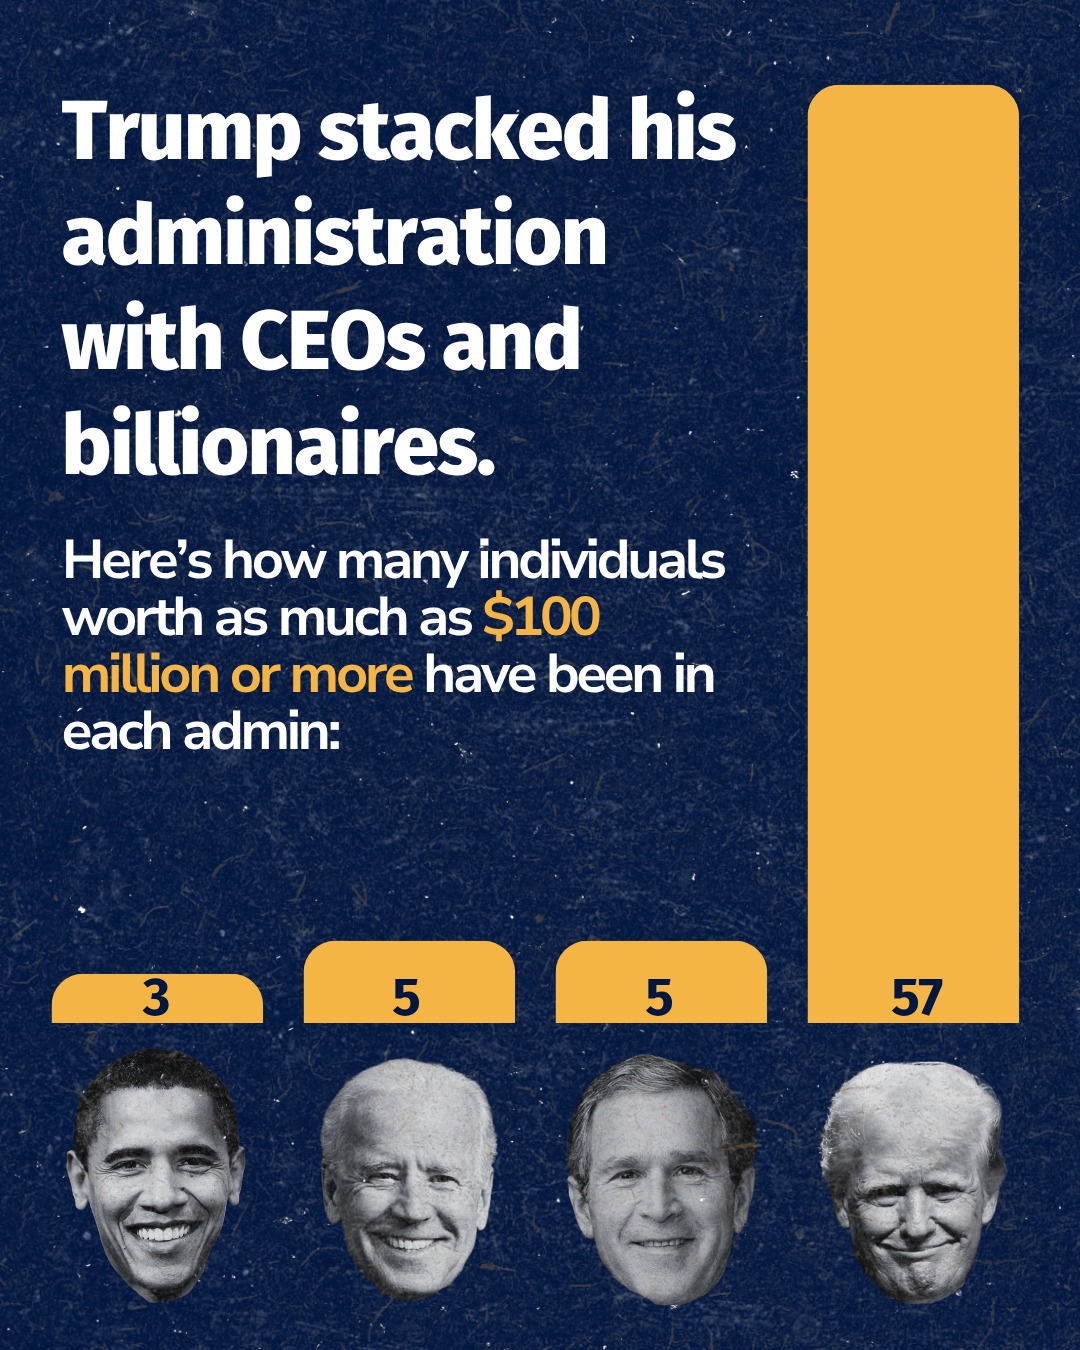
This is a political infographic presented as a bar chart. It compares the number of individuals worth $100 million or more in the presidential administrations of Barack Obama, Joe Biden, George W. Bush, and Donald Trump, with the data showing a significantly higher number for the Trump administration.
[02]
[03]
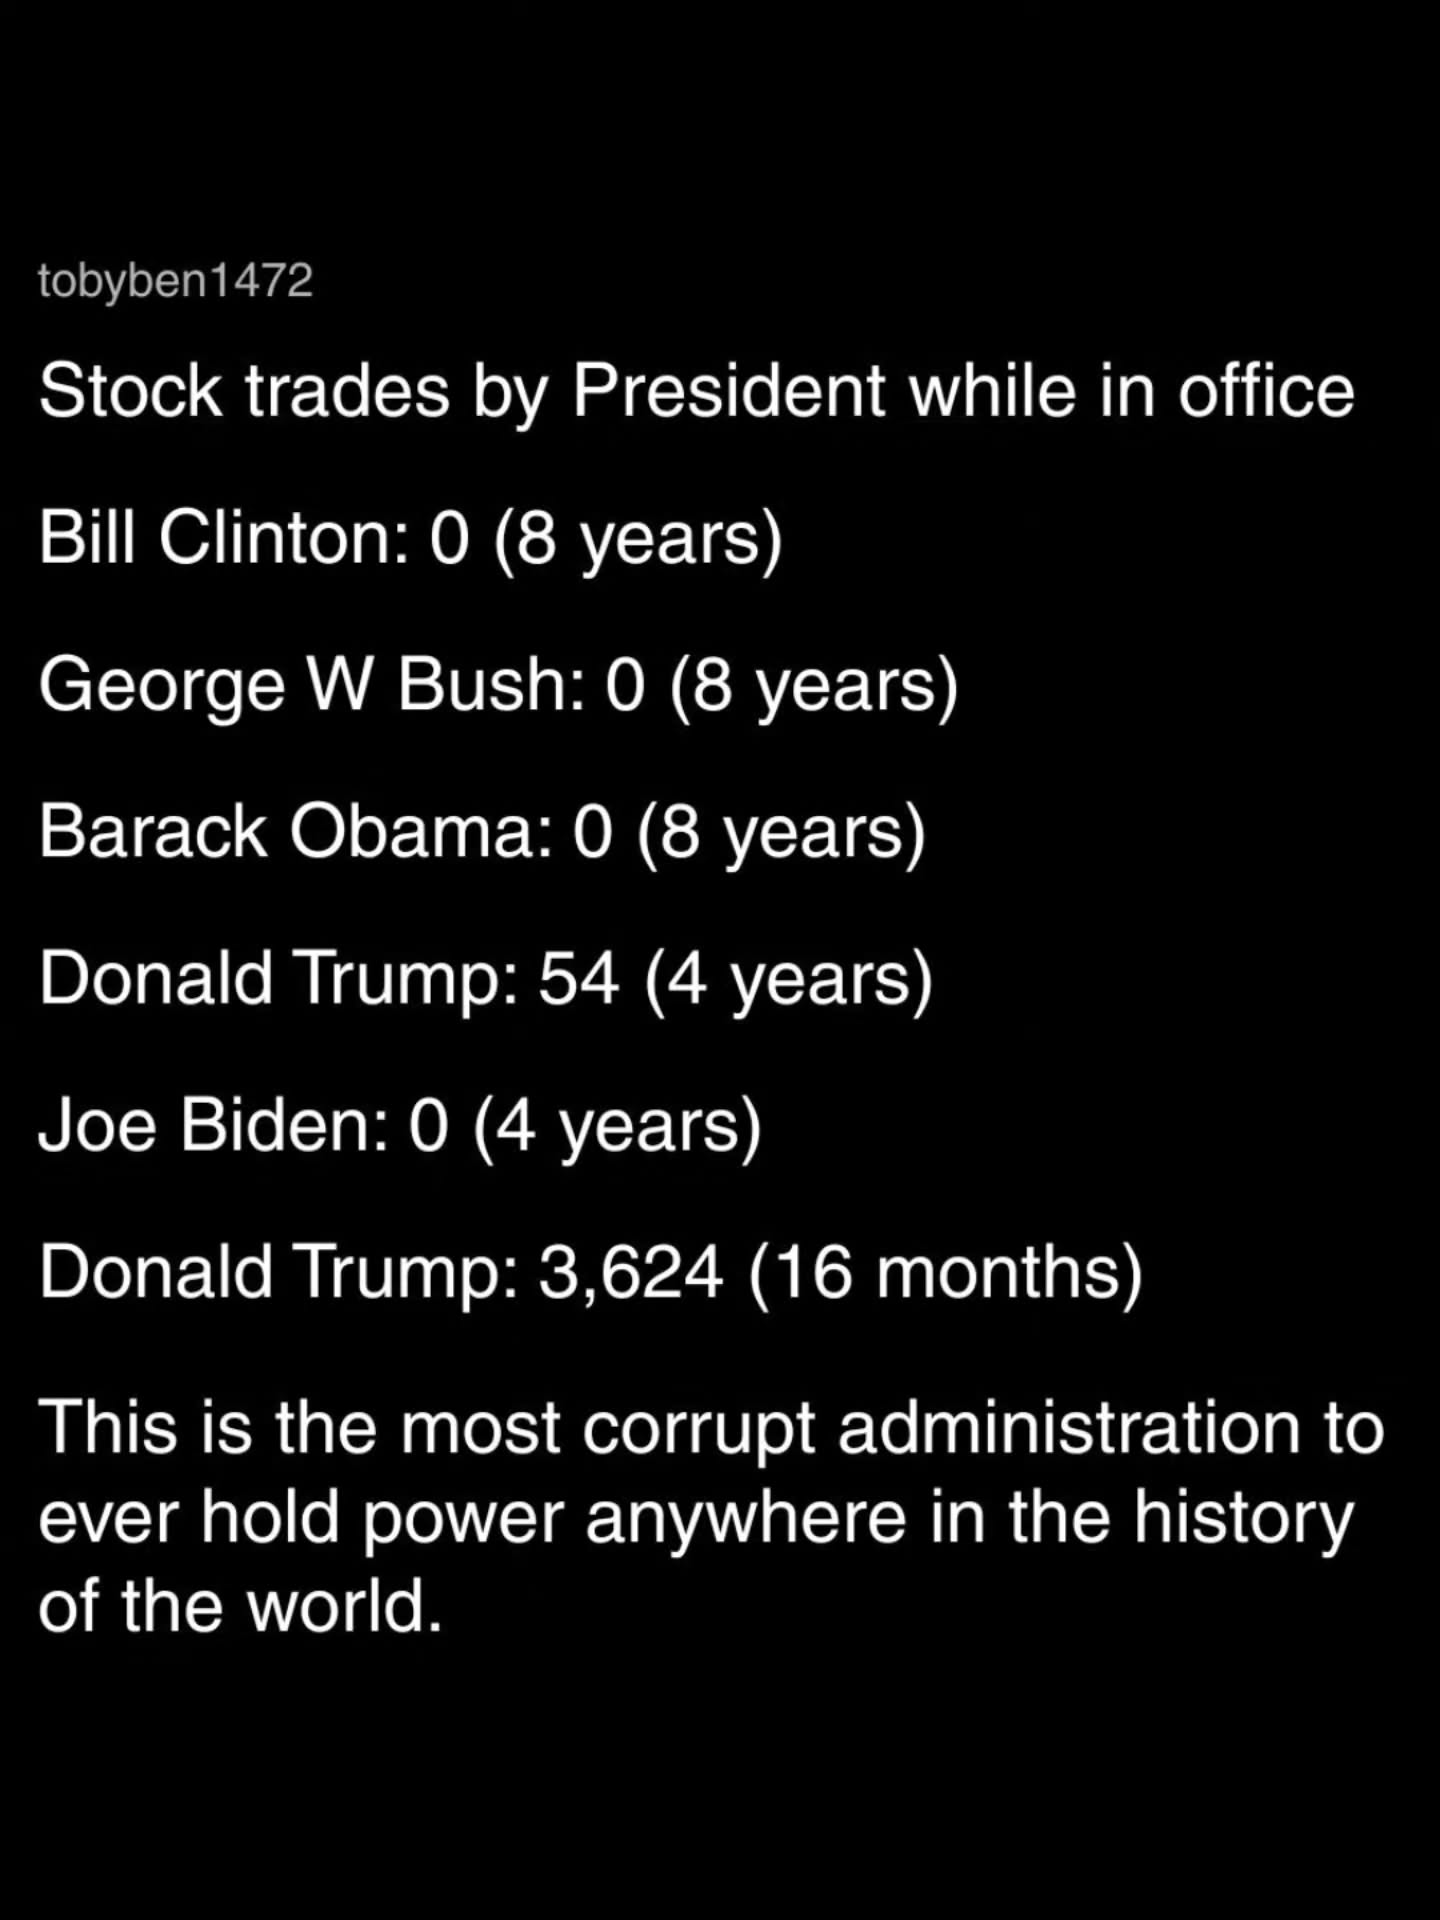 1.2M706×Political graphic comparing presidential stock trades@thatsnotrightpolitics · Statement Carousel
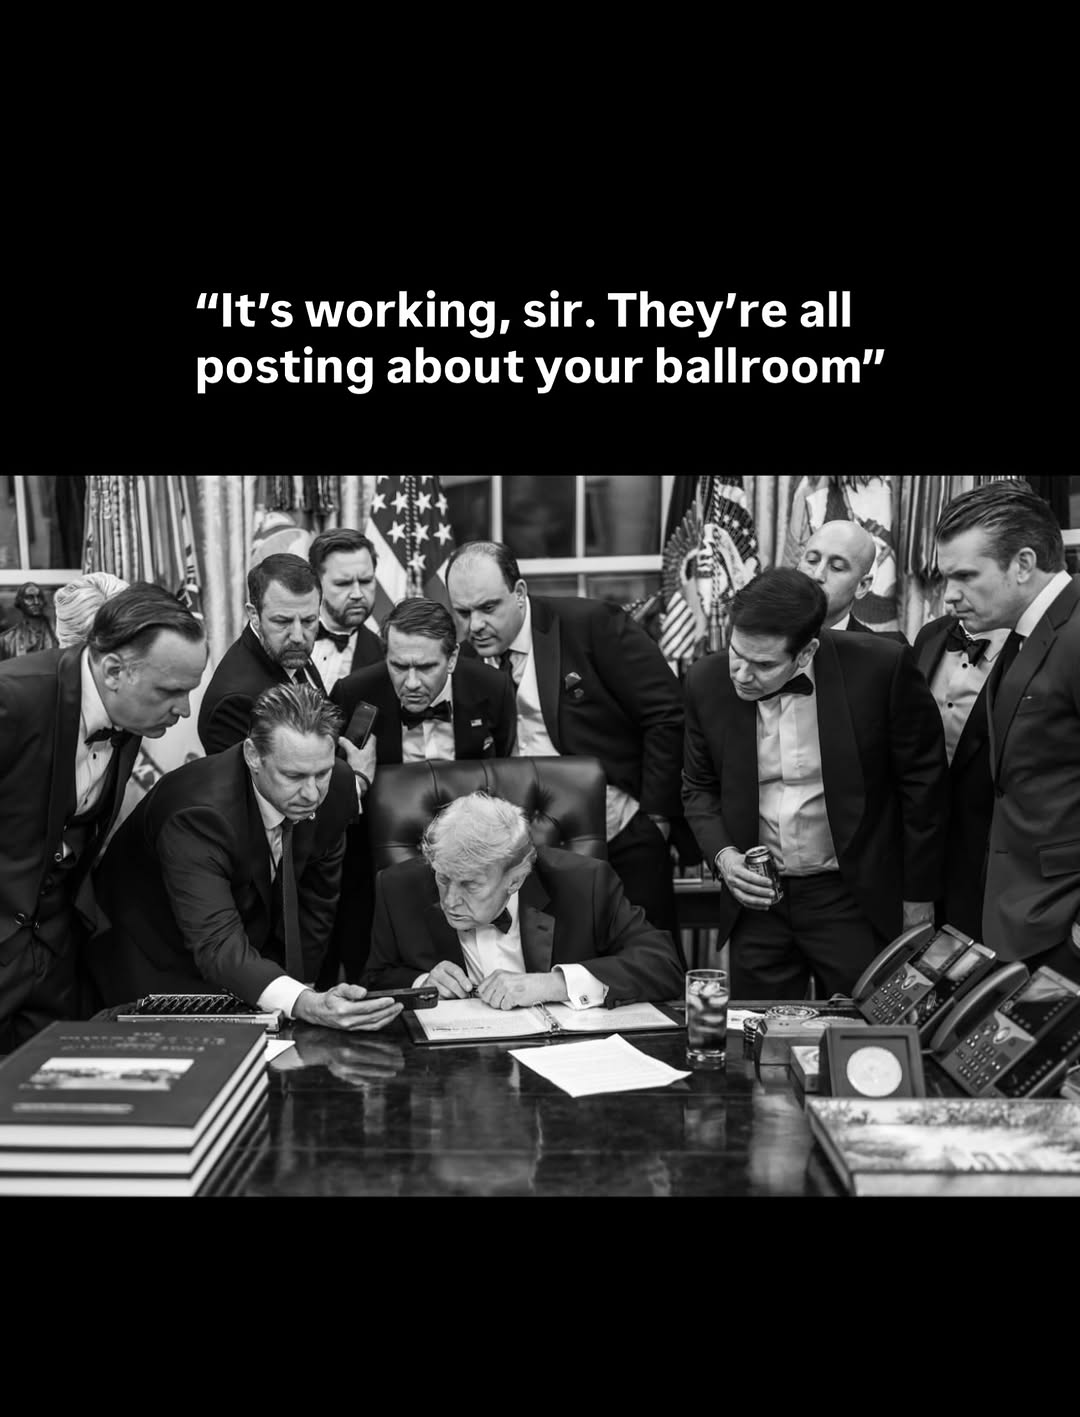 175.7K4.8×Satirical meme of Trump in the Oval Office.@emilyinyourphone · Satirical Advice
 1.8M7.3×Trump, Melania, and Dana White at UFC event.@bigjohngolfs · Event Showcase
 374.1KCorporate government satire news report@goodworkmb · Skit
 550.6K16.9×Reframing footage with critical text@9irlnews · Hot Take
 7.2MPosing for an episode announcement@brysondechambeau · Hype Teaser
 636.4K2.3×Political promises supercut with twist@zeteonews · Skit
 1M4.8×Candid arrival of public figure@thewalkercup · Behind The Scenes
 942.9K22.6×Satirical skit about Trump's currency@davejorgenson1 · Skit
 1.2M156.8×Creators rap battle as Trump@dumblitstudios · Skit
 121KFriend steals the impression bit@the.unpaid.interns · Relatable Skit
 69.6K118.2×Obama celebrates marriage equality anniversary@historymadebyus · Milestone Celebration
[04]
[05]
What stops the scroll in the first 3 seconds
Title hook · 45%
Trump stacked his administration with CEOs and billionaires.
Verbal hook · 15%
People with extraordinary wealth are controlling the levers of power in our government.
Visual hook · 40%
The extreme visual contrast between the very tall bar representing the Trump administration (57) and the three much smaller, uniform bars for other presidents (3, 5, 5) creates a stark and immediate data-driven hook.
[07]
The promise the opener makes, and how the video pays it back
Hook
A provocative, attention-grabbing headline that makes a specific, strong claim about a single subject.
Payoff
The final data point delivers a moment of shock and validation, creating a memorable and shareable data story that confirms the initial bold claim.
[08]
The structural pattern this video runs on
Framework
The Comparative Shock
Prove a provocative claim by establishing a consistent baseline across several examples, then revealing a final data point that is a dramatic outlier, creating a moment of visual and numerical shock.
The Comparative Frame
Introduces the specific metric that will be used to compare the subject of the hook against several other reference points, setting the stage for a data-driven argument.
The Baseline Establishment
Presents data for multiple reference points that are relatively similar, creating an expected pattern or 'norm' in the viewer's mind.
The Outlier Reveal
Presents the data for the primary subject, which is visually and numerically a dramatic departure from the established baseline, thereby proving the hook's claim in a shocking way.
People with extraordinary wealth are controlling the levers of power in our government.
Statement · photo_0
Trump stacked his administration with CEOs and billionaires.
Statement · photo_0
Here's how many individuals worth as much as $100 million or more have been in each admin:
informational · photo_0
3
informational · photo_0
5
informational · photo_0
57