@everythingplotted
Instagram · Single Photo
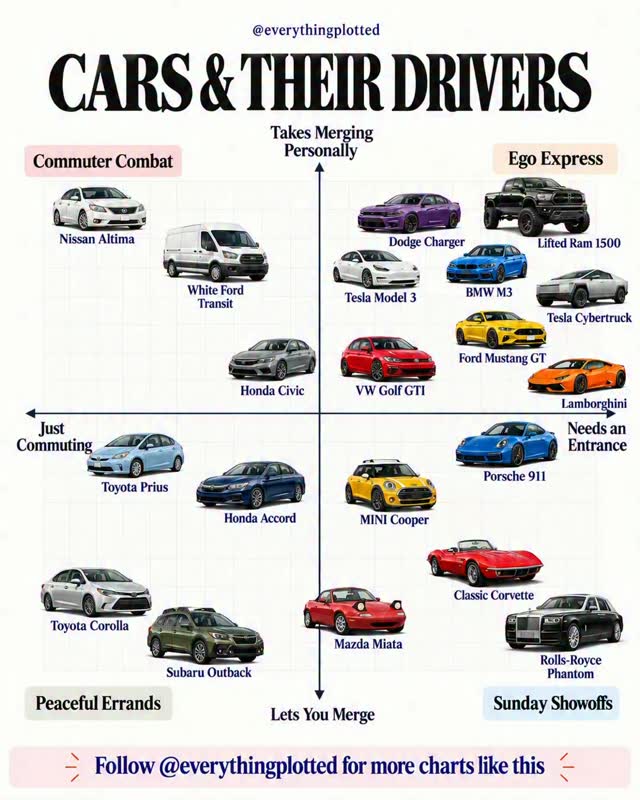
@everythingplotted Which drivers did I get wrong? Car drivers, plotted by showing off × road rage. Follow @everythingplotted for more charts like these. #drivers

@everythingplotted
Instagram · Single Photo
@everythingplotted Which drivers did I get wrong? Car drivers, plotted by showing off × road rage. Follow @everythingplotted for more charts like these. #drivers
Performance
Video #47462 · Single Photo
[01]
The video displays a single, static infographic chart that humorously categorizes various car models and their drivers on a 2x2 matrix. The axes rate drivers on their merging etiquette and the purpose of their driving, creating stereotypical quadrants like 'Commuter Combat' and 'Ego Express'.
[02]
[03]
 930.4K42.8×Aesthetic montage of a lifestyle@what.shedrives · Vibe Showcase
 212.5K5.4×Aesthetic comparison of car types@vineyardrovers · Vibe Showcase
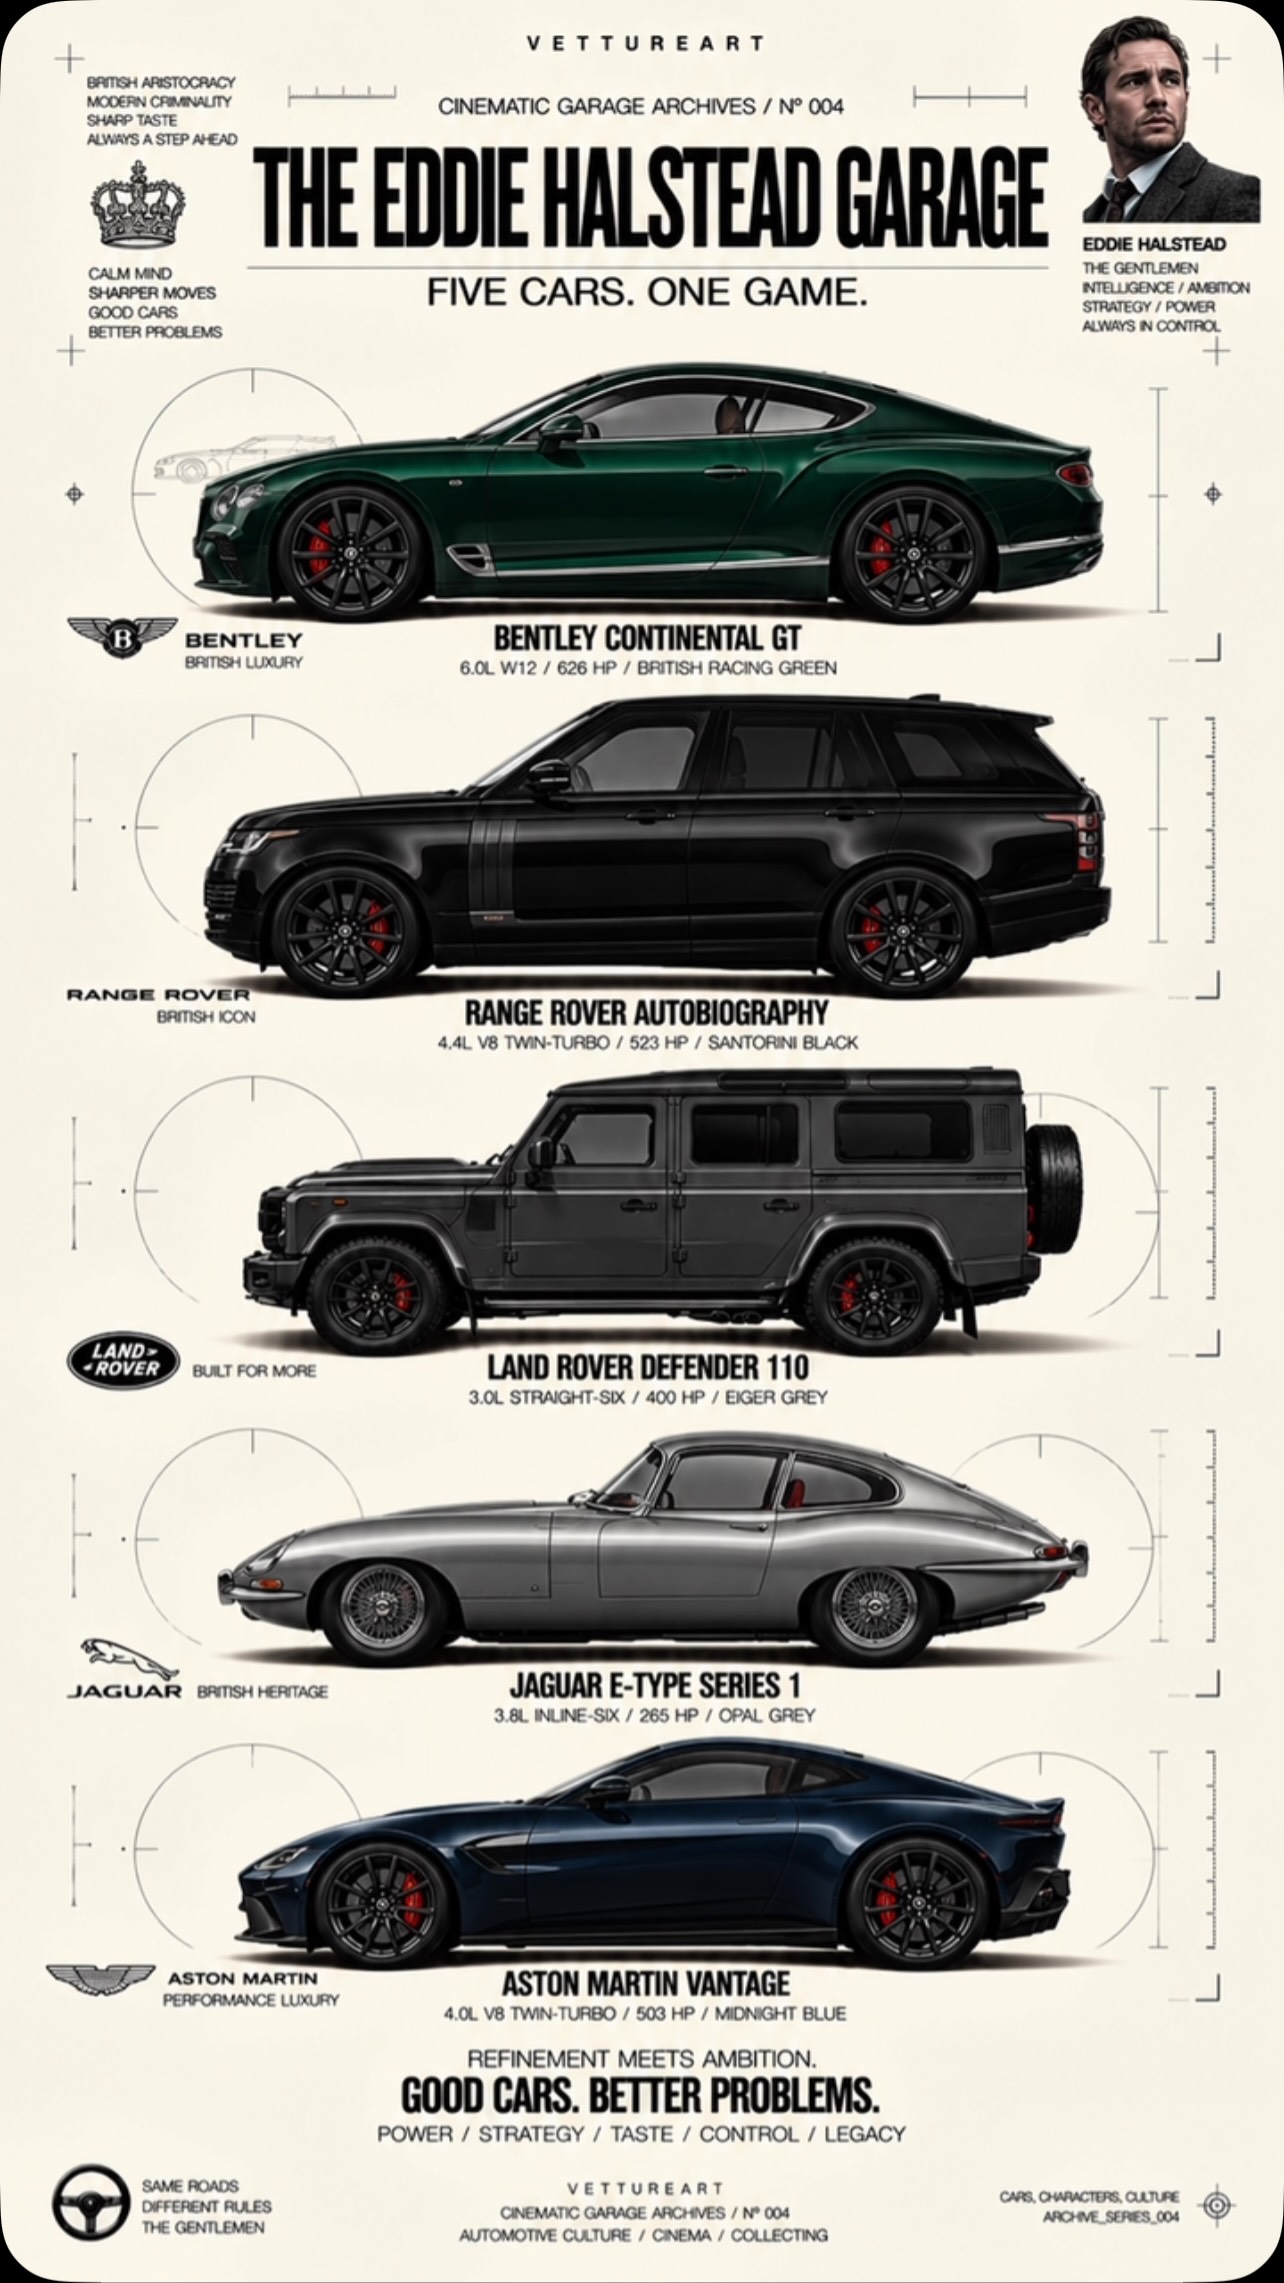 218.6KGraphic lists character's five cars@vetture_art · Showcase Carousel
 503K1.4×Meme frames nostalgic car culture montage@patina.research · Nostalgia Highlight
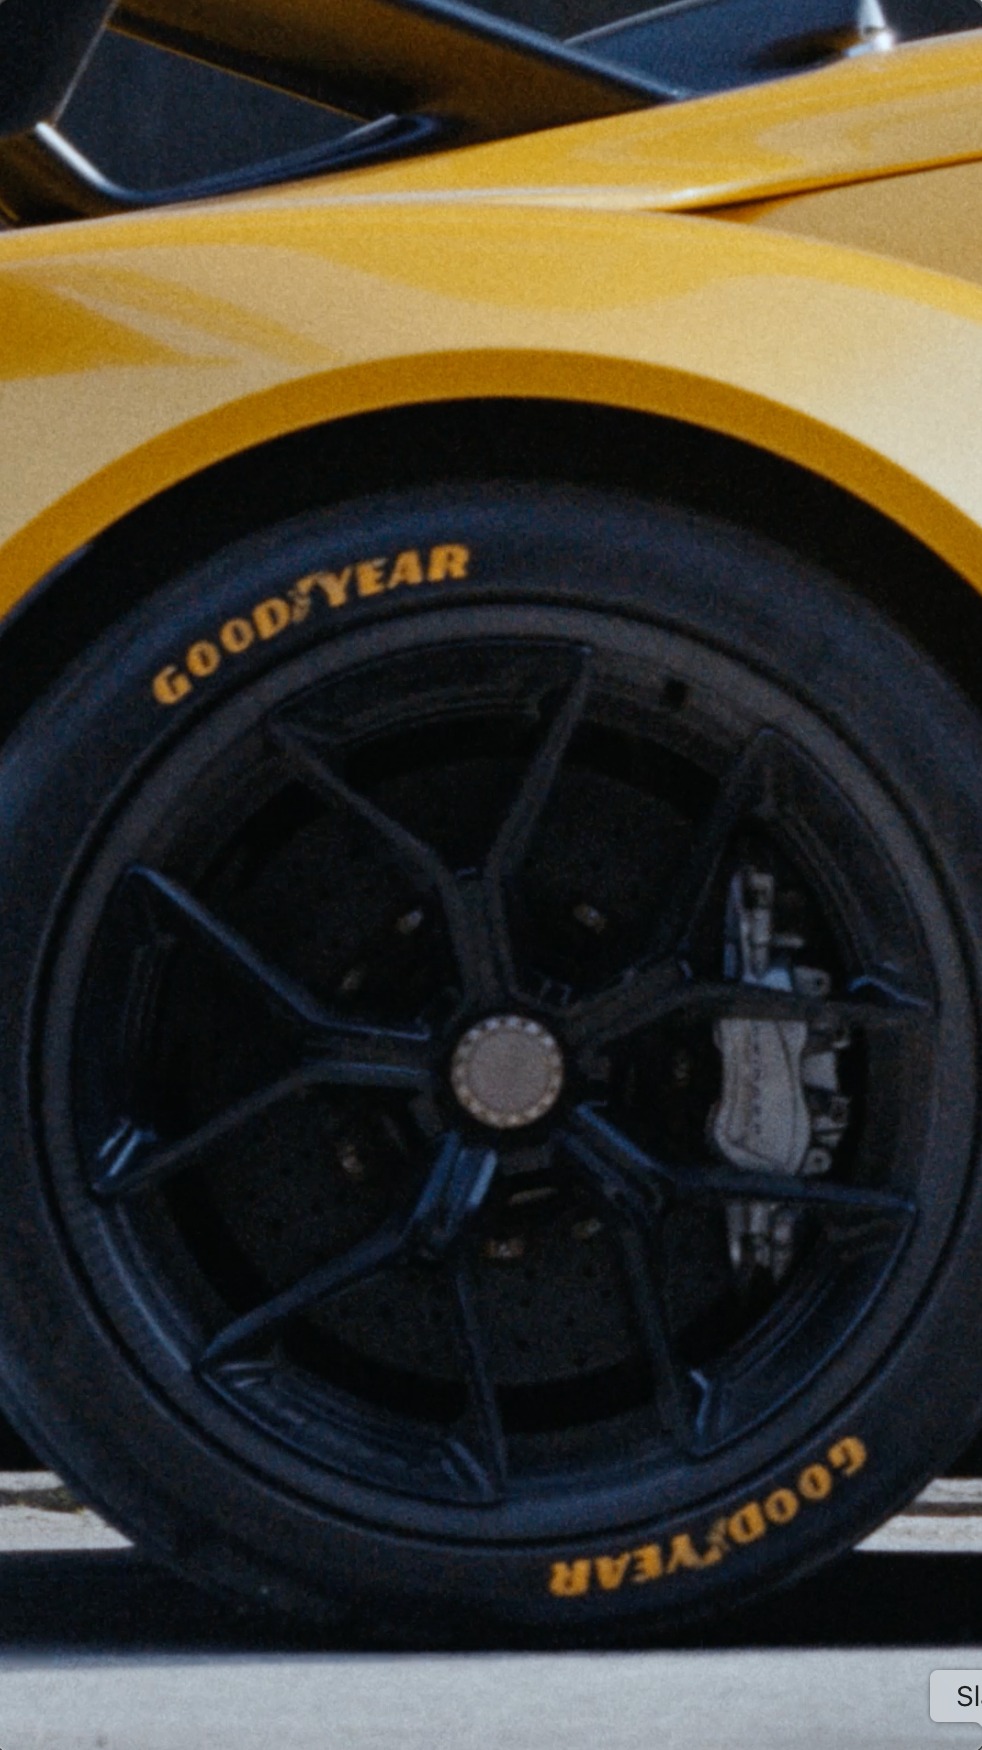 2.1M132.9×Cinematic car race with imagination twist@goodyear · Brand Manifesto
 444.1K3.5×Aesthetic montage of VIP cars@patina.research · Vibe Showcase
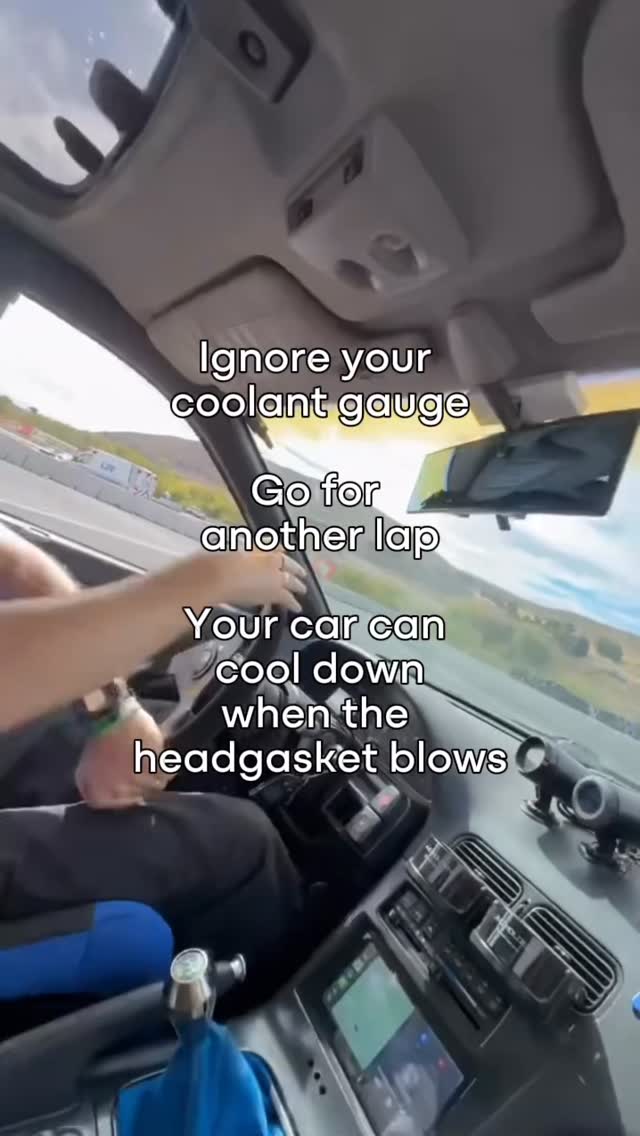 144.2K1.8×Sarcastic advice for track driving@flock_mfg · Relatable One Shot
 470.5K4.1×Montage of low race cars@patina.research · Nostalgia Highlight
 778.3K1.9×Fast-paced Honda VTEC racing montage@patina.research · Vibe Showcase
 3.7M70.8×Funny game show moments without context@f1
 13.2M75.3×Interactive video game driving experience@xbox
 1.3M4.6×Cinematic car team arrival montage@canvai.ca · Lifestyle Showcase
[04]
[05]
What stops the scroll in the first 3 seconds
Title hook · 50%
CARS & THEIR DRIVERS
Visual hook · 50%
A colorful and organized 2x2 matrix chart filled with images of various cars, immediately inviting the viewer to find and categorize familiar vehicles.
[06]
Steal this for your own video
A colorful 2x2 matrix chart on screen, with one axis labeled and the other labeled , and each of the four quadrants filled with images of sorted into funny stereotype labels.
[07]
The promise the opener makes, and how the video pays it back
Hook
The instant reveal of a dense, titled chart that promises a humorous and opinionated classification of a familiar subject, compelling the viewer to pause and explore.
Payoff
The payoff is the viewer's internal reaction of agreement, disagreement, or amusement, which is then externally channeled by a direct call to action that explicitly asks for their opinion, converting passive viewing into active engagement and debate.
[08]
The structural pattern this video runs on
Framework
The Archetype Matrix
Presenting a complete, humorous 2x2 classification matrix about a relatable topic, prompting viewers to self-identify and debate the placement of examples.
The System Unveiling
The title and axes are presented simultaneously, establishing the core premise and the two variables used for judgment. This provides the 'rules of the game' for the viewer to understand the classifications.
The Archetype Naming
The four named quadrants are presented, giving humorous, memorable names to the behavioral combinations. This translates the abstract axes into relatable character types that anchor the viewer's understanding.
The Validation Gauntlet
The viewer is invited to scan the specific, plotted examples within the framework. This is the core interactive phase where they confirm their biases, find their own identity within the chart, and identify points of contention, driving an internal emotional response.
Which drivers did I get wrong? Car drivers, plotted by showing off × road rage. Follow @everythingplotted for more charts like these. #drivers
title · throughout
CARS & THEIR DRIVERS
branding · throughout
@everythingplotted
informational · throughout
Takes Merging Personally
informational · throughout
Lets You Merge
informational · throughout
Just Commuting
contextual · throughout
Commuter Combat
contextual · throughout
Ego Express
contextual · throughout
Peaceful Errands
contextual · throughout
Sunday Showoffs
call-to-action · throughout
Follow @everythingplotted for more charts like this