@nycmayor
Instagram · Carousel
@nycmayor We ran the numbers. Distance: 26 mi Pace: Nonstop Time: Around the clock Our city workers always go the extra mile.

@nycmayor
Instagram · Carousel
@nycmayor We ran the numbers. Distance: 26 mi Pace: Nonstop Time: Around the clock Our city workers always go the extra mile.
Performance
Video #48833 · Carousel
[01]
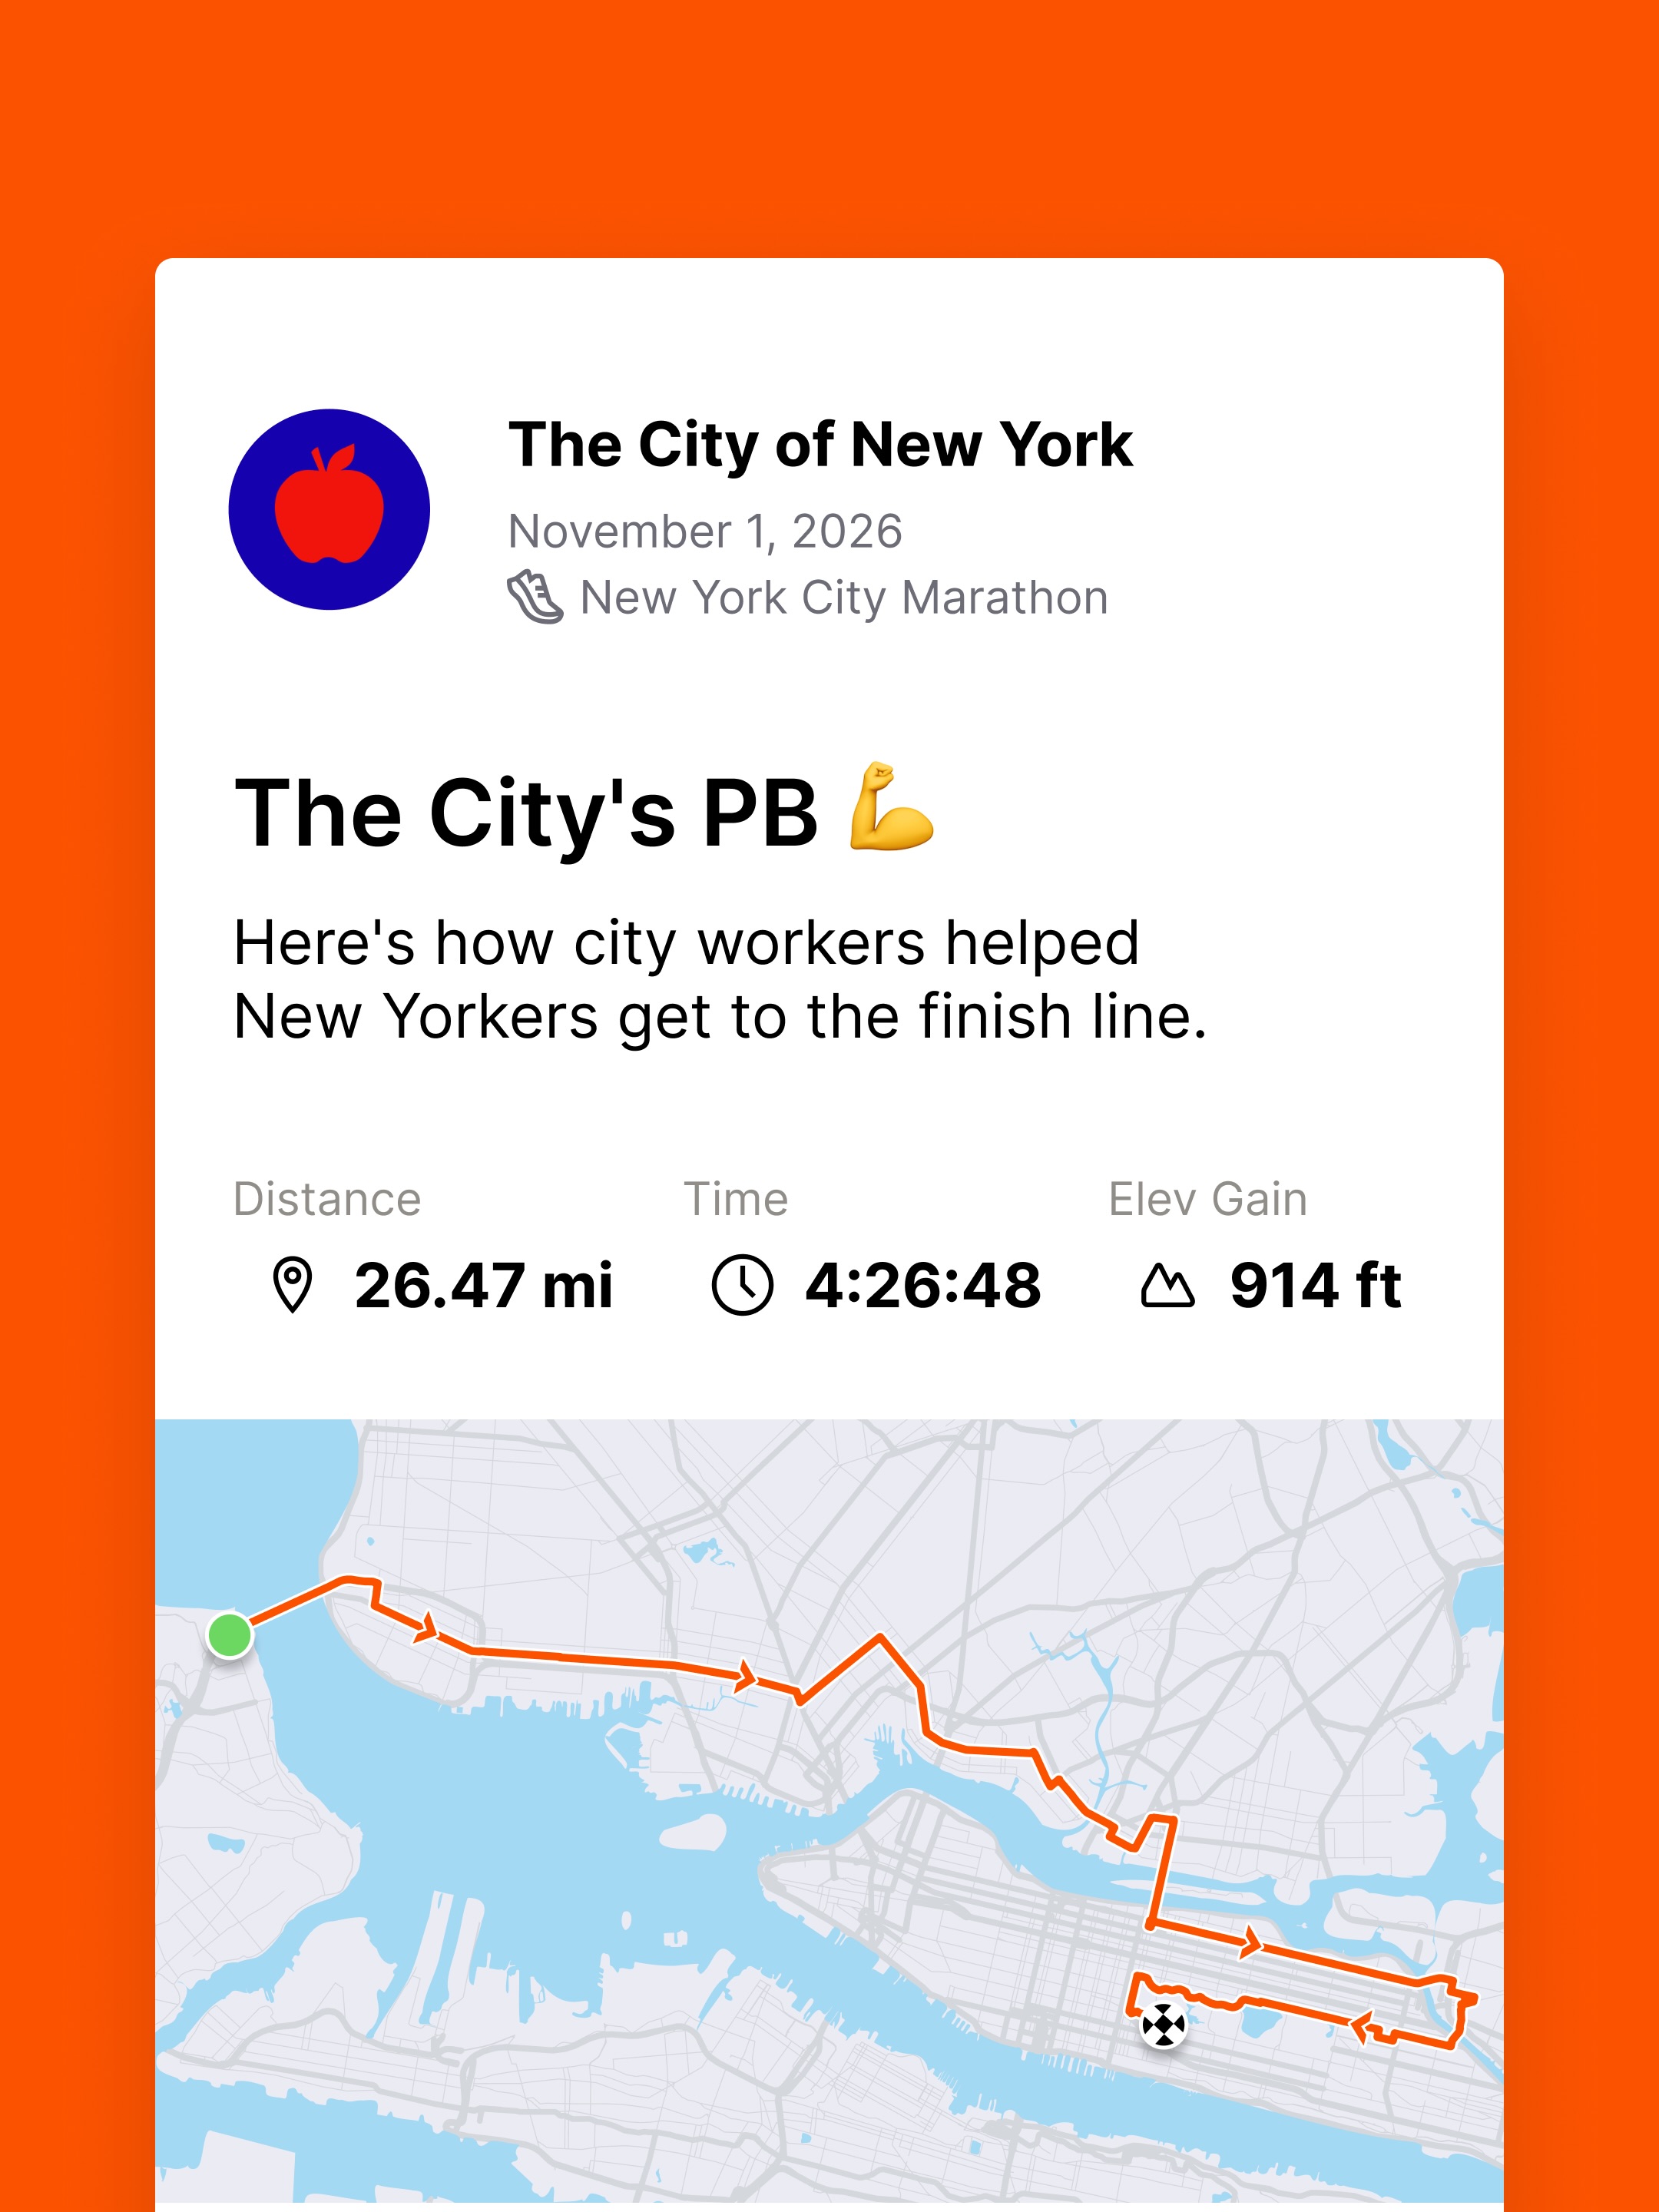
This is a five-slide carousel post from 'The City of New York' celebrating the work of city employees in preparing for the NYC Marathon. The first slide frames the event as the city's 'Personal Best' (PB) using a running app interface. Subsequent slides use large numbers and text overlays on relevant photos to quantify the effort, such as potholes repaired, racers transported, and paint used, culminating in a thank you to the city workers.
[02]
[03]
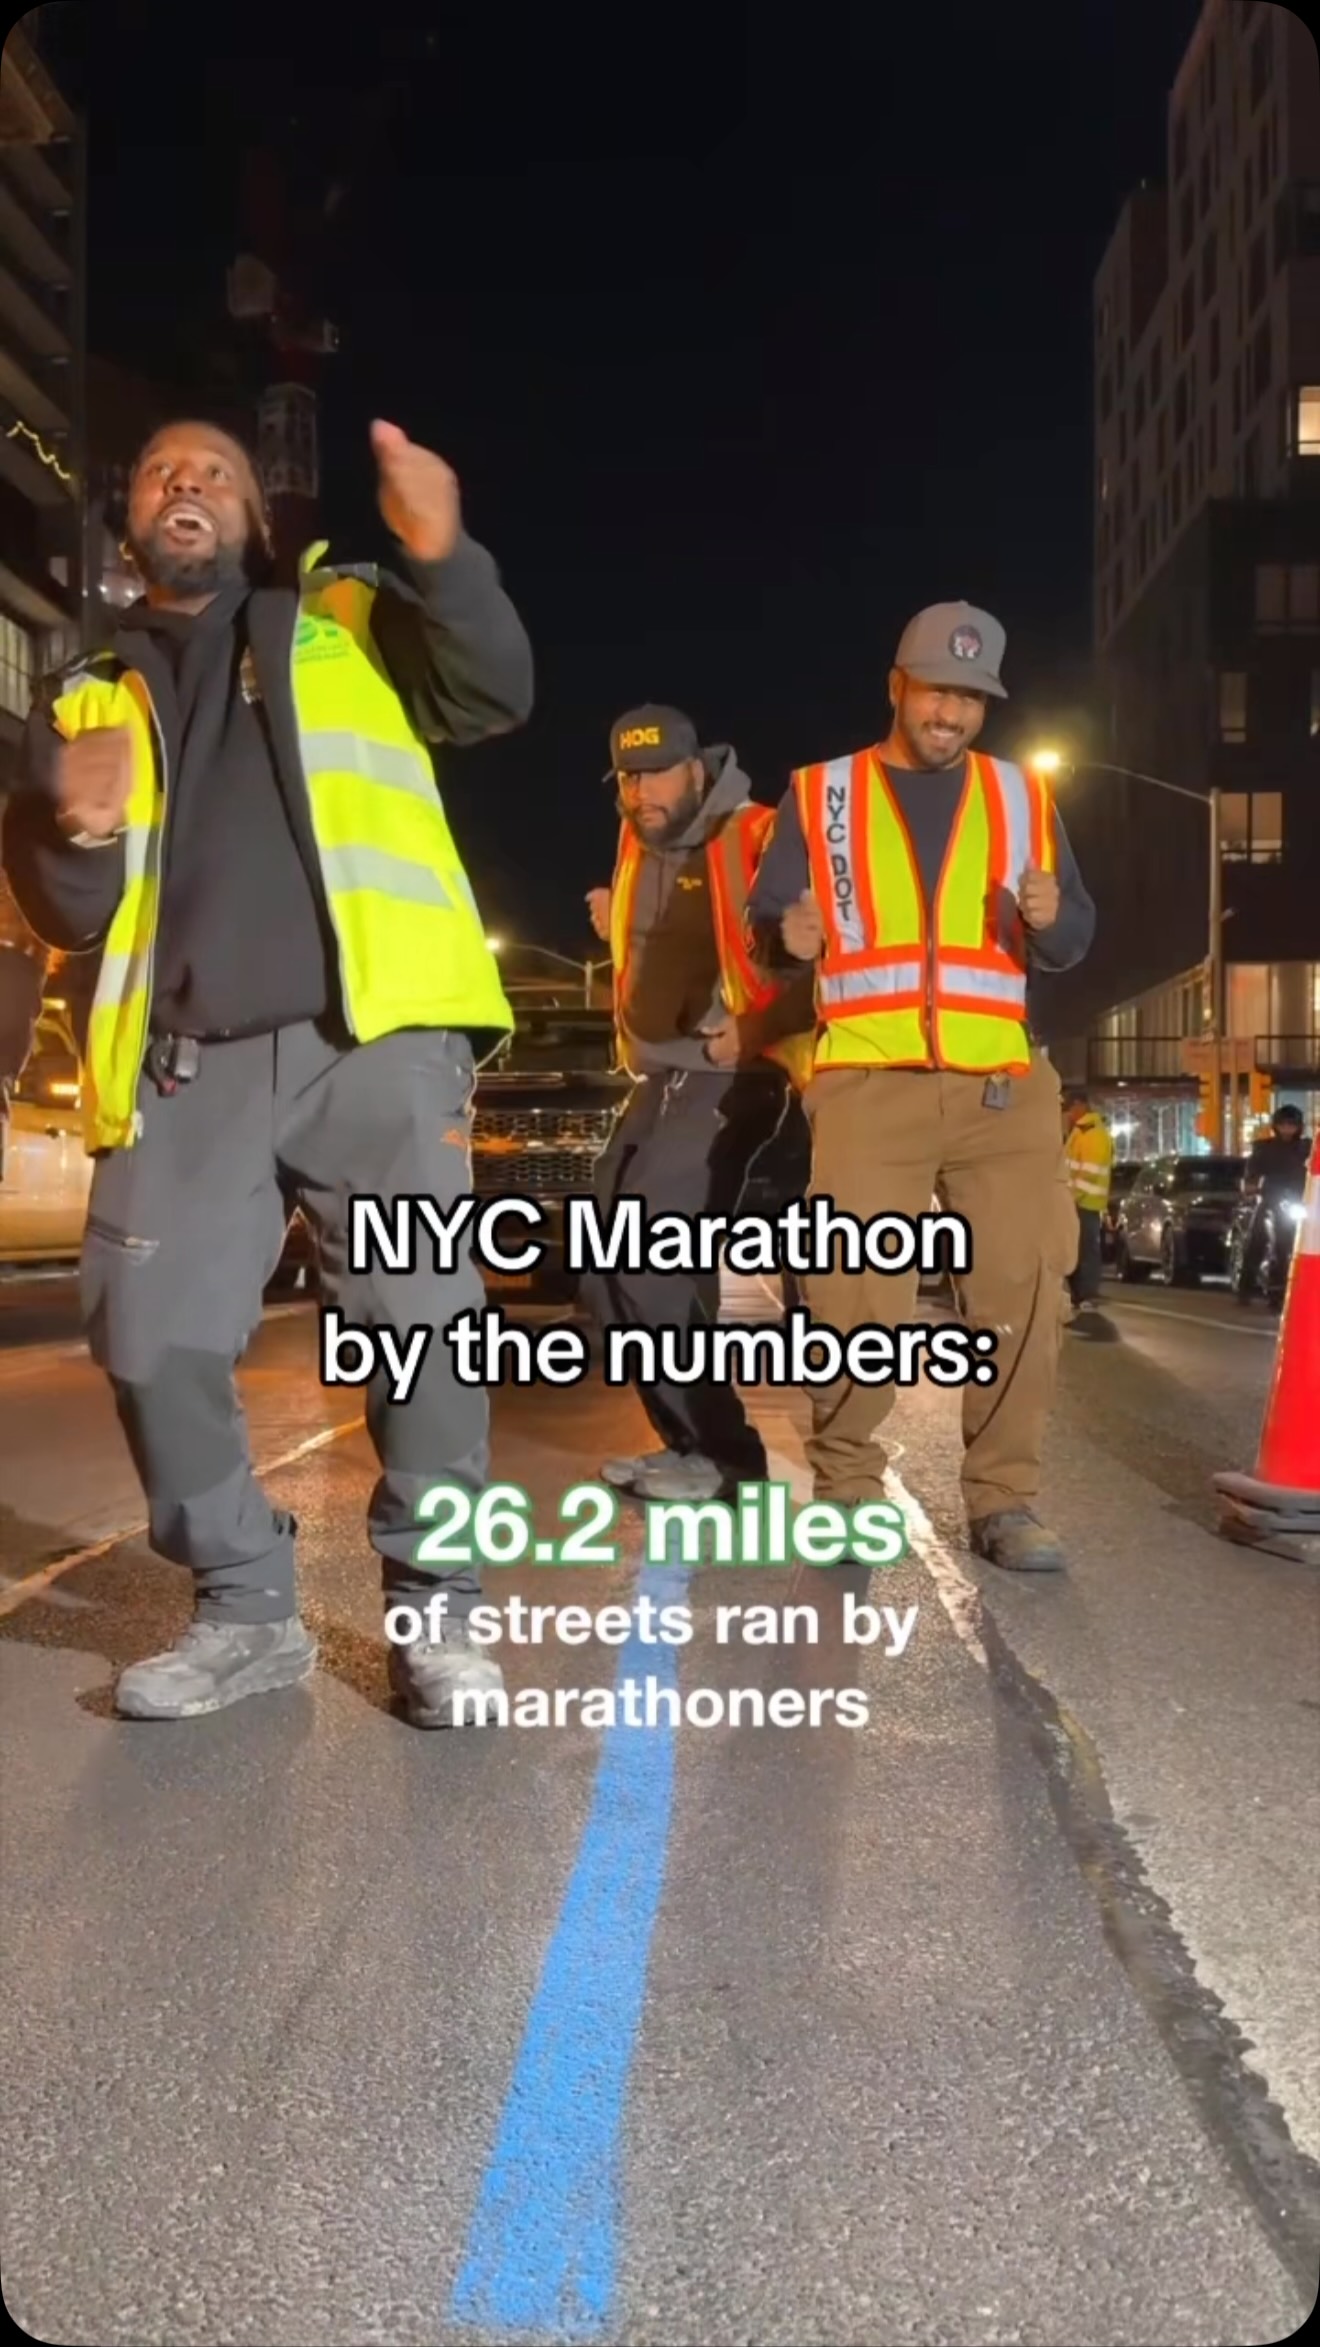 266.3K13.7×Celebratory marathon facts listicle@nyc_dot · Milestone Celebration
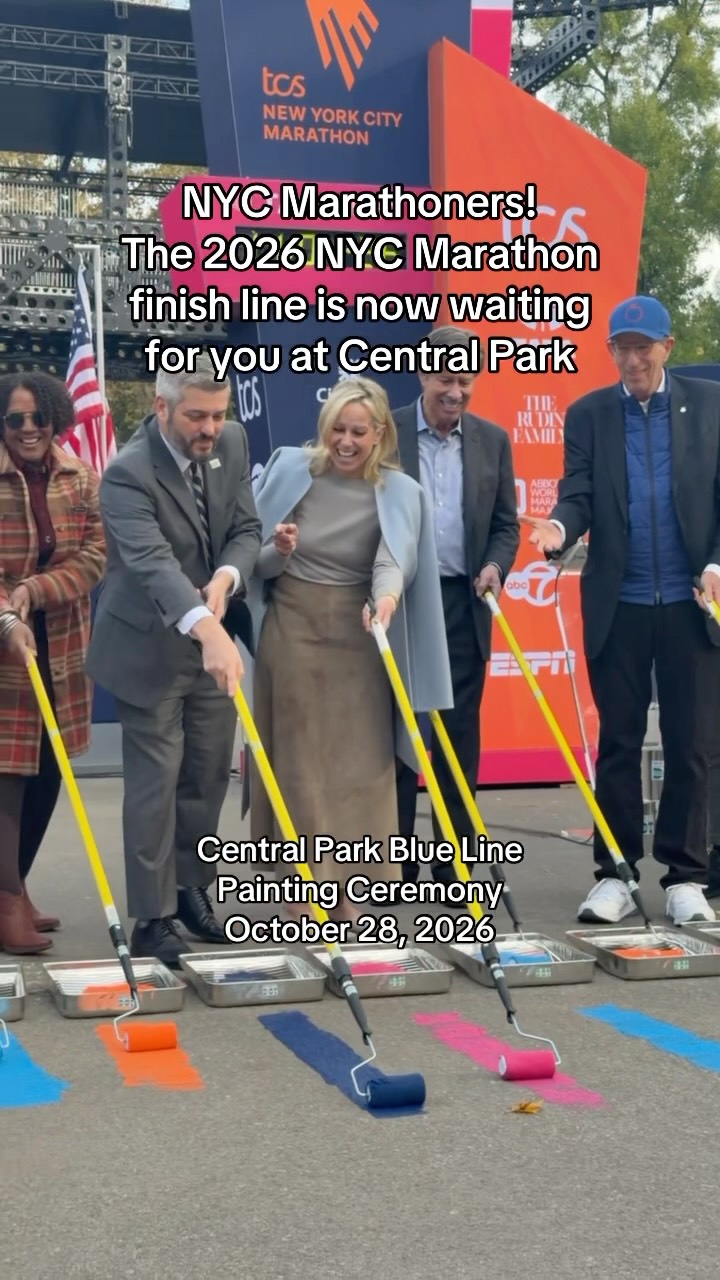 278.8K14.4×Showcasing marathon preparation ceremony@nyc_dot · Event Showcase
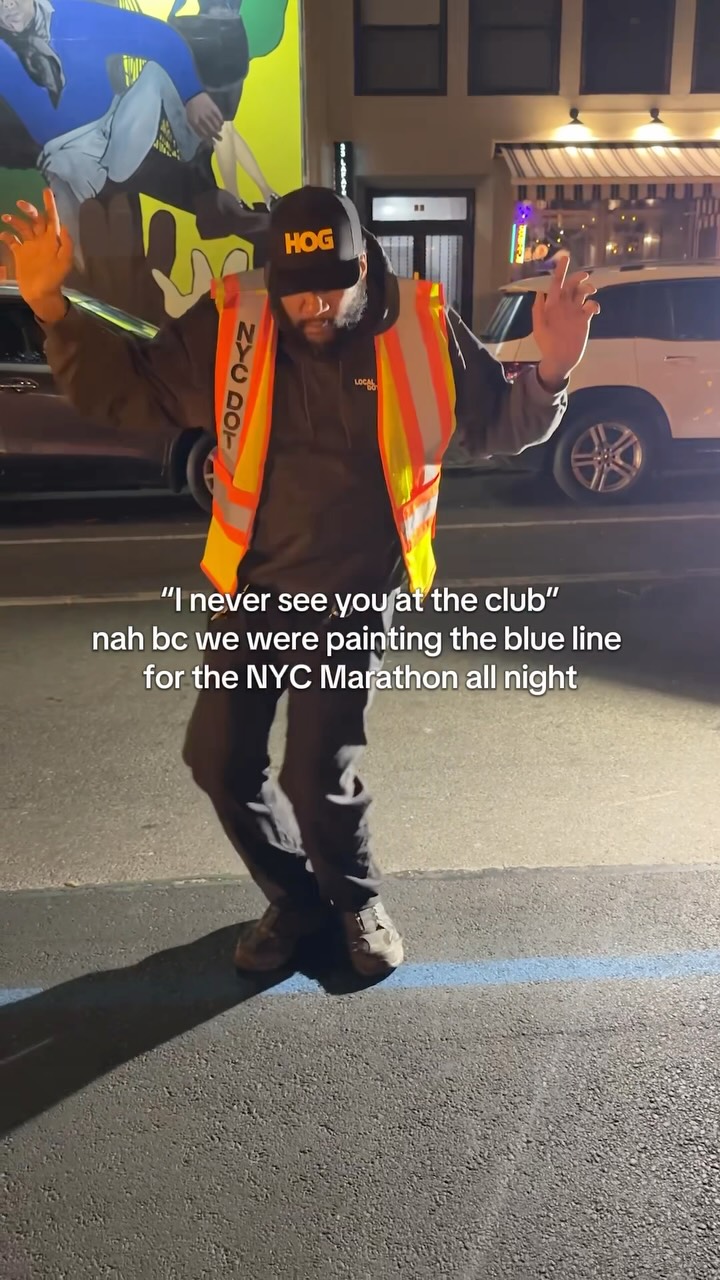 1.1M54×Behind the scenes painting marathon line@nyc_dot · Behind The Scenes
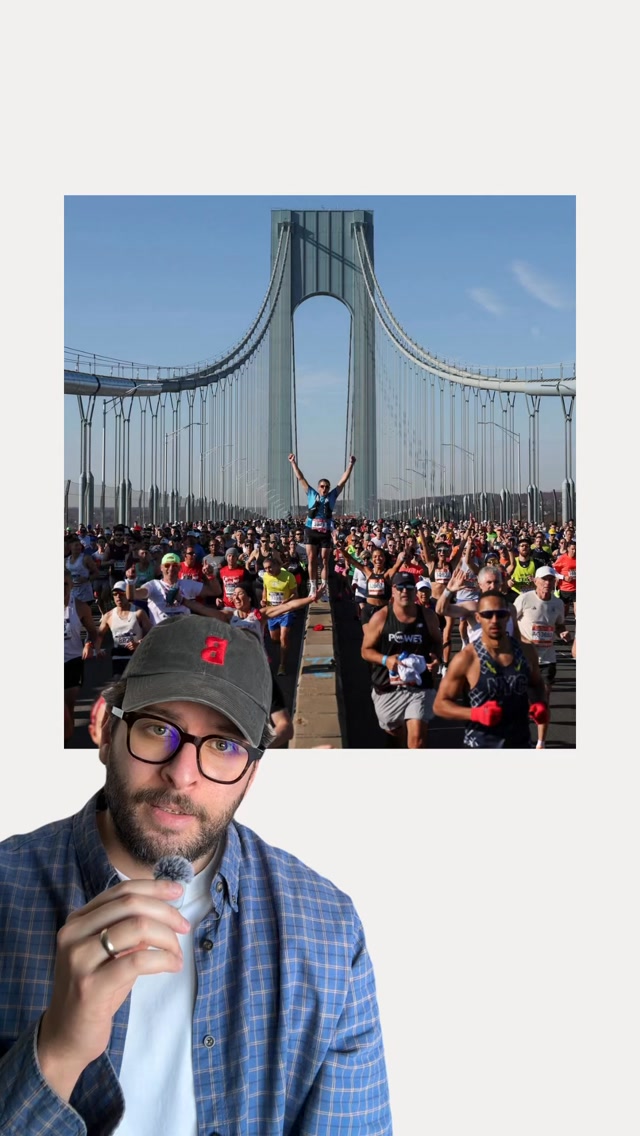 132.3K25.1×NYC Marathon origin story explainer@janfeterman · Origin Story
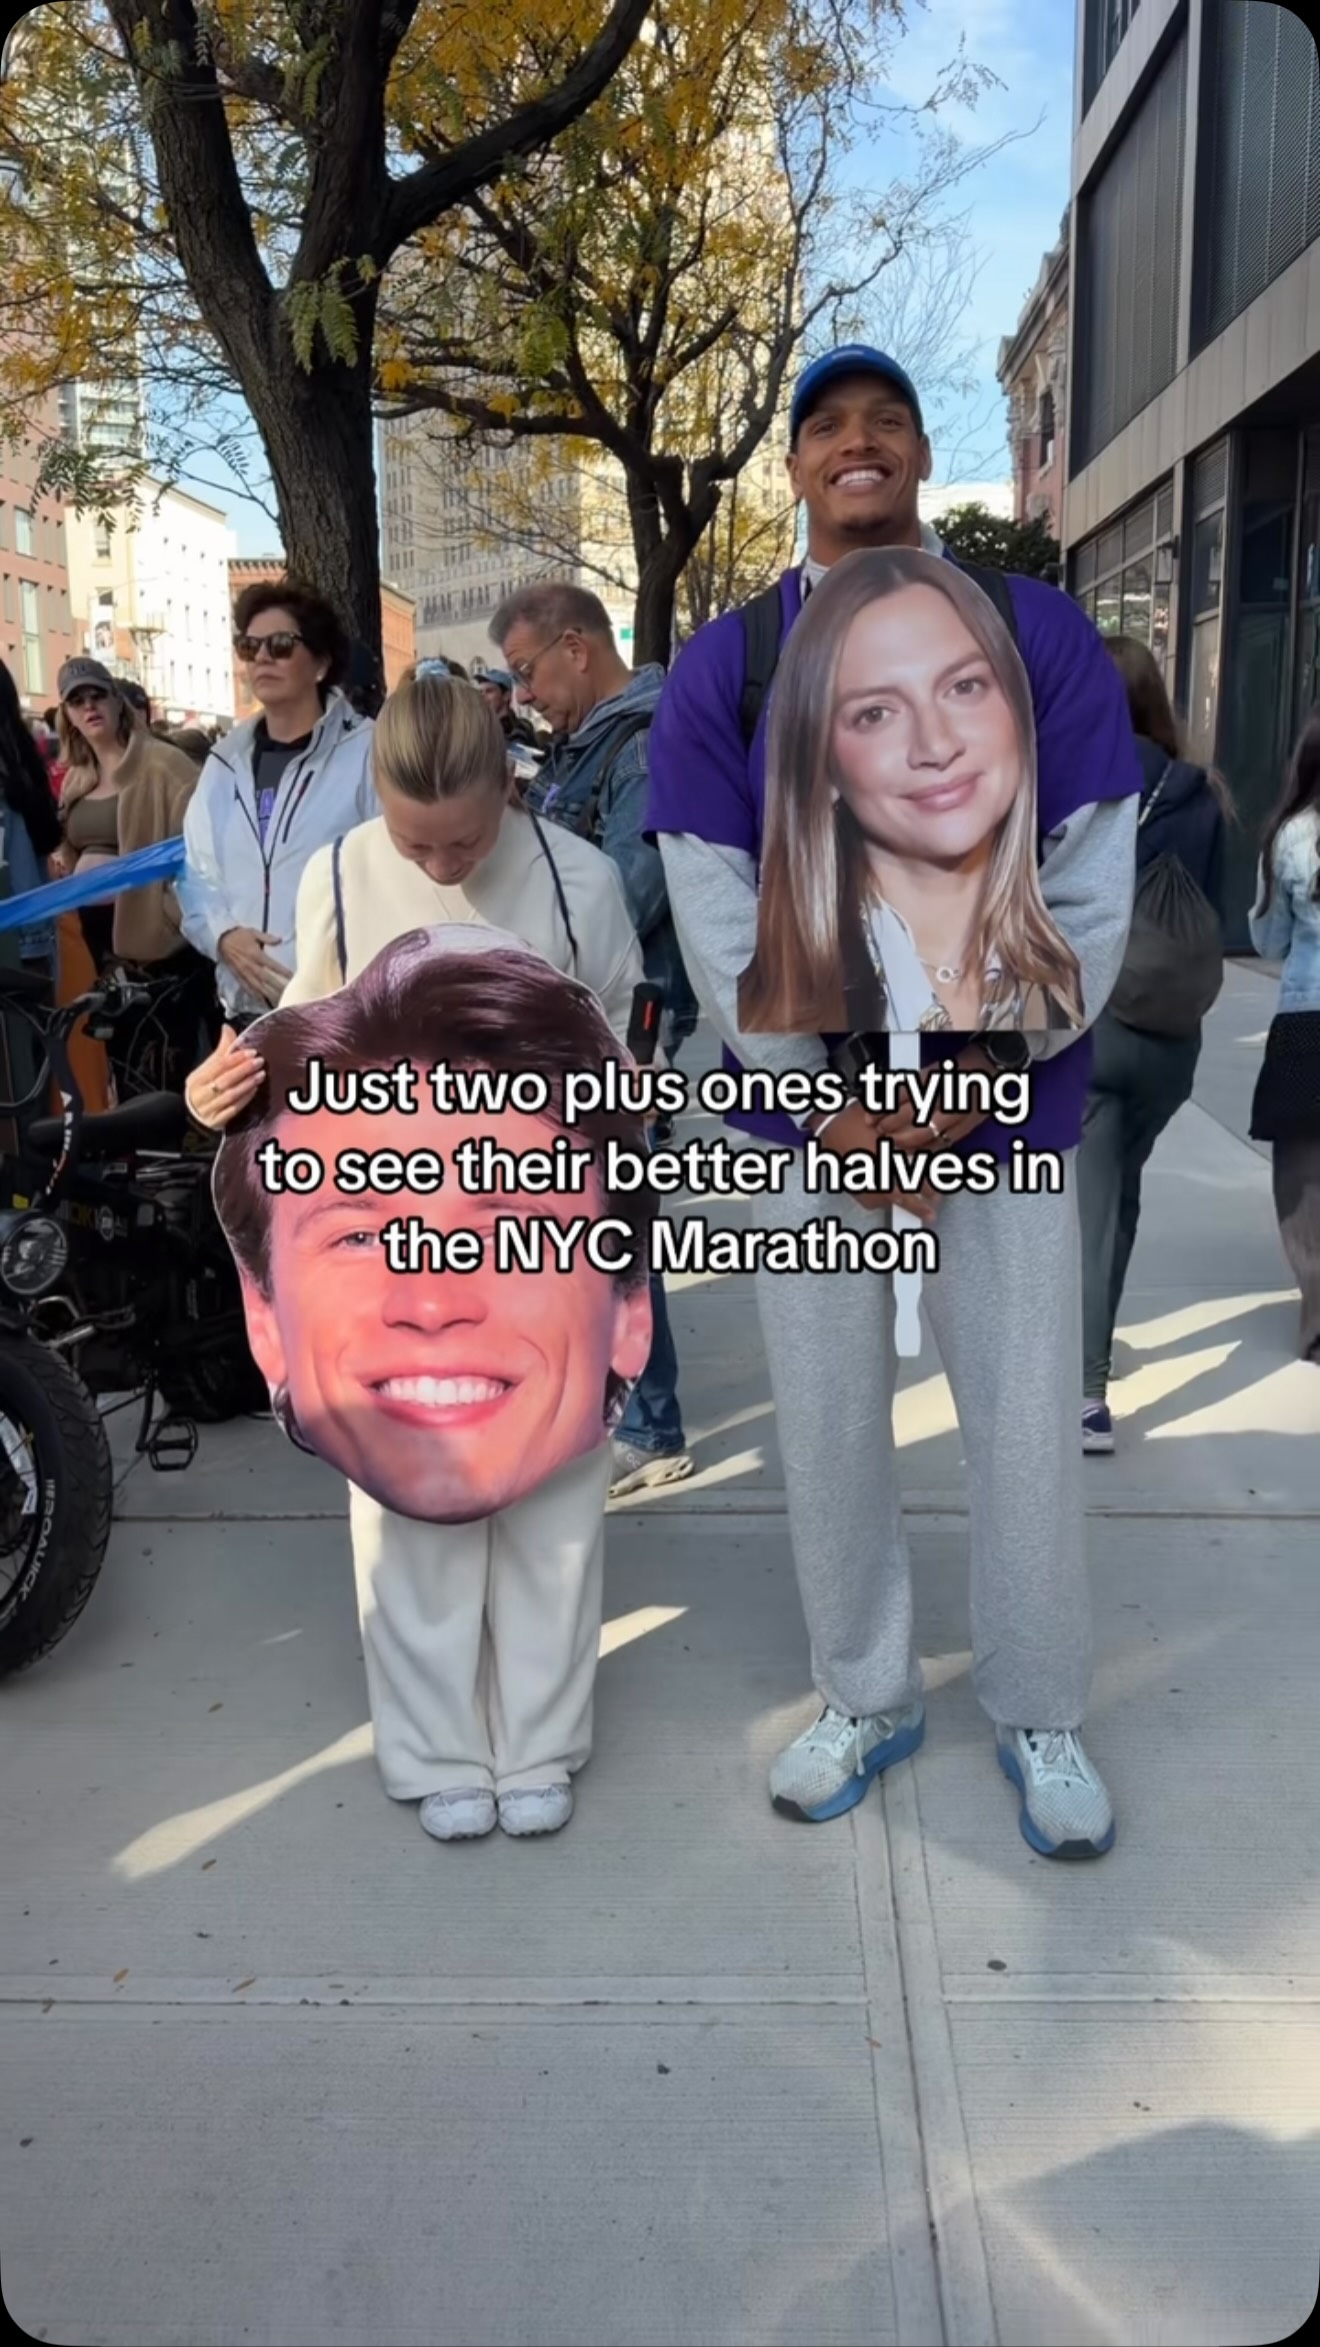 1.9M33.6×Marathon supporters with funny signs@isaacrochell · Lifestyle Showcase
 507.1K2.3×Aesthetic NYC travel lifestyle montage@rexchexng · Vibe Showcase
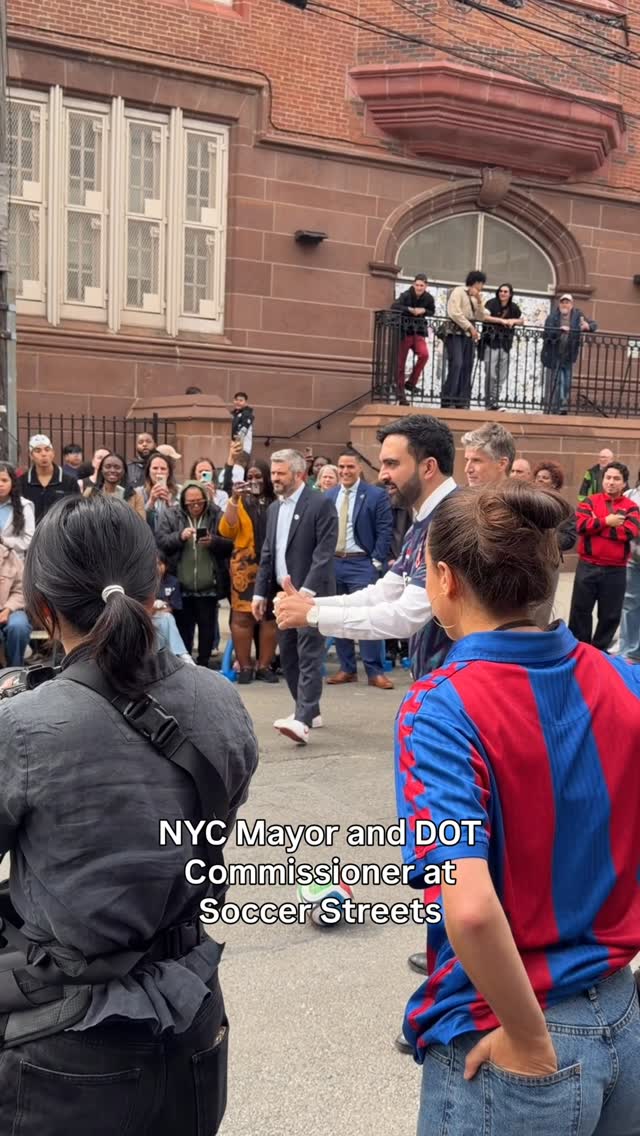 982.6K2.7×Community street soccer event highlights@nyc_dot · Event Showcase
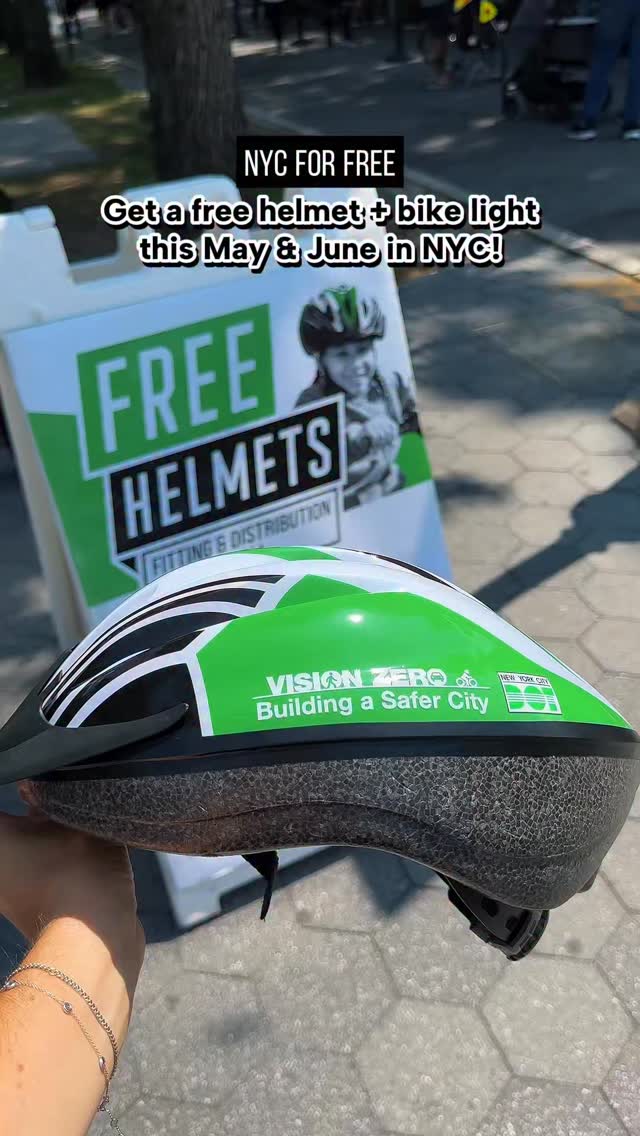 232.1K2.8×NYC free event schedule montage@nyc_forfree · Public Service Announcement
 171K15.4×Rapid montage of city landmarks@alexanewyorkcity · Location Showcase
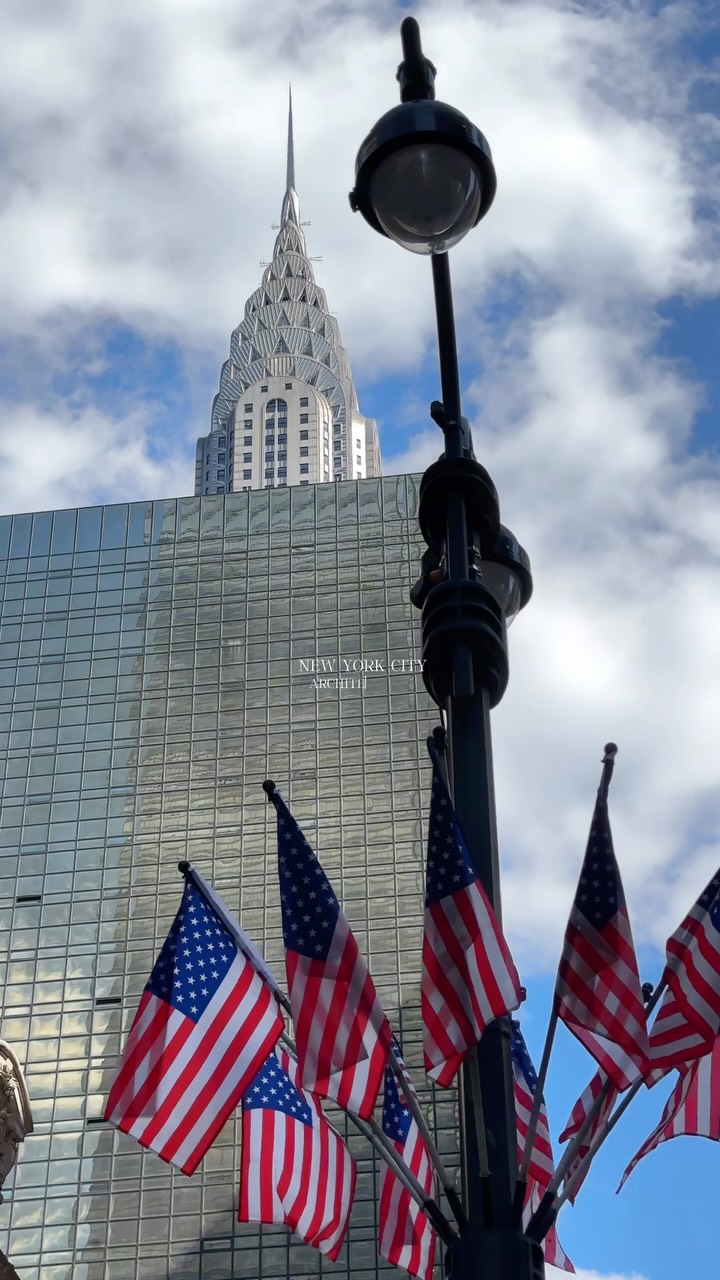 164.6K14.5×Rapid montage of NYC architecture@alexanewyorkcity · Location Showcase
 167.6K10.9×Aesthetic montage of NYC locations@alexanewyorkcity · Location Showcase
 193.3K2.2×Cinematic running vlog in NYC@marcusmilione · Lifestyle Showcase
[04]
[05]
What stops the scroll in the first 3 seconds
Title hook · 50%
The City's PB 💪
Verbal hook · 30%
We ran the numbers.
Visual hook · 20%
The first slide mimics the user interface of a popular running app (like Strava), which creates immediate recognition and curiosity for an audience interested in running and fitness.
[06]
Steal this for your own video
's 💪
[07]
The promise the opener makes, and how the video pays it back
Hook
The first slide grabs attention by co-opting a familiar visual format (a fitness app summary) and applying it to an unexpected subject (a city's operations). This creates an immediate, clever metaphor that frames the entire narrative.
Payoff
The final slide shifts from data to humanity. It delivers the emotional resolution by explicitly thanking or giving 'kudos' to the people behind the numbers, connecting the large-scale effort back to the individuals responsible and providing a heartfelt conclusion.
[08]
The structural pattern this video runs on
Framework
The Quantified Tribute
Reframe a large-scale, complex group effort into a simple, relatable achievement (e.g., a 'Personal Best'). Then, use a series of large, impressive numbers to quantify the 'behind-the-scenes' work required, and conclude by dedicating the achievement to the people responsible.
The Explicit Premise
Immediately following the hook on slide 1, a clear, concise statement ('Here's how...') tells the audience the purpose of the carousel, setting expectations and promising a reveal of the effort behind the achievement.
The Quantified Evidence Stack
A series of slides that each present a single, large, impressive number tied to a specific behind-the-scenes effort. This provides concrete, easily digestible proof for the initial premise and builds a sense of scale and awe with each swipe.
We ran the numbers. Distance: 26 mi Pace: Nonstop Time: Around the clock Our city workers always go the extra mile.
branding · photo_0
The City of New York November 1, 2026 New York City Marathon
title · photo_0
The City's PB 💪
contextual · photo_0
Here's how city workers helped New Yorkers get to the finish line.
informational · photo_0
Distance 26.47 mi
informational · photo_0
Time 4:26:48
informational · photo_0
Elev Gain 914 ft
informational · photo_1
Potholes and roadway defects repaired for the race 801
informational · photo_2
Racers transported to starting point via Staten Island Ferry 34,329
informational · photo_3
Gallons of blue paint used for the marathon line 55
statement · photo_4
Kudos to the city workers and agencies who make New York City run.