@pgatour
Instagram · Carousel
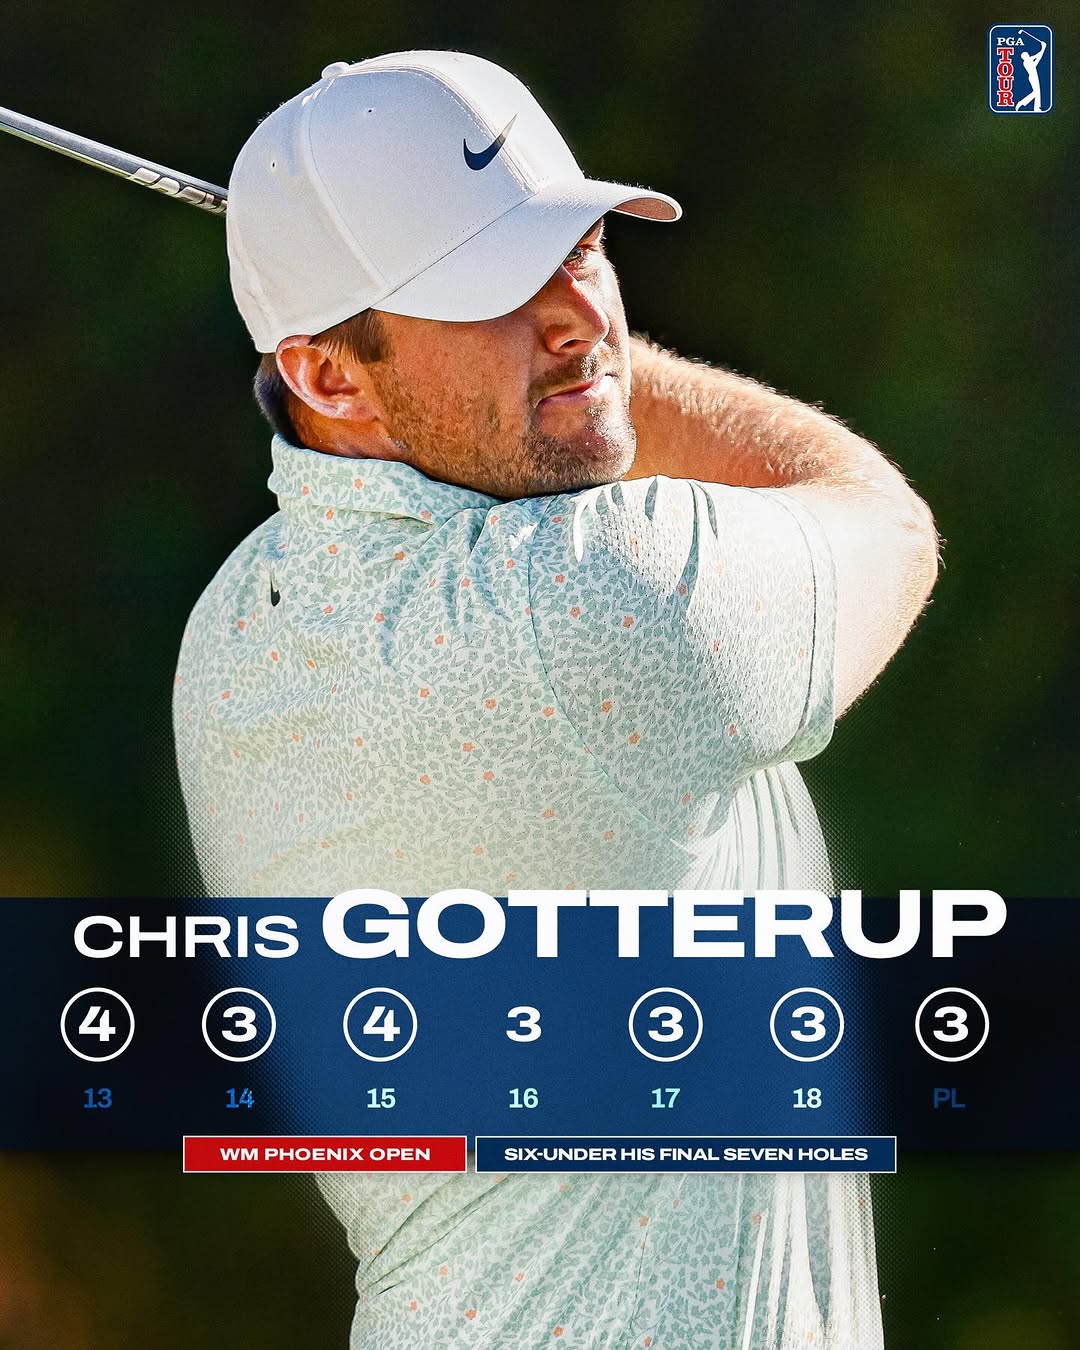
@pgatour This is what greatness looks like. @ChrisGotterup with a rally for the ages @WMPhoenixOpen!

@pgatour
Instagram · Carousel
@pgatour This is what greatness looks like. @ChrisGotterup with a rally for the ages @WMPhoenixOpen!
Performance
Video #29266 · Carousel
[01]
This is a promotional image from the PGA Tour featuring golfer Chris Gotterup. It combines an action shot of him swinging with a detailed graphic overlay that showcases his exceptional score of six-under-par on the final seven holes of the WM Phoenix Open, framing it as a moment of greatness.
[02]
[03]
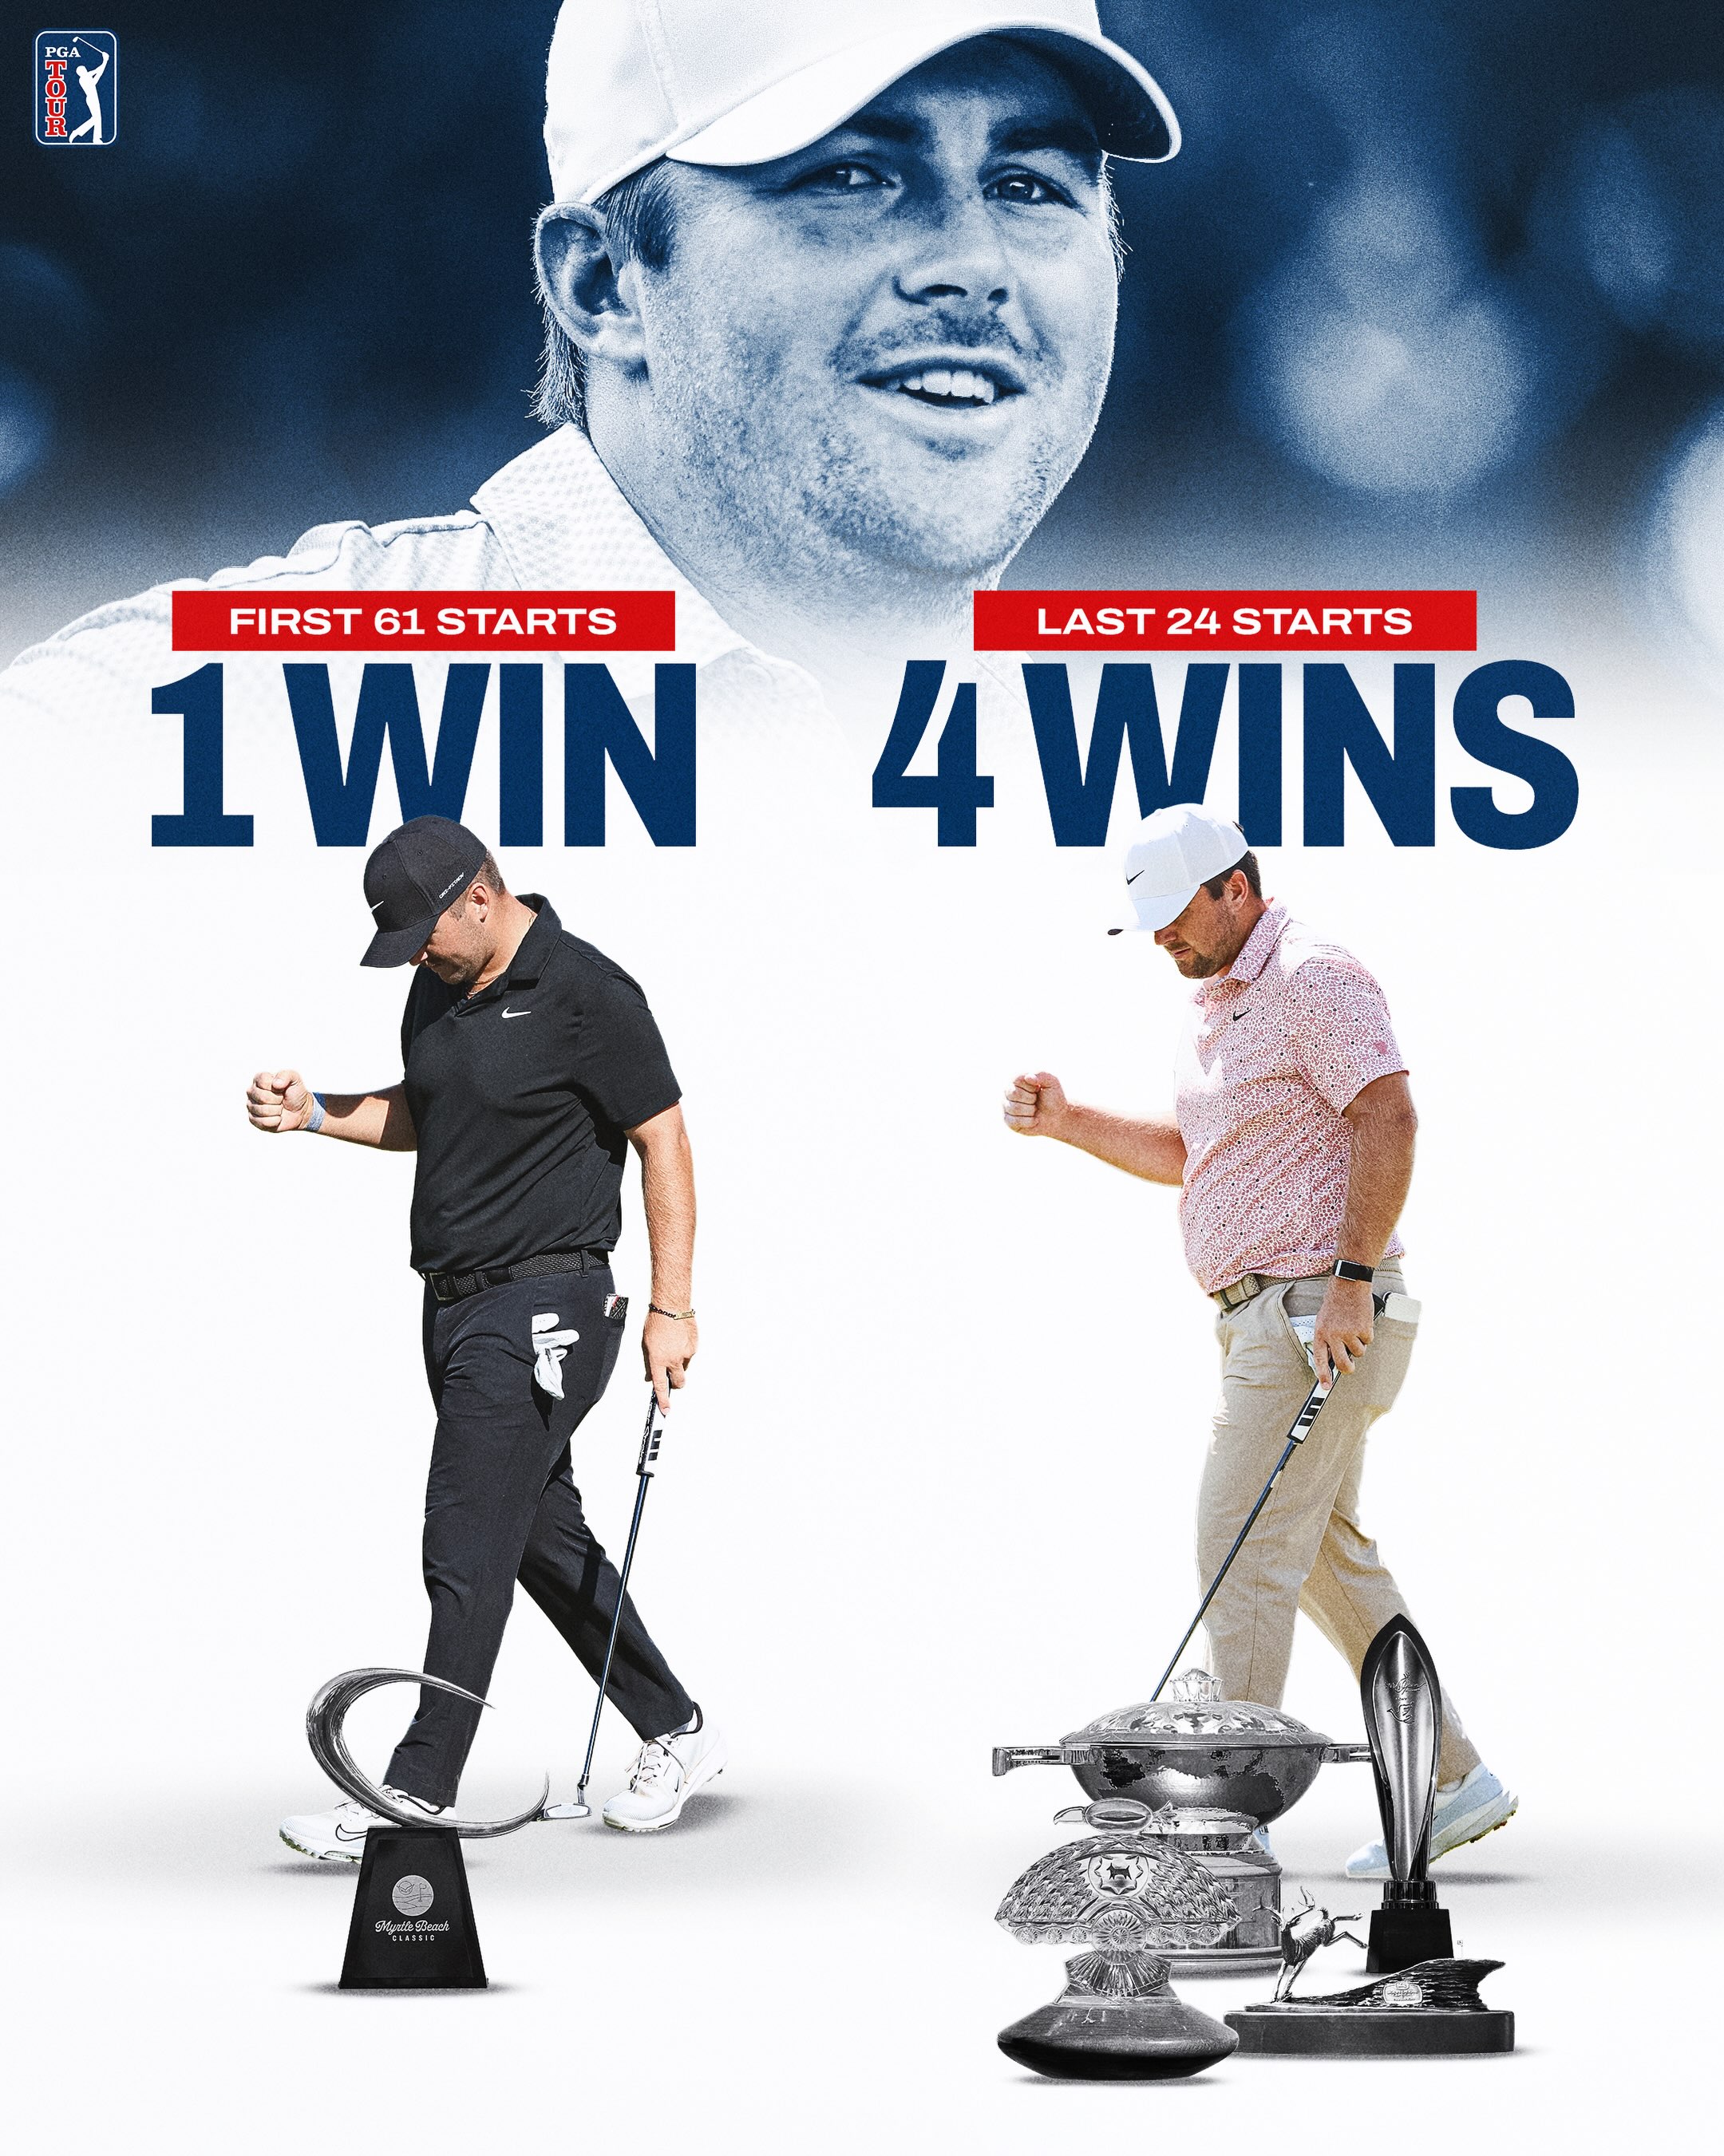 219.7K1.7×Golfer's impressive winning streak graphic.@pgatour · Before/After Transformation
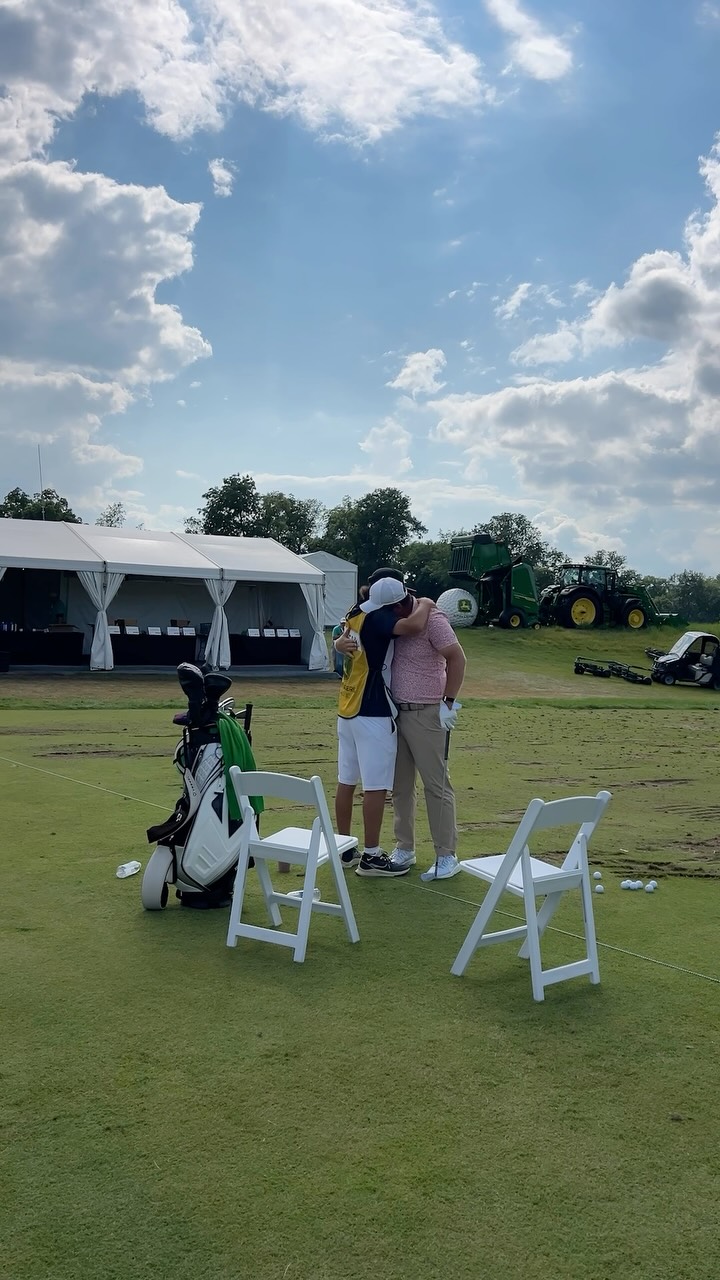 147.9K1.6×Emotional moment golfer becomes champion@johndeereclassic · Climactic Moment Highlight
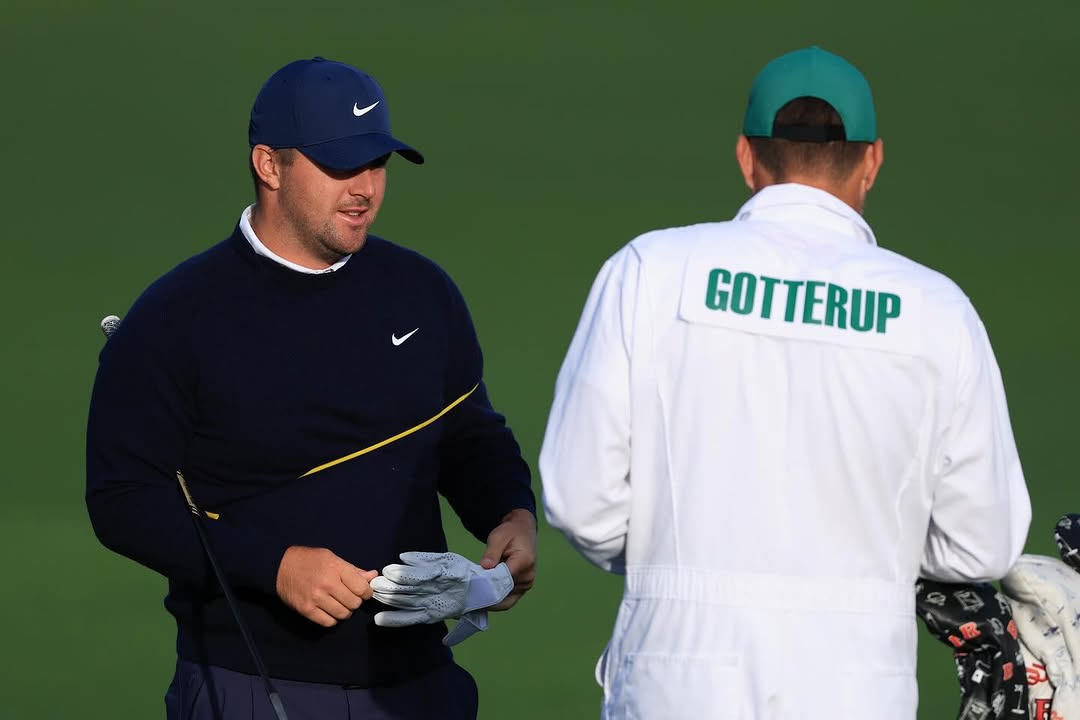 152.5K1.6×Golfer and caddie talking at The Masters@chrisgotterup · Behind The Scenes
 3.1MPro golfer's tournament experience photos.@brysondechambeau · Behind The Scenes
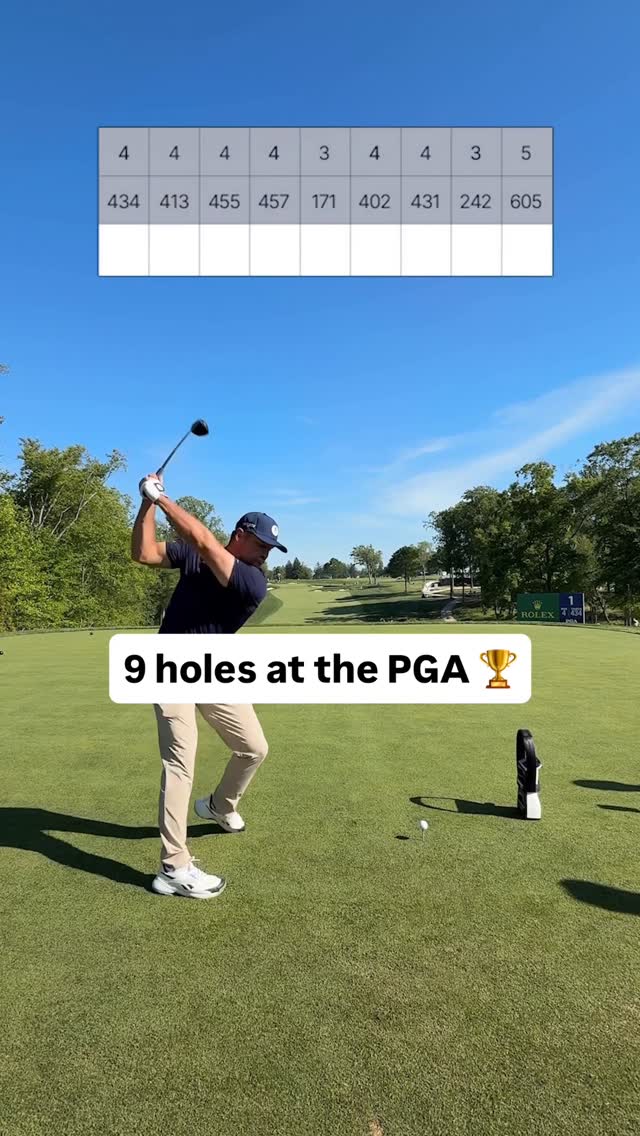 2.2M1.1×Golf round with live scoreboard@brysondechambeau · Journey Documentation
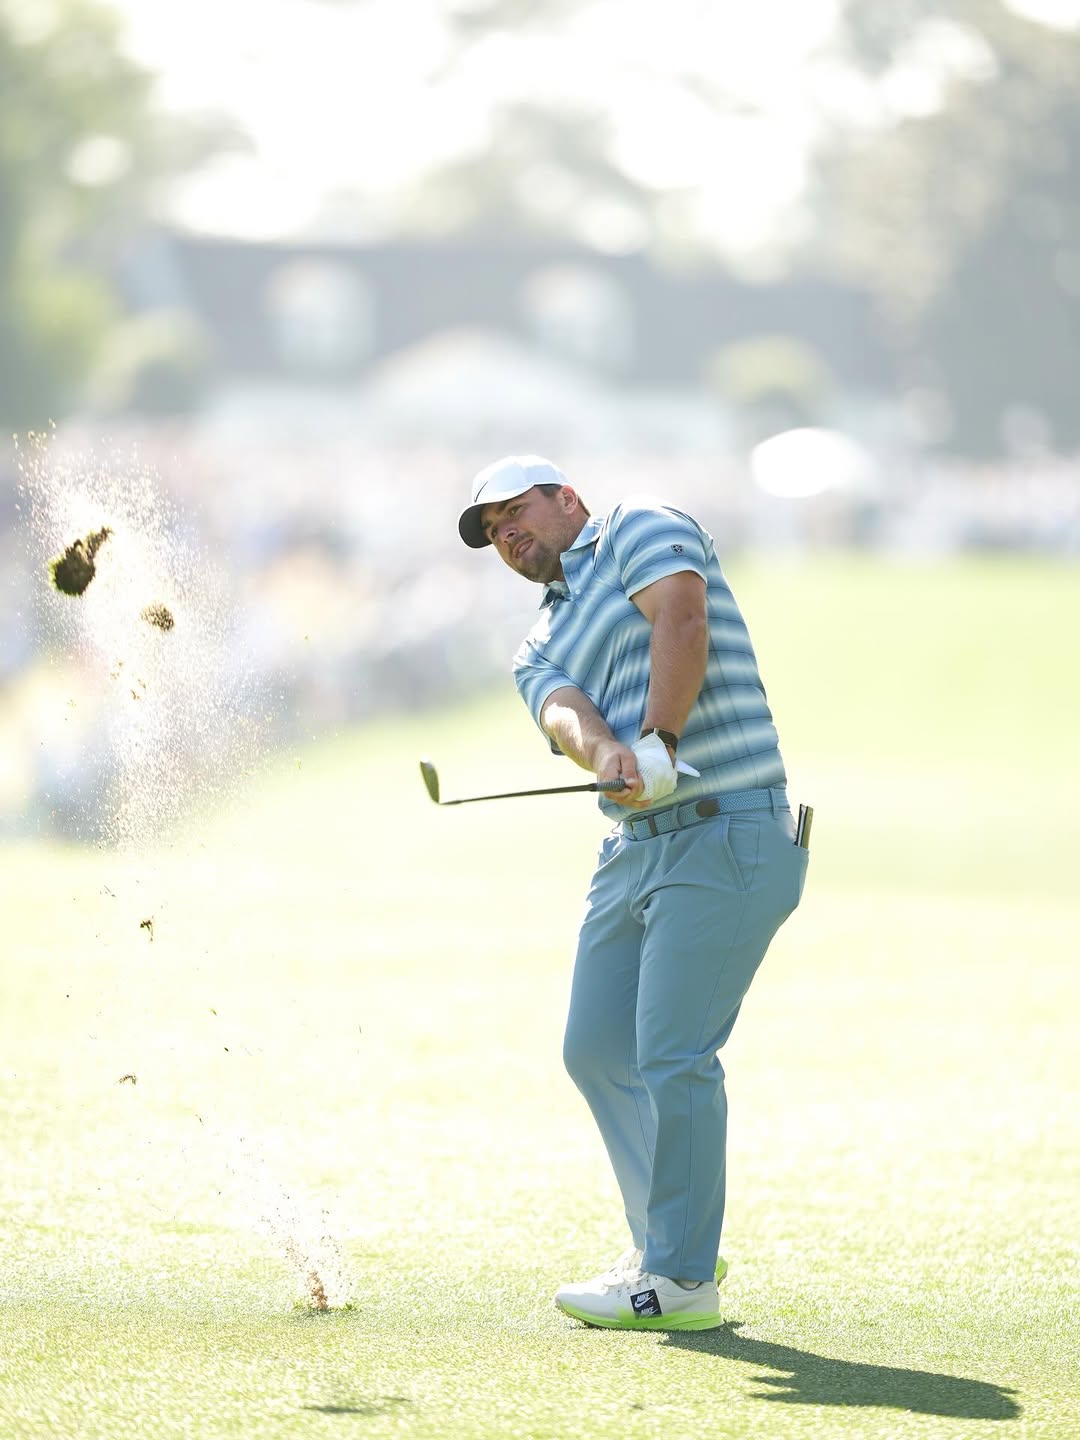 102.5KProfessional golfer mid-swing action shot@chrisgotterup · Action Sequence
 3.2MGolfer's top hole outs countdown@brysondechambeau · Rapid Fire Listicle
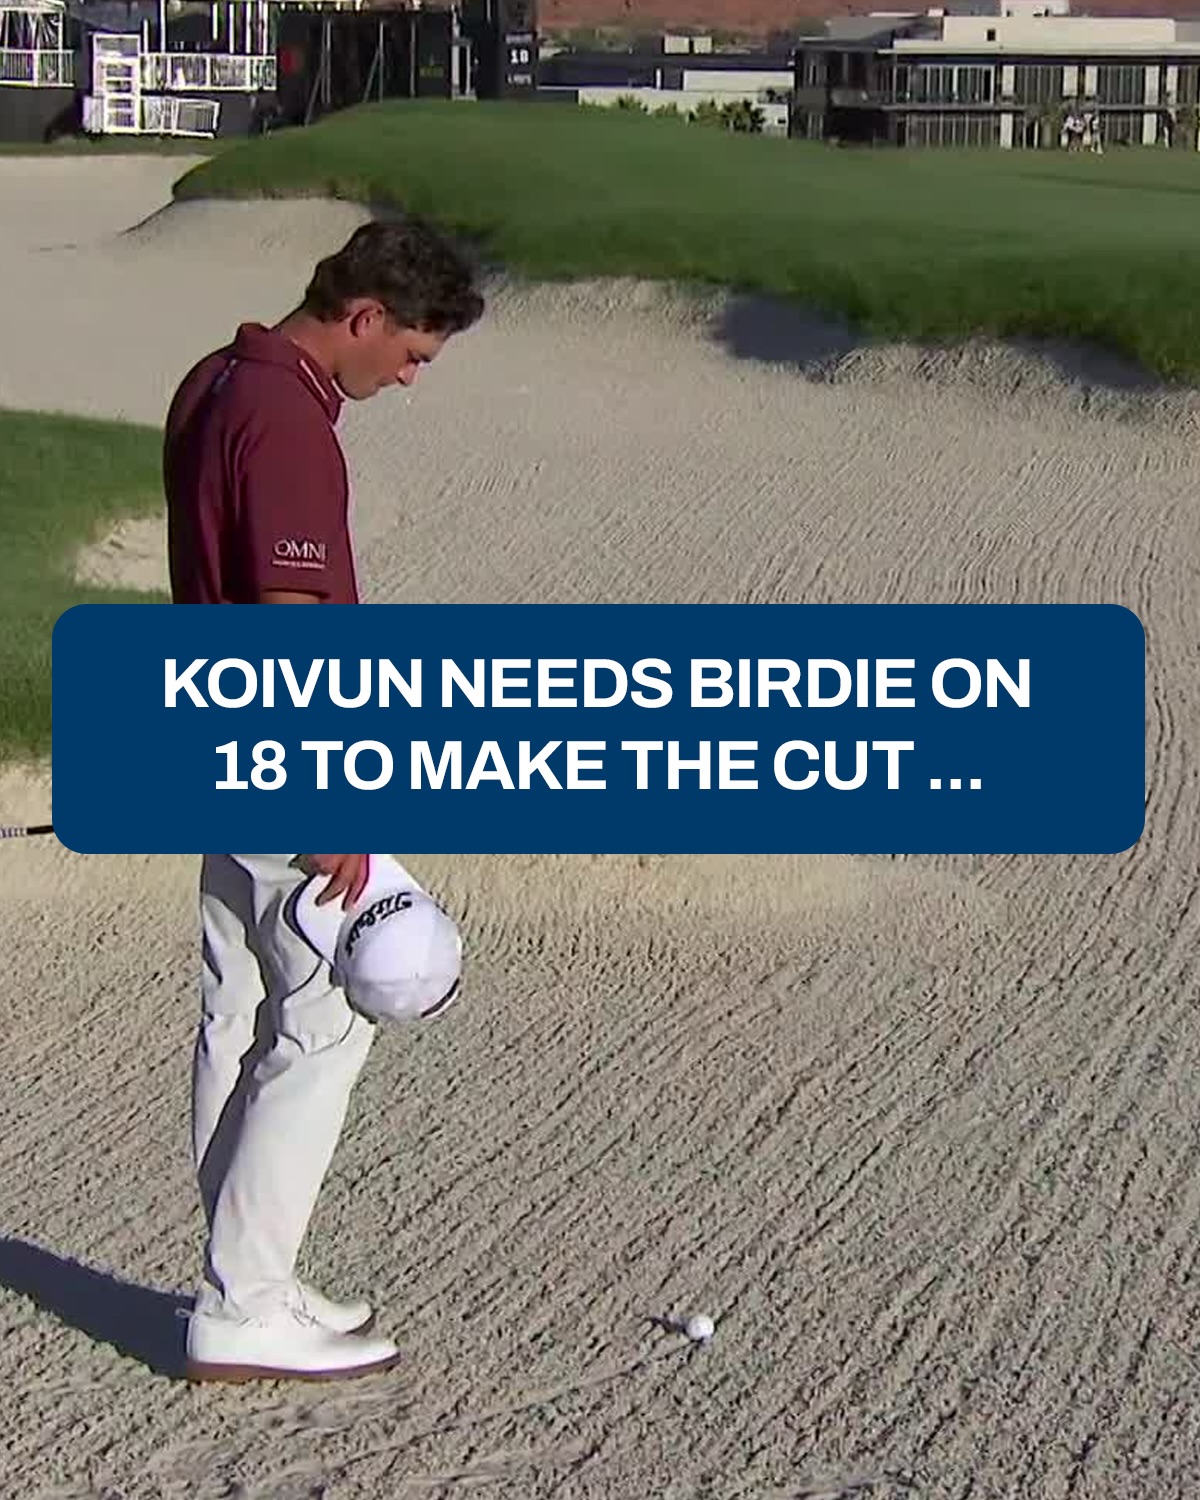 2.3M5.8×Golfer's clutch moment to make cut.@pgatour · Climactic Moment Highlight
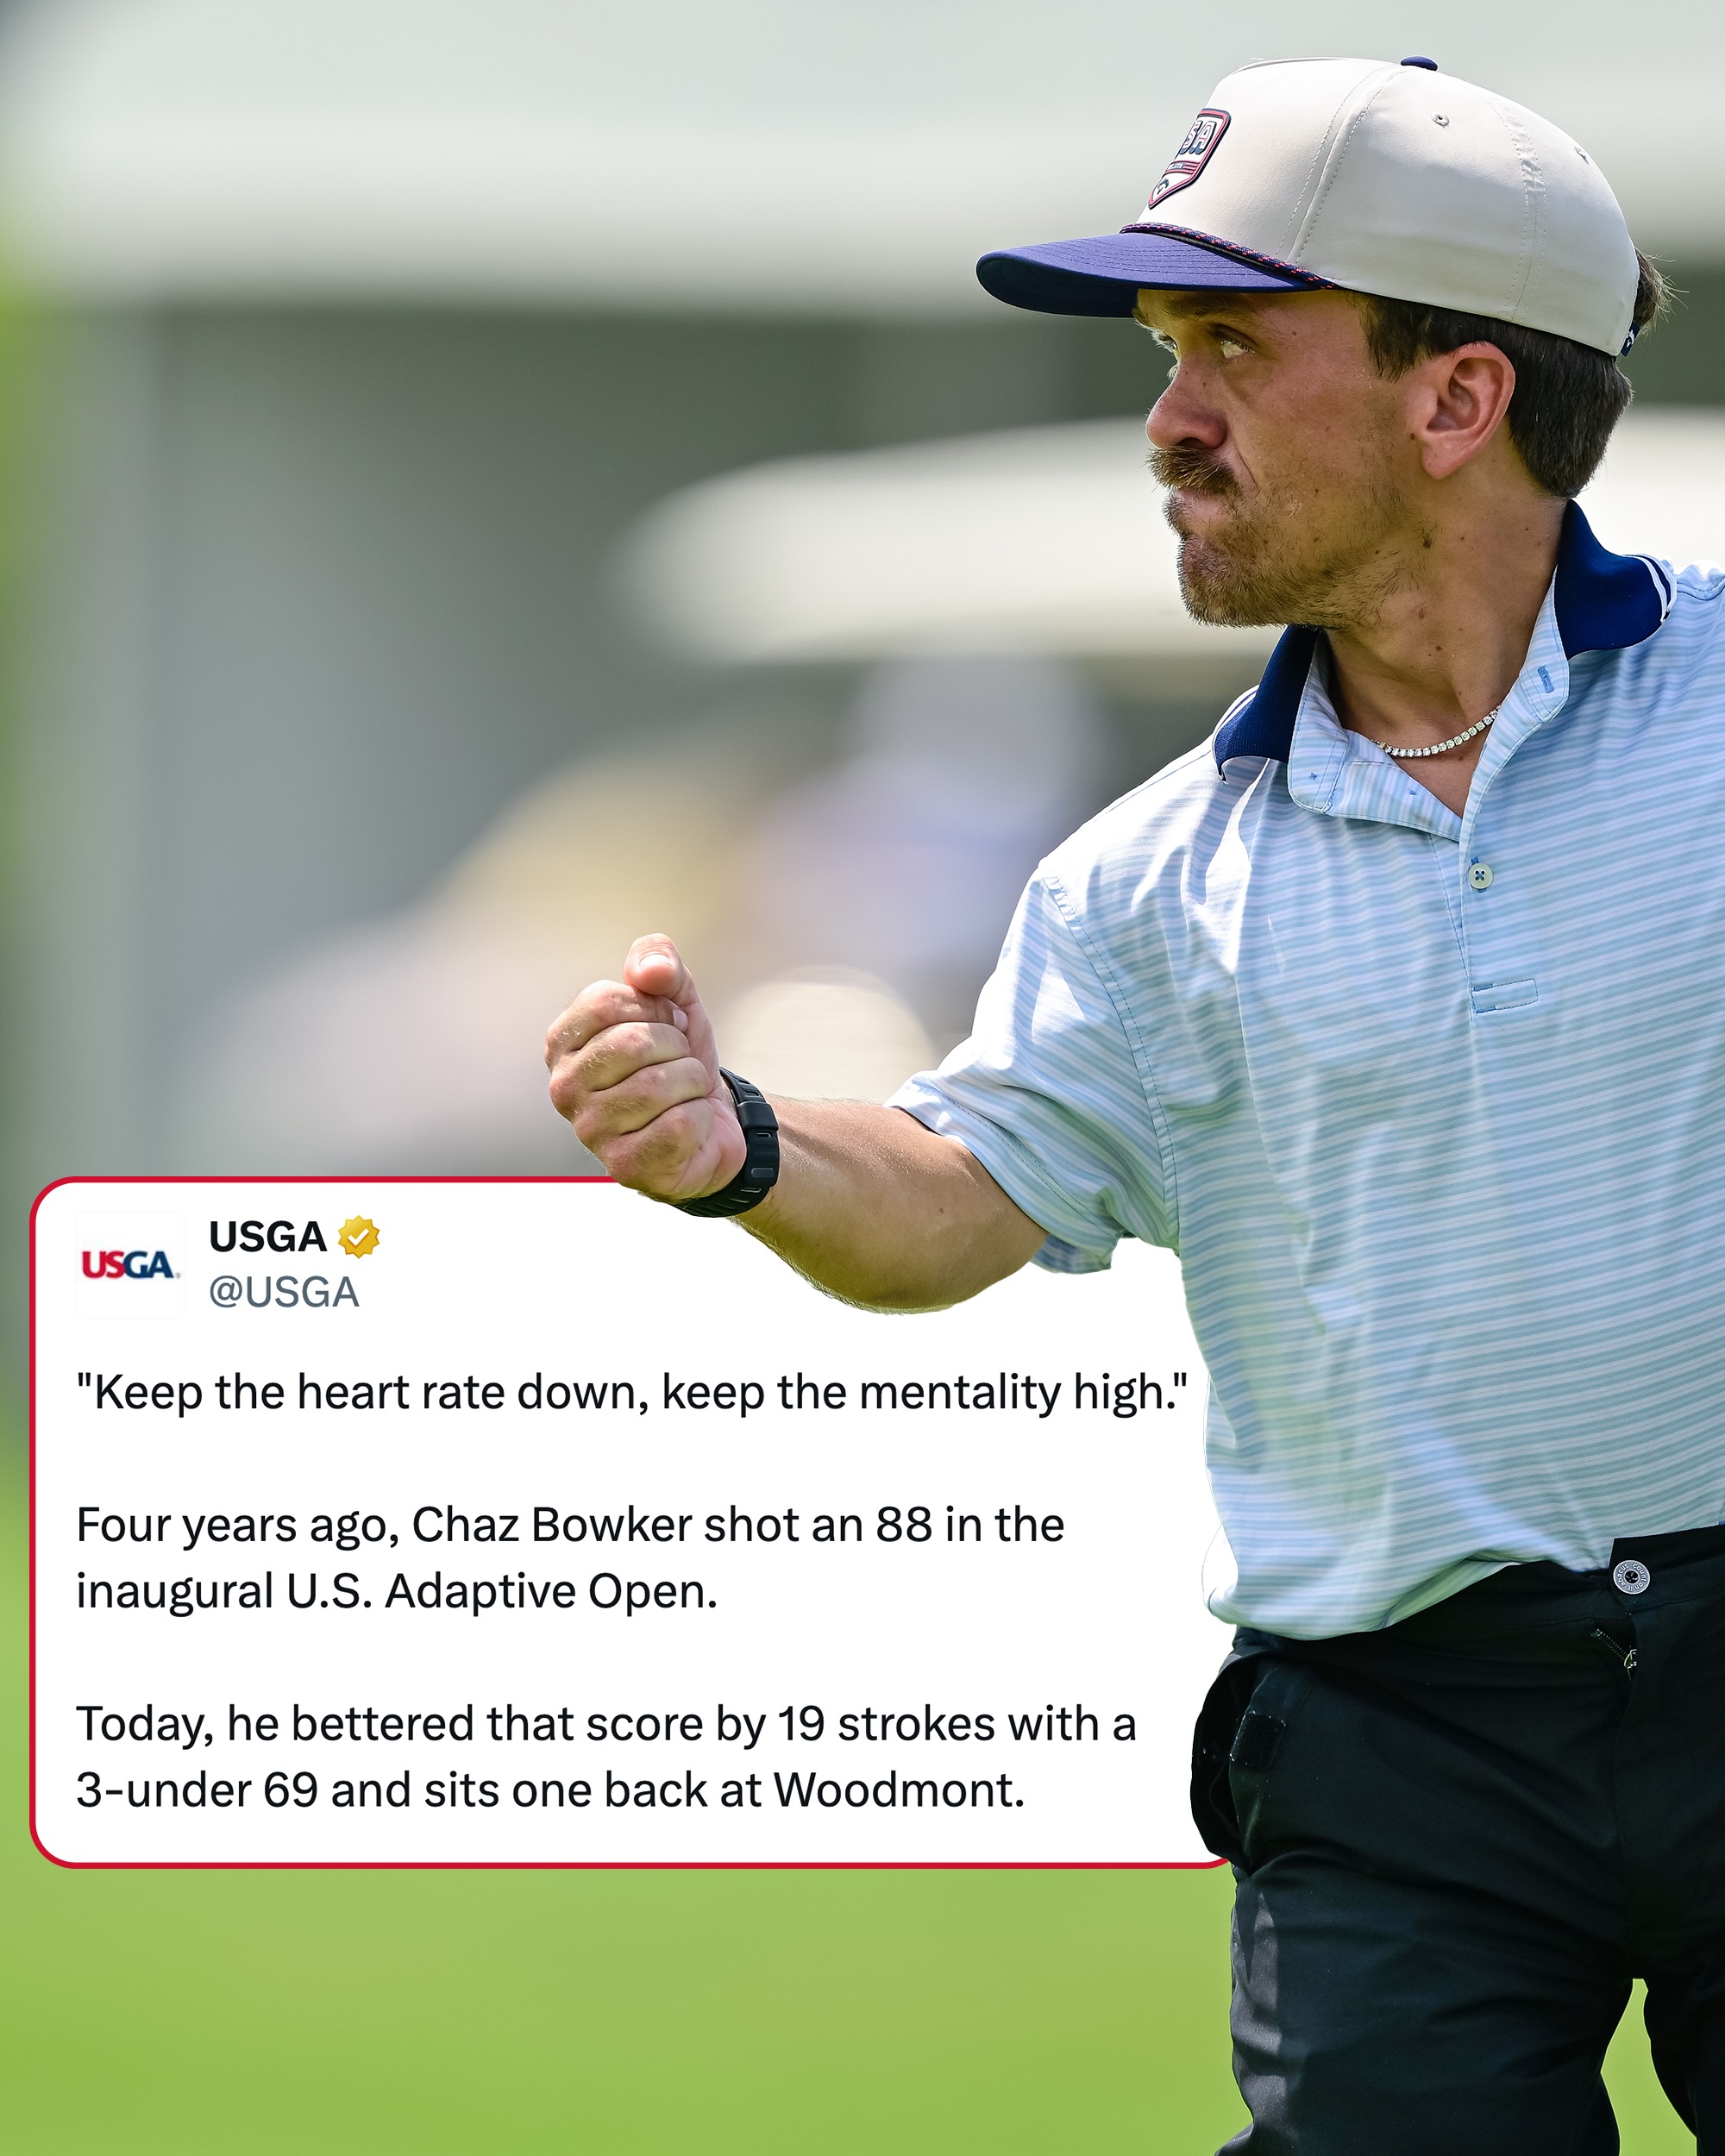 774.8K75.4×Inspirational golfer achievement story overlay@usga · Milestone Celebration
 274.5K2×Golfer's dramatic comeback victory montage.@chrisgotterup · Journey Documentation
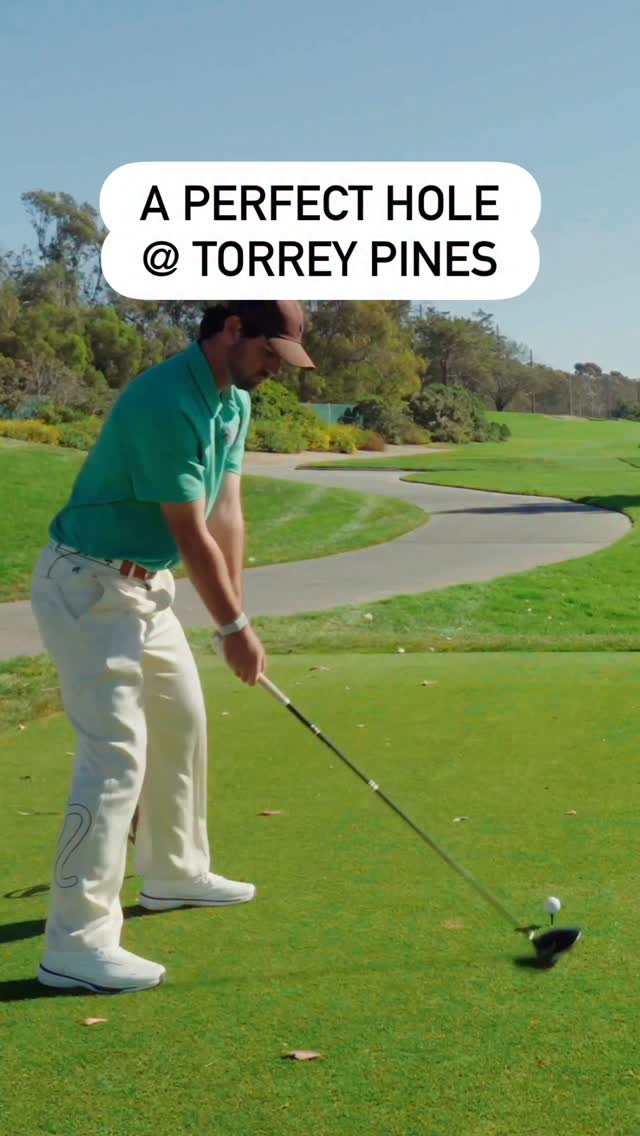 52.1KPerfect golf hole performance showcase@thelads_golf · Showcase
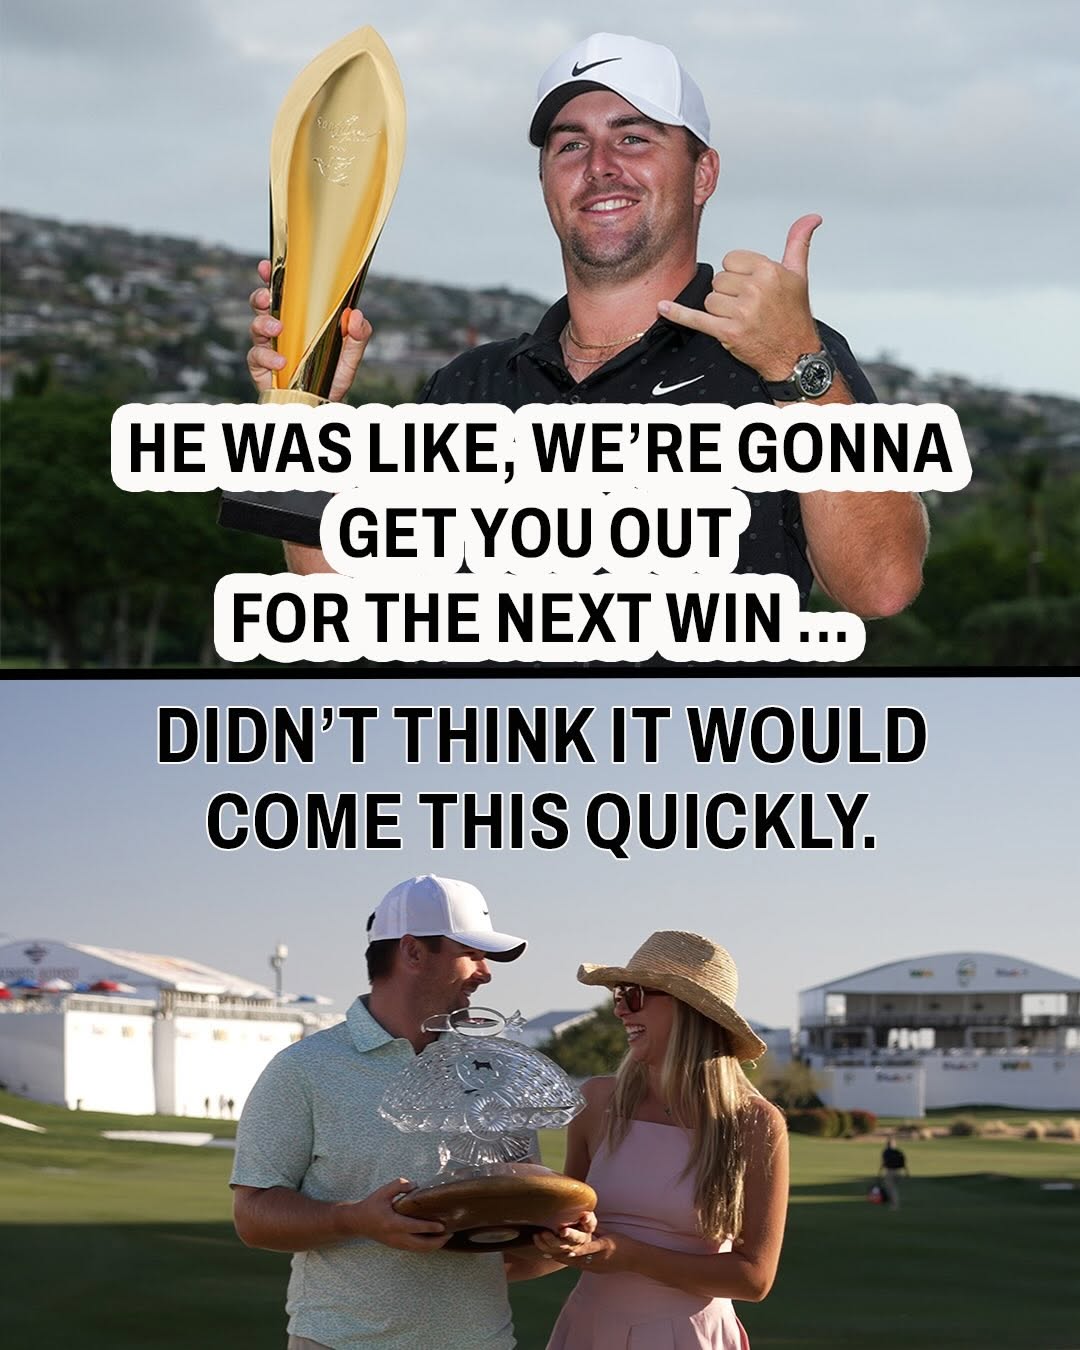 276.3K2×Golfer's promise fulfilled with quick win.@pgatour · Milestone Celebration
[04]
[05]
What stops the scroll in the first 3 seconds
Title hook · 55%
SIX-UNDER HIS FINAL SEVEN HOLES
Verbal hook · 30%
This is what greatness looks like.
Visual hook · 15%
A dynamic action shot of a professional golfer mid-swing is combined with a clean, data-rich graphic overlay, creating a strong contrast between human motion and statistical proof of performance.
[07]
The promise the opener makes, and how the video pays it back
Hook
A single, dynamic 'hero' image of the subject, paired with their name in a large, bold font to immediately establish the focus and capture attention.
Payoff
The payoff is delivered by the 'Narrative Summary' beat, creating an 'aha' moment where the viewer understands the full significance of the preceding data, all within a single glance.
[08]
The structural pattern this video runs on
Framework
The Data Punchline
Compresses a narrative into a single slide by presenting a sequence of raw data points as evidence, followed immediately by a powerful summary statement that interprets the data's significance, creating a self-contained story of achievement.
The Evidence Bar
A dedicated visual zone that displays a clean, linear sequence of raw data points (e.g., scores, stats, steps). This acts as the factual 'proof' for the narrative.
The Narrative Summary
A concise, high-impact text overlay that translates the raw data from the 'Evidence Bar' into a powerful, easily understood achievement or conclusion. It provides the 'so what?' for the data.
This is what greatness looks like. @ChrisGotterup with a rally for the ages @WMPhoenixOpen!
branding · photo_0
PGA TOUR
contextual · photo_0
CHRIS GOTTERUP
informational · photo_0
4 13 | 3 14 | 4 15 | 3 16 | 3 17 | 3 18 | 3 PL
contextual · photo_0
WM PHOENIX OPEN
title · photo_0
SIX-UNDER HIS FINAL SEVEN HOLES