Viral Hooks
Trending short videosInfographic of people on moon
G

@gatesfoundation

Instagram · Carousel
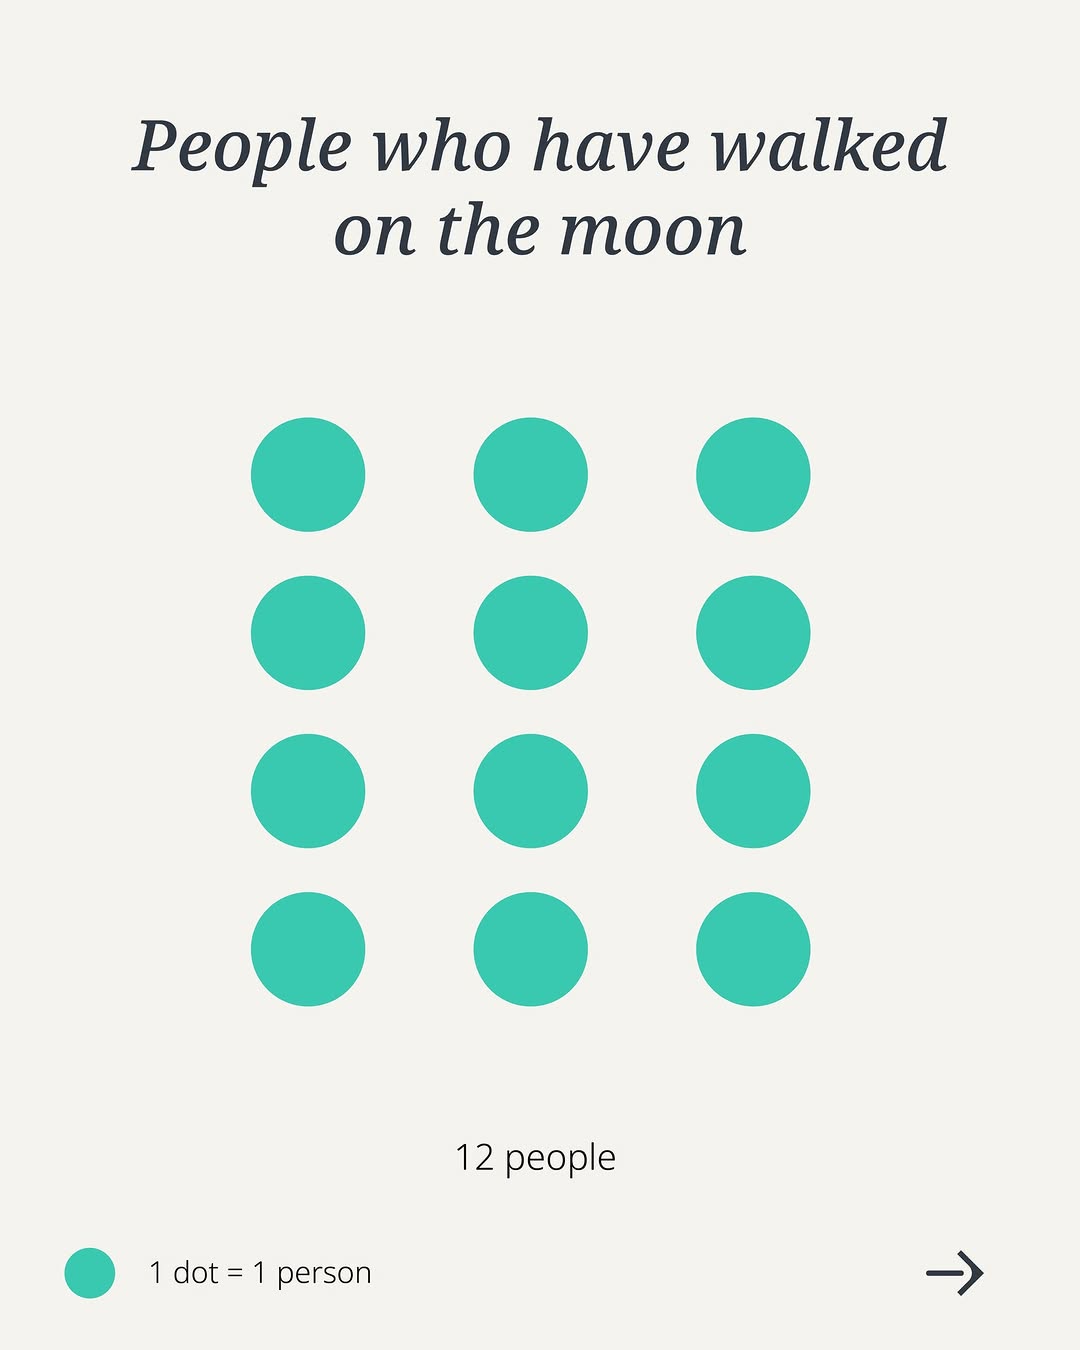
@gatesfoundation Some numbers are hard to imagine—until you see them. Vaccines are one of the best tools we have to save lives and protect people from preventable disease. Swipe to see the scale of their impact. 👉 #VaccinesWork #WorldImmunizationWeek

View original on Instagram

The edit1 shot · 3 text
Shots Text

Performance

Views
530K
Likes
35.3K
Comments
390
Engagement
6.7%
Outlier
38.5×

Video #29453 · Carousel

Infographic of people on moonfrom @gatesfoundation

[01]

Overview

A minimalist infographic designed as the first slide of a carousel post. It visually represents the 12 people who have walked on the moon using 12 teal dots, aiming to make the number more tangible and understandable for the viewer.

[02]

Simple outline

  1. 1Establish a relatable benchmark.
  2. 2Visualize the small number.
  3. 3Promise a dramatic comparison.

[03]

Related videos

[04]

Classification

Format
Concepts
Editorial CarouselStrange but TrueStatement Carousel
Elements
Data Visualization GraphicMinimalist LayoutText Overlay

[05]

Hook analysis

What stops the scroll in the first 3 seconds

Title hook · 35%

People who have walked on the moon

Verbal hook · 25%

Some numbers are hard to imagine—until you see them.

Visual hook · 40%

A clean, minimalist infographic using a simple grid of 12 teal dots on a neutral background. The organized pattern and use of negative space create a visually appealing and easily digestible representation of data, sparking curiosity.

[06]

Hook template

Steal this for your own video

A clean grid of [small number] [simple visual unit] on a [neutral background] — each one represents [hard-to-grasp statistic or fact].

  • — A clean grid of 12 teal dots on a white background — each one represents a person who has walked on the moon.
  • — A clean grid of 8 red silhouettes on a gray background — each one represents a U.S. president who owned slaves.
  • — A clean grid of 21 small icons on a cream background — each one represents a entire language that goes extinct every year.

[07]

Hook and payoff

The promise the opener makes, and how the video pays it back

Hook

The opening slide serves as a 'Tangible Benchmark.' It presents a small, easily understood quantity with a clear visual representation to ground the audience before a larger, more complex idea is introduced on subsequent slides.

Payoff

The payoff is promised on the subsequent slides, where a dramatic contrast in scale will be revealed. The call-to-action in the caption ('Swipe to see...') and the arrow icon explicitly direct the user toward this payoff.

[08]

Narrative framework

The structural pattern this video runs on

Framework

The Scale Comparison

To make a large, abstract number feel tangible and impactful by first establishing a small, familiar, and visually represented number as a benchmark for comparison.

  1. 1

    The Tangible Benchmark

    Presents a familiar, small-scale data point using a simple title ('People who have walked on the moon'), a grid of visual units (12 dots), and a clear legend ('1 dot = 1 person'). This creates a concrete reference point that the audience can easily grasp, setting the stage for a dramatic comparison.

Themes

  • Data Visualization
  • Education
  • History
  • Science Communication

Techniques

  • Minimalism
  • Graphic Design
  • Infographic

Trends

  • Micro-learning
  • Informational Carousels

Post caption

Some numbers are hard to imagine—until you see them. Vaccines are one of the best tools we have to save lives and protect people from preventable disease. Swipe to see the scale of their impact. 👉 #VaccinesWork #WorldImmunizationWeek
Text overlays

  • title · photo_0

    People who have walked on the moon

  • informational · photo_0

    12 people

  • contextual · photo_0

    1 dot = 1 person

Infographic of people on moon | Viral Hooks