@womp_tomp
Instagram · Split screen
@womp_tomp well well well well well well well #politics

@womp_tomp
Instagram · Split screen
@womp_tomp well well well well well well well #politics
Performance
Video #30615 · Split screen
[01]
The creator responds to another creator's video about sexual assault statistics. He reframes the presented data using a per capita analysis to argue that while the raw number of white perpetrators is higher, the rate is disproportionately higher among Black people. He then defends a previous video he made by showing screenshots of his data sources to counter accusations of using AI and dismisses semantic arguments about his word choice.
[02]
[03]
 175.9K2.1×Debunking a political narrative@womp_tomp · Cultural Rant
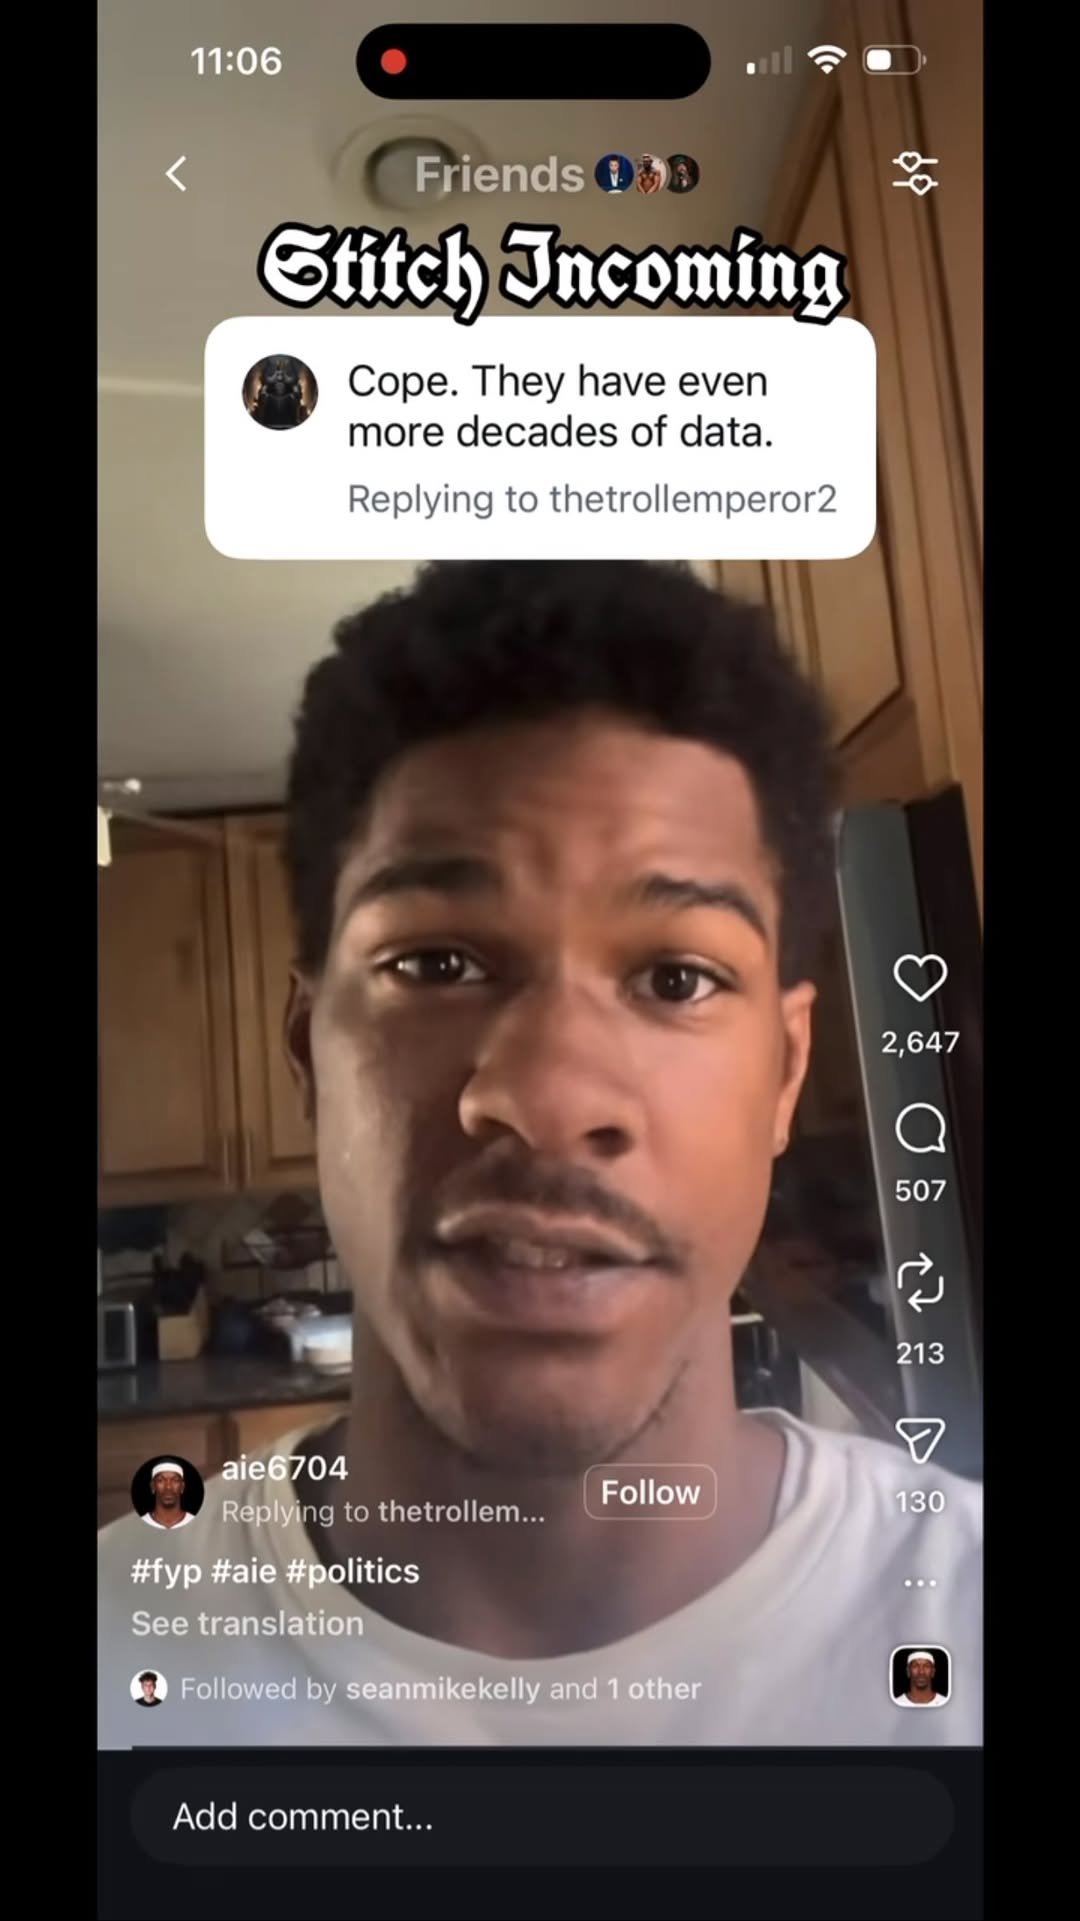 237.1K7.1×Creator refutes claim with historical argument@womp_tomp · Hot Take
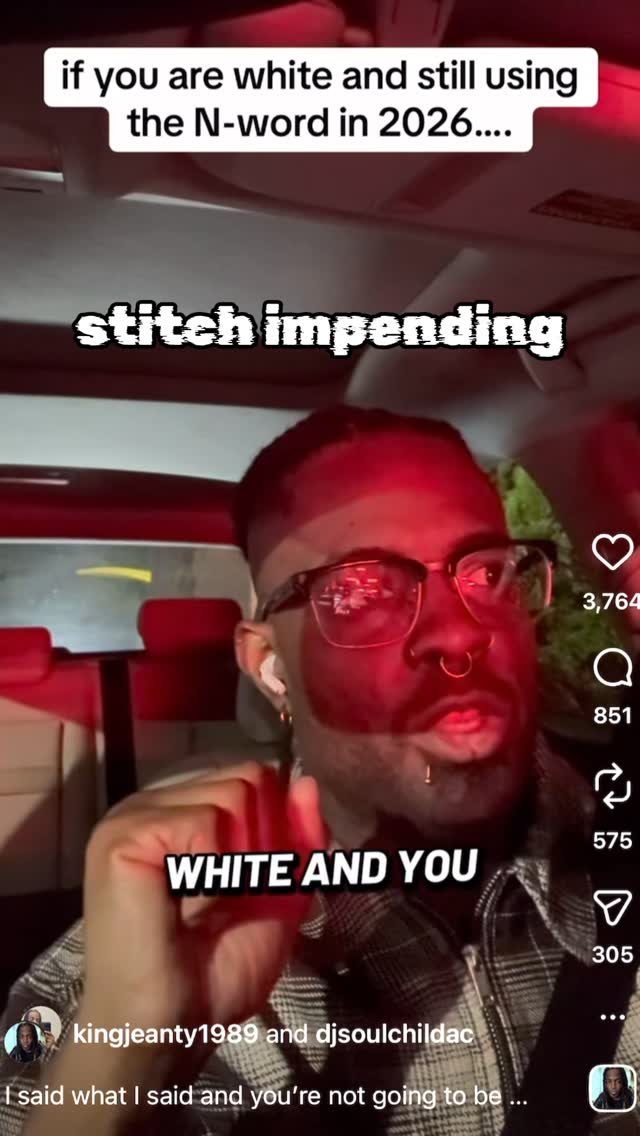 1.2M66.7×Video response with personal attack@womp_tomp · Hot Take
 1.1M13.7×Split-screen political commentary rant@womp_tomp · Hot Take
 746.1K22.8×Comparing racial supremacist talking points@womp_tomp · Cultural Rant
 228.2K4.1×Creator satirizes argument with analogies@womp_tomp · Reaction
 188.9K5.4×Commentator breaks down controversial news story@womp_tomp · Breakdown
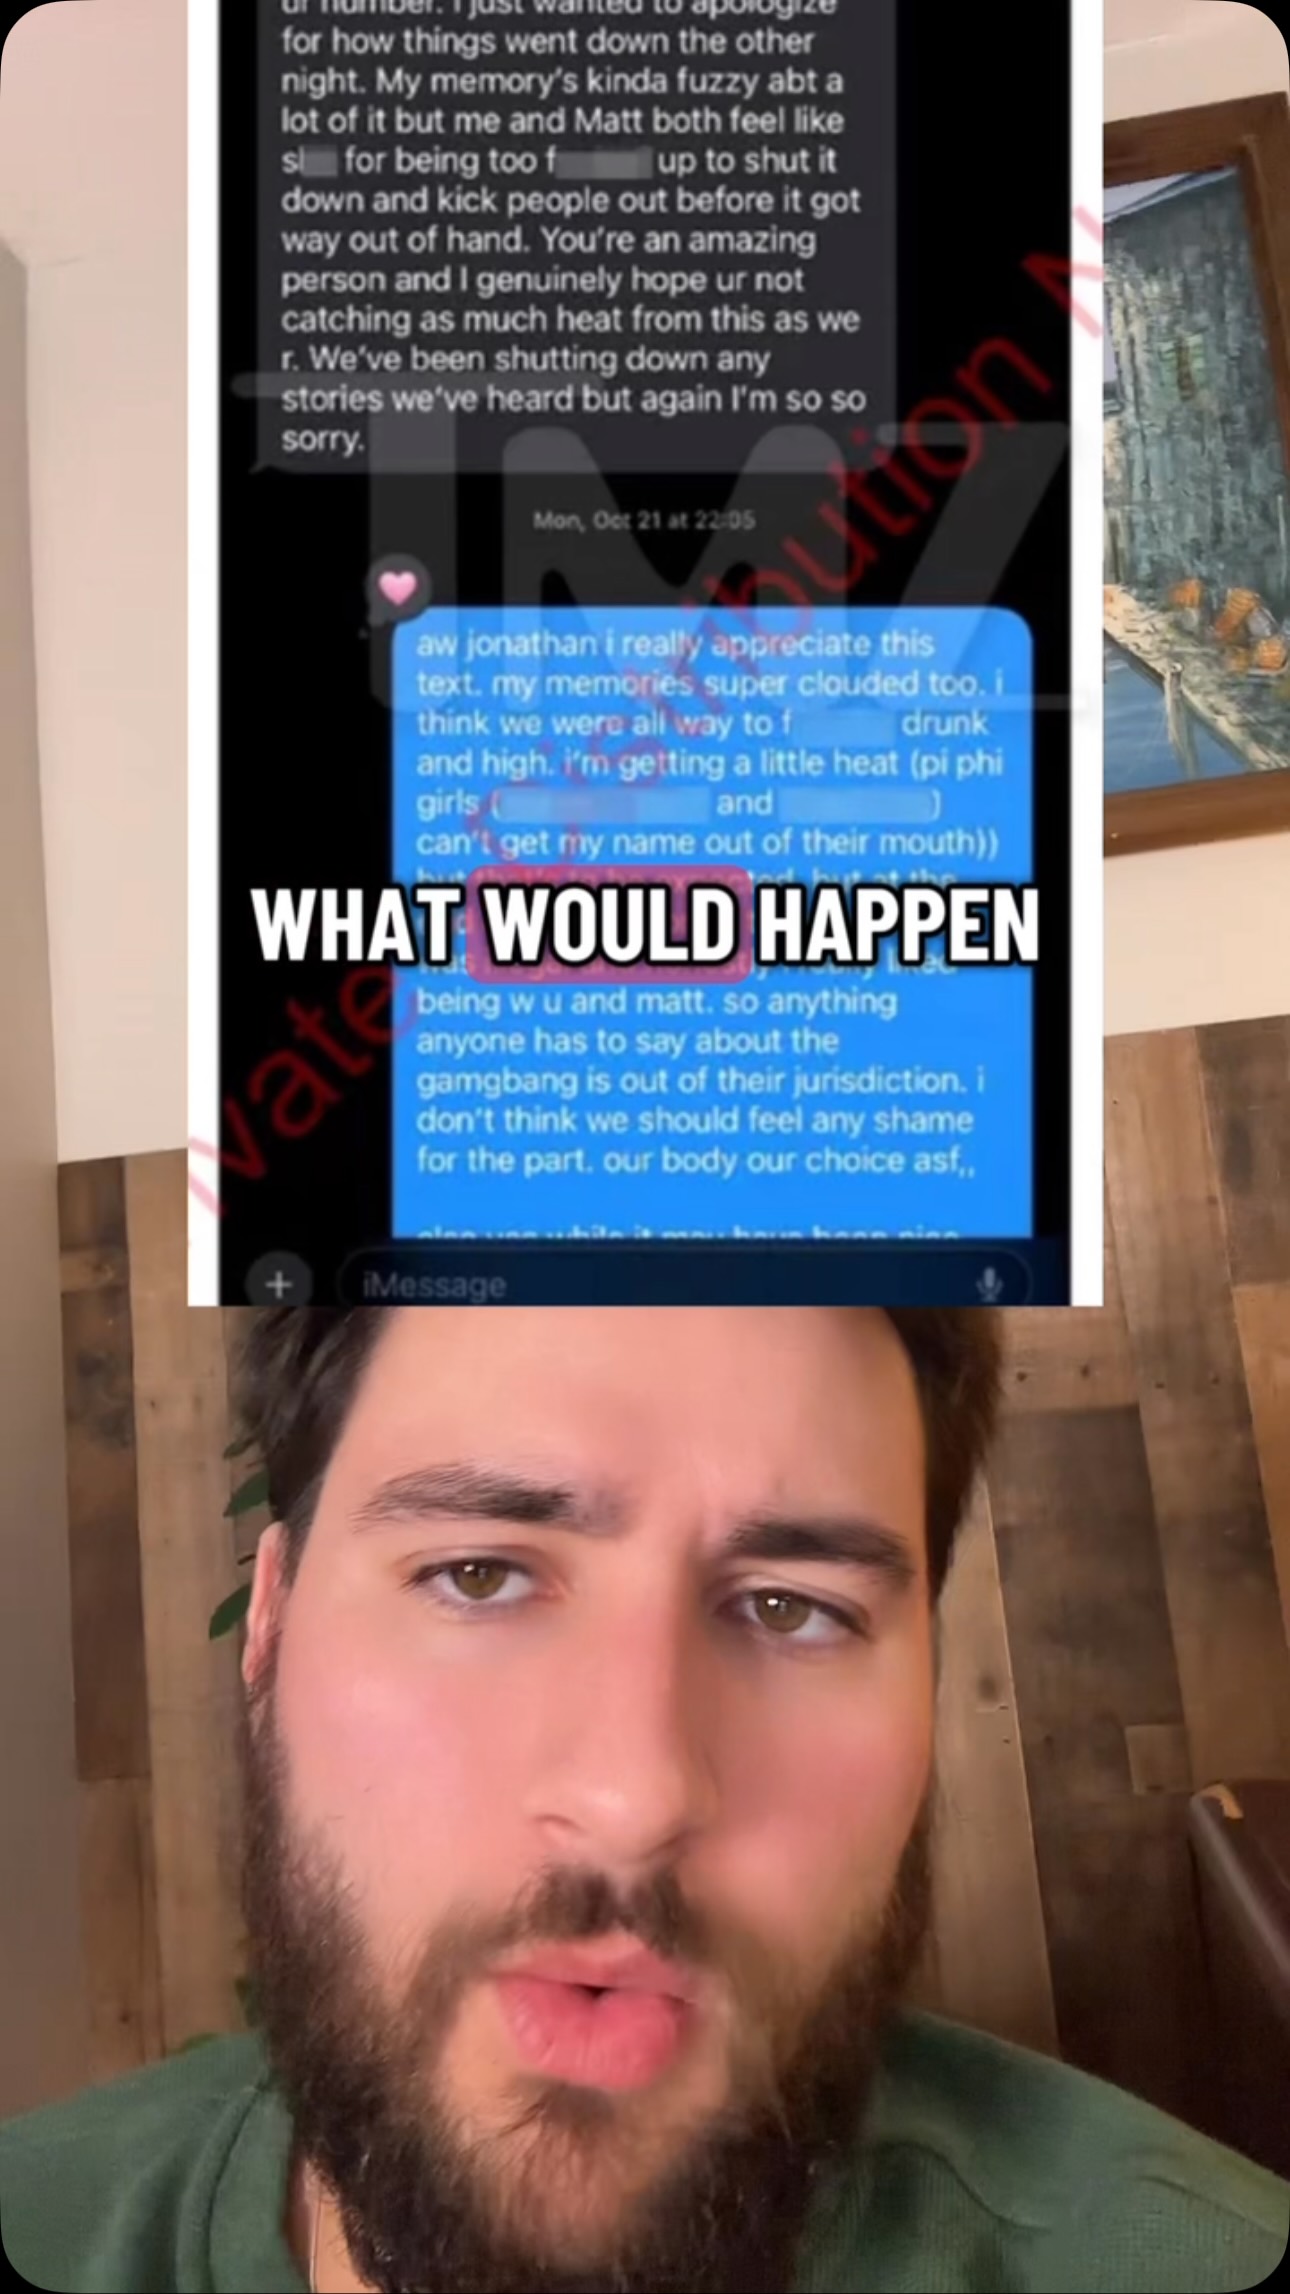 187.5K2×Reacting to controversy with hot take@womp_tomp · Hot Take
 2.6M1.1×Creator sets boundaries with audience@higherupwellness · Hot Take
 303.6K76.6×Man offers reward for robbery@chuckmcdowell · Public Service Announcement
 1.6M53×Commentary on online doxxing incident@womp_tomp · Hot Take
 546.4K120.6×News commentary on political hypocrisy.@thecanaryuk · Headlines
[04]
[05]
What stops the scroll in the first 3 seconds
Title hook · 45%
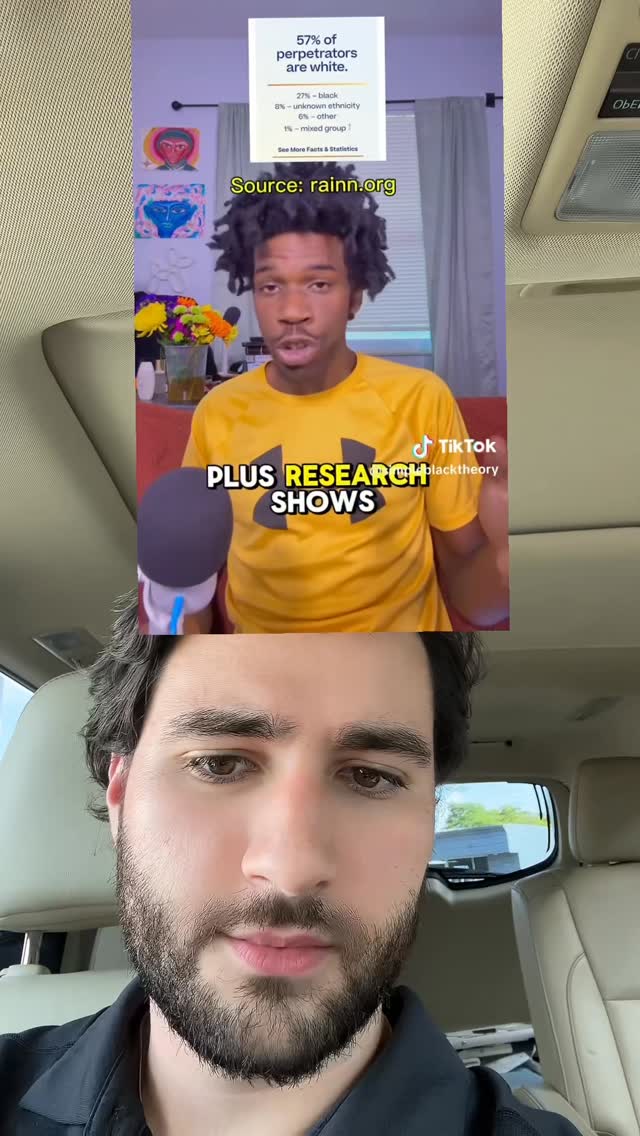
PLUS RESEARCH SHOWS
Verbal hook · 50%
Plus research shows that the main perpetrators of SA are white people.
Visual hook · 5%
A split-screen format showing a creator on top pointing up at a statistical graphic, while another creator on the bottom looks on, creating immediate visual tension and indicating a response or debate.
[06]
Steal this for your own video
That statistic sounds damning until you look at it .
[07]
The promise the opener makes, and how the video pays it back
Hook
The video opens by showcasing a clip of another creator making a controversial or statistically questionable claim, immediately establishing a point of conflict and a thesis to be debunked.
Payoff
The video culminates in a final, impactful statement that uses the opponent's 'corrected' terminology to deliver the core counter-argument with maximum force, often ending abruptly on a cliffhanger to create a 'mic drop' effect.
[08]
The structural pattern this video runs on
Framework
The Evidentiary Reversal
To deconstruct an opponent's argument by re-contextualizing their own evidence with a deeper layer of analysis, thereby proving the opposite of their initial conclusion and dismissing secondary criticisms.
The Provocation
The original creator's argument and supporting evidence are presented, setting the stage for the rebuttal. This establishes the initial premise that the rest of the video will dismantle.
The Counter-Premise
The responder immediately signals disagreement and introduces the idea that the original claim is based on a flawed or incomplete interpretation of the presented evidence.
The Statistical Reframing
A new analytical lens (in this case, per capita rates vs. raw numbers) is introduced to re-contextualize the original data, revealing a hidden or ignored truth.
The 'Per Capita' Hammer
The responder explicitly states the new, damning conclusion derived from the reframed data, directly contradicting the original creator's point and proving a significant discrepancy.
The Rhetorical Reversal
The original creator's own words are ironically turned against them to highlight the flaw in their argument, using their own logic to prove the responder's point.
The Meta-Defense
The responder pivots to address and swiftly dismiss other anticipated or previously received criticisms about their methodology or sources, reinforcing their credibility.
The Semantic Dismissal
A minor, semantic criticism is acknowledged and then dismissed as irrelevant, setting up the final point by conceding a trivial detail.
well well well well well well well #politics
title · beginning
PLUS RESEARCH SHOWS
informational · beginning
57% of perpetrators are white.
contextual · beginning
Source: rainn.org
title · beginning
PERPETRATORS OF SA ARE WHITE PEOPLE
informational · middle
100% OVER REPRESENTATION
contextual · middle
PER CAPITA,
informational · middle
IS ACTUALLY DOUBLY PRESENT IN YOUR GROUP.
informational · middle
Nationally, confirmed child maltreatment cases per 10,000 children... Black: 110 to 121... White: 67
Us research shows that the main perpetrators of SA are white people. But despite that, SA isn't a race problem. It's a people problem. I don't know, man. I feel like maybe we're not looking at the same data because so twenty seven percent of all SA cases. Right? But 13% of the population would actually be a 100% overrepresentation in those statistics. Even though white people is the bigger number per capita, that human issue that has nothing to do with race is actually doubly present in your group. So that's a really I'm just saying that's a bad example. The rest of the beef with the video was like, oh, you used AI when no. I didn't. The AI overview just explained exactly the data from the study that I also showed, so you're just lying. And then the other point was like, oh, you said abuse instead of maltreatment and neglect falls under maltreatment. Okay. I think neglect is abuse, but, like, what fine. You have that one, simple black theory. Black people abuse and neglect their children double the