@golfdigest
Instagram · Carousel
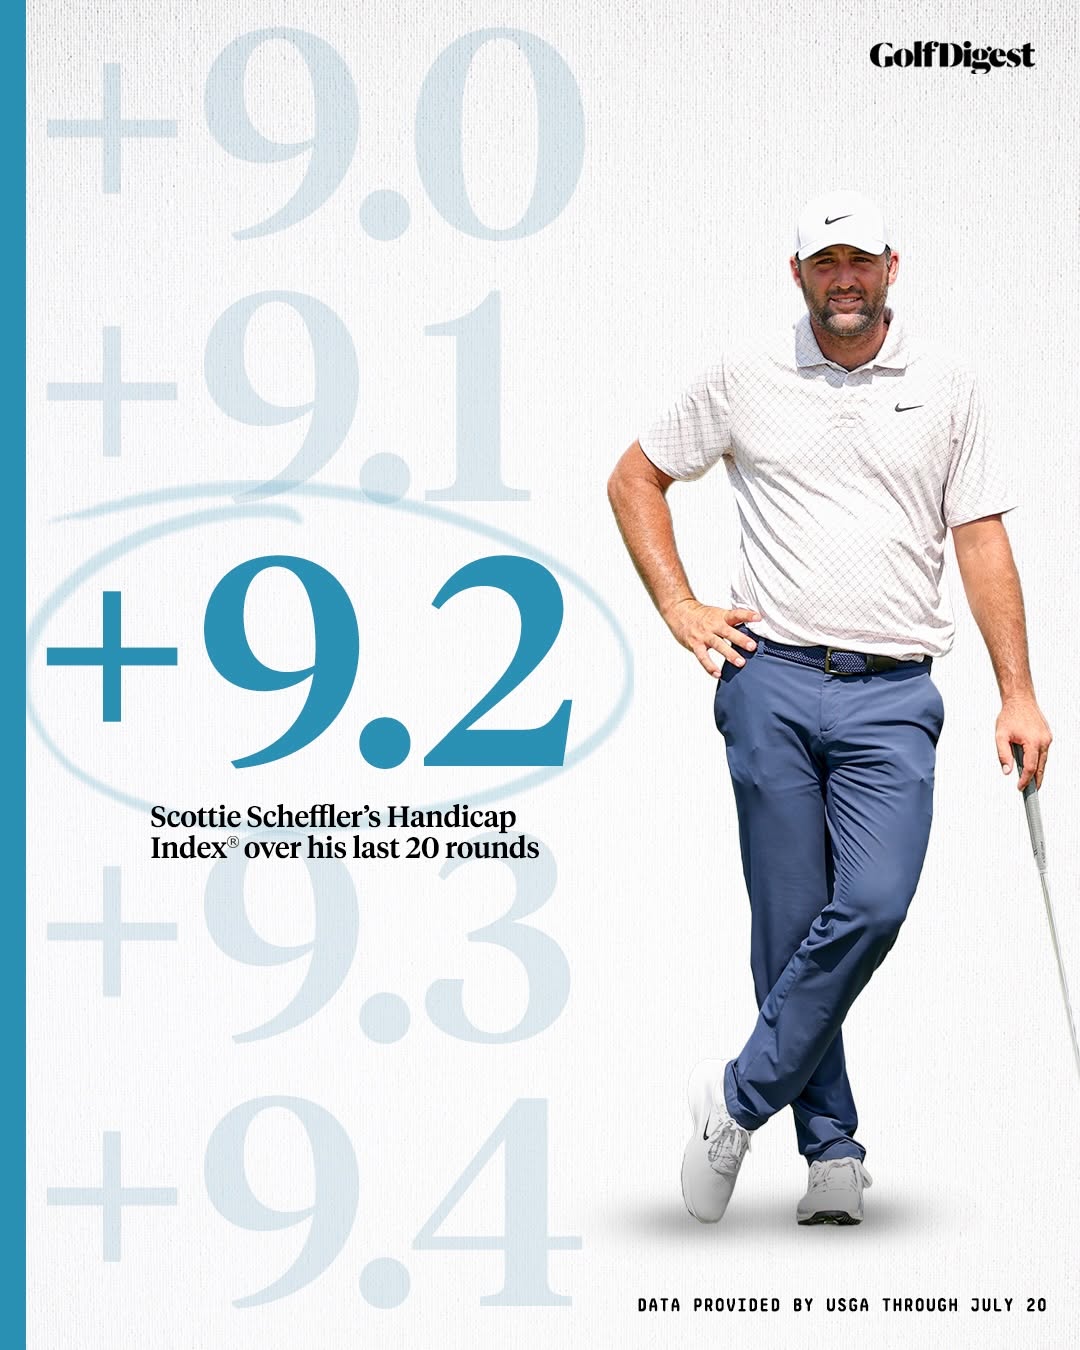
@golfdigest How good are the pros? 🤔 We asked @usga what some of the best players in the world would be playing off of right now.

@golfdigest
Instagram · Carousel
@golfdigest How good are the pros? 🤔 We asked @usga what some of the best players in the world would be playing off of right now.
Performance
Video #38093 · Carousel
[01]
An infographic from Golf Digest showing professional golfer Scottie Scheffler standing next to a visual representation of his recent handicap scores. The graphic highlights his current Handicap Index of +9.2, emphasizing his high level of skill.
[02]
[03]
 200.6K2.8×Analyzing golfer's surprising performance slump@shaneohgolfs · Headlines
 70.9KExplaining golf handicap system simply@shaneohgolfs · Explainer
 1.2M5.2×Golfer press conference interview clip@ziregolf
 214.9K7.7×Greenscreen commentary on golf drama@shaneohgolfs · Headlines
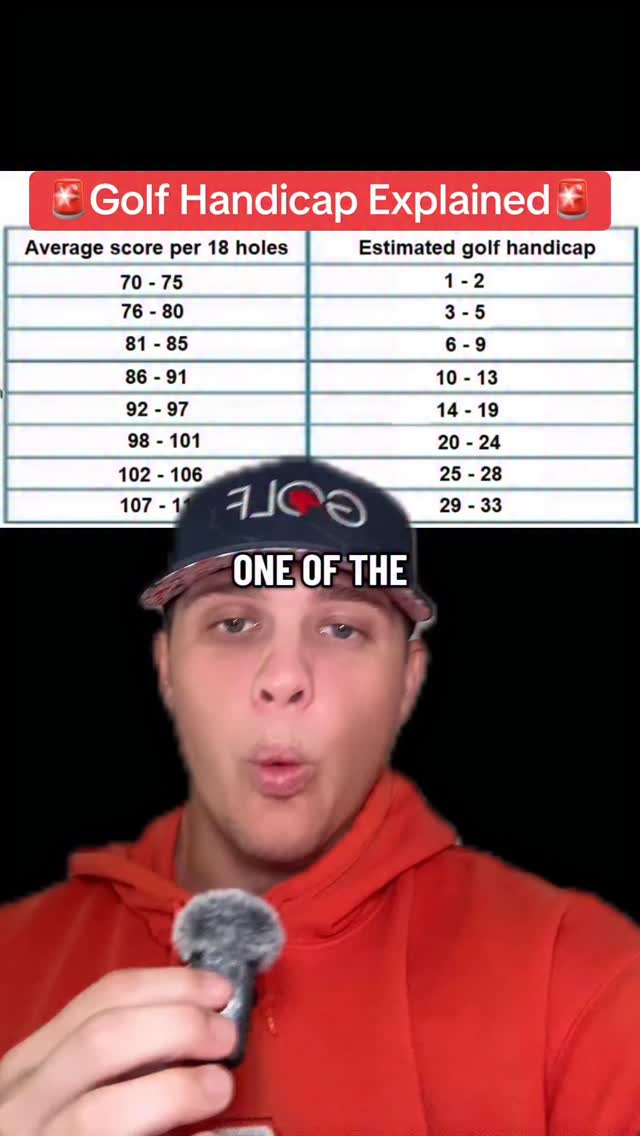 310.8K2.6×Explains golf handicap system using chart@shaneohgolfs · Breakdown
 363.2K2.6×Case study on pro golf difficulty@shaneohgolfs · Breakdown
 302.3K27.5×Two hosts discuss golf controversy@danongolfshow · Headlines
 174.3K5.8×Analyzing golfer's controversial press answers@shaneohgolfs · Reaction
 509.5K147.7×Explaining a controversial golf topic@golfdigest · Headlines
 142.5K1×Creator defines good golfer skill levels@shaneohgolfs · Explainer
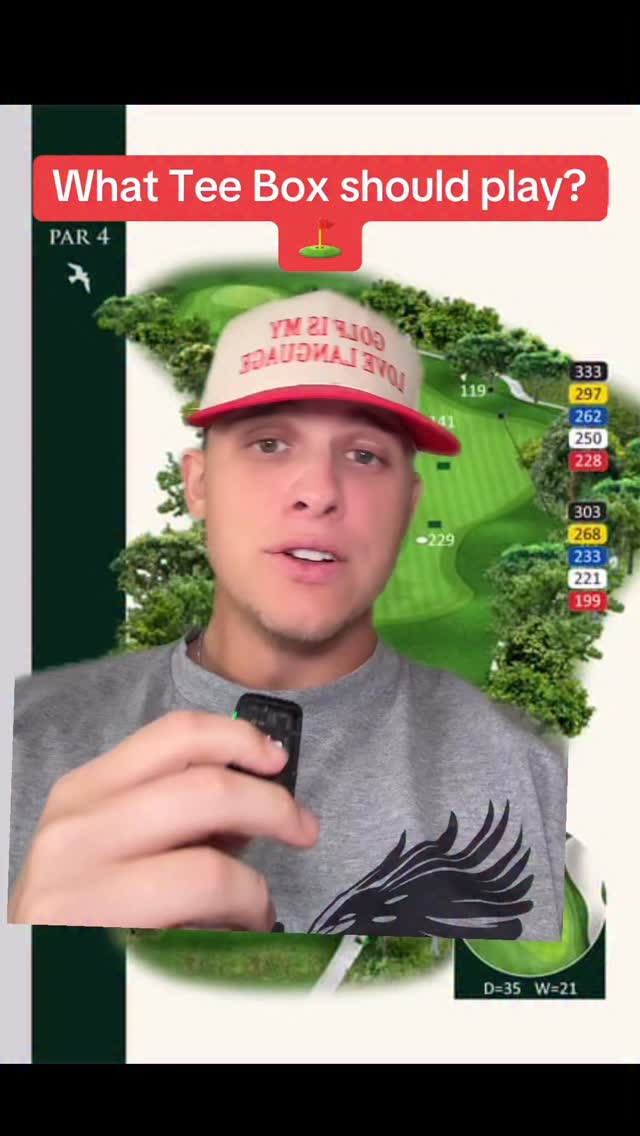 468.9K3.4×Explaining golf tee box choices@shaneohgolfs · Breakdown
 217.5K5×Golf ball recommendations by handicap@shaneohgolfs · Buying Guide
[04]
[05]
What stops the scroll in the first 3 seconds
Title hook · 55%
Scottie Scheffler's Handicap Index® over his last 20 rounds
Verbal hook · 25%
How good are the pros? 🤔
Visual hook · 20%
The large, bold, and highlighted number '+9.2' serves as a strong focal point, contrasted against a clean white background and a full-body photo of a professional athlete.
[06]
Steal this for your own video
's over their last
[07]
The promise the opener makes, and how the video pays it back
Hook
The hook is the visually dominant 'hero' data point, which immediately draws the eye and raises a question ('What is this number?'), compelling the viewer to seek context within the same image.
Payoff
The payoff is a single, cohesive visual that delivers a surprising data point, its full context, and its source, leaving the viewer with a clear, memorable, and shareable takeaway without needing to swipe.
[08]
The structural pattern this video runs on
Framework
The Data Spotlight Framework
Visually isolates a single 'hero' data point within a contextual range to create an immediate and powerful impression of significance, all within a single, dense visual.
The Contextual Range
A series of less prominent data points (e.g., faded, smaller) that establish a scale and provide immediate context for the main number, showing it exists within a progression.
The Hero Metric
The primary data point, made visually dominant through size, color, and graphic emphasis (e.g., a circle), serving as the narrative's focal point and climax.
The Core Explanation
A concise text block placed near the Hero Metric that defines what the data represents, connecting it to a specific subject, timeframe, or context.
The Human Anchor
A compelling photograph of the subject associated with the data, grounding the abstract numbers in a relatable, human context and adding visual appeal.
The Credibility Stamp
A small text element, typically at the bottom, that cites the data source and date, adding authority and trustworthiness to the information presented.
How good are the pros? 🤔 We asked @usga what some of the best players in the world would be playing off of right now.
branding · photo_0
GolfDigest
informational · photo_0
+9.0
informational · photo_0
+9.1
informational · photo_0
+9.2
contextual · photo_0
Scottie Scheffler's Handicap Index® over his last 20 rounds
informational · photo_0
+9.3
informational · photo_0
+9.4
contextual · photo_0
DATA PROVIDED BY USGA THROUGH JULY 20