@f1
Instagram · Carousel
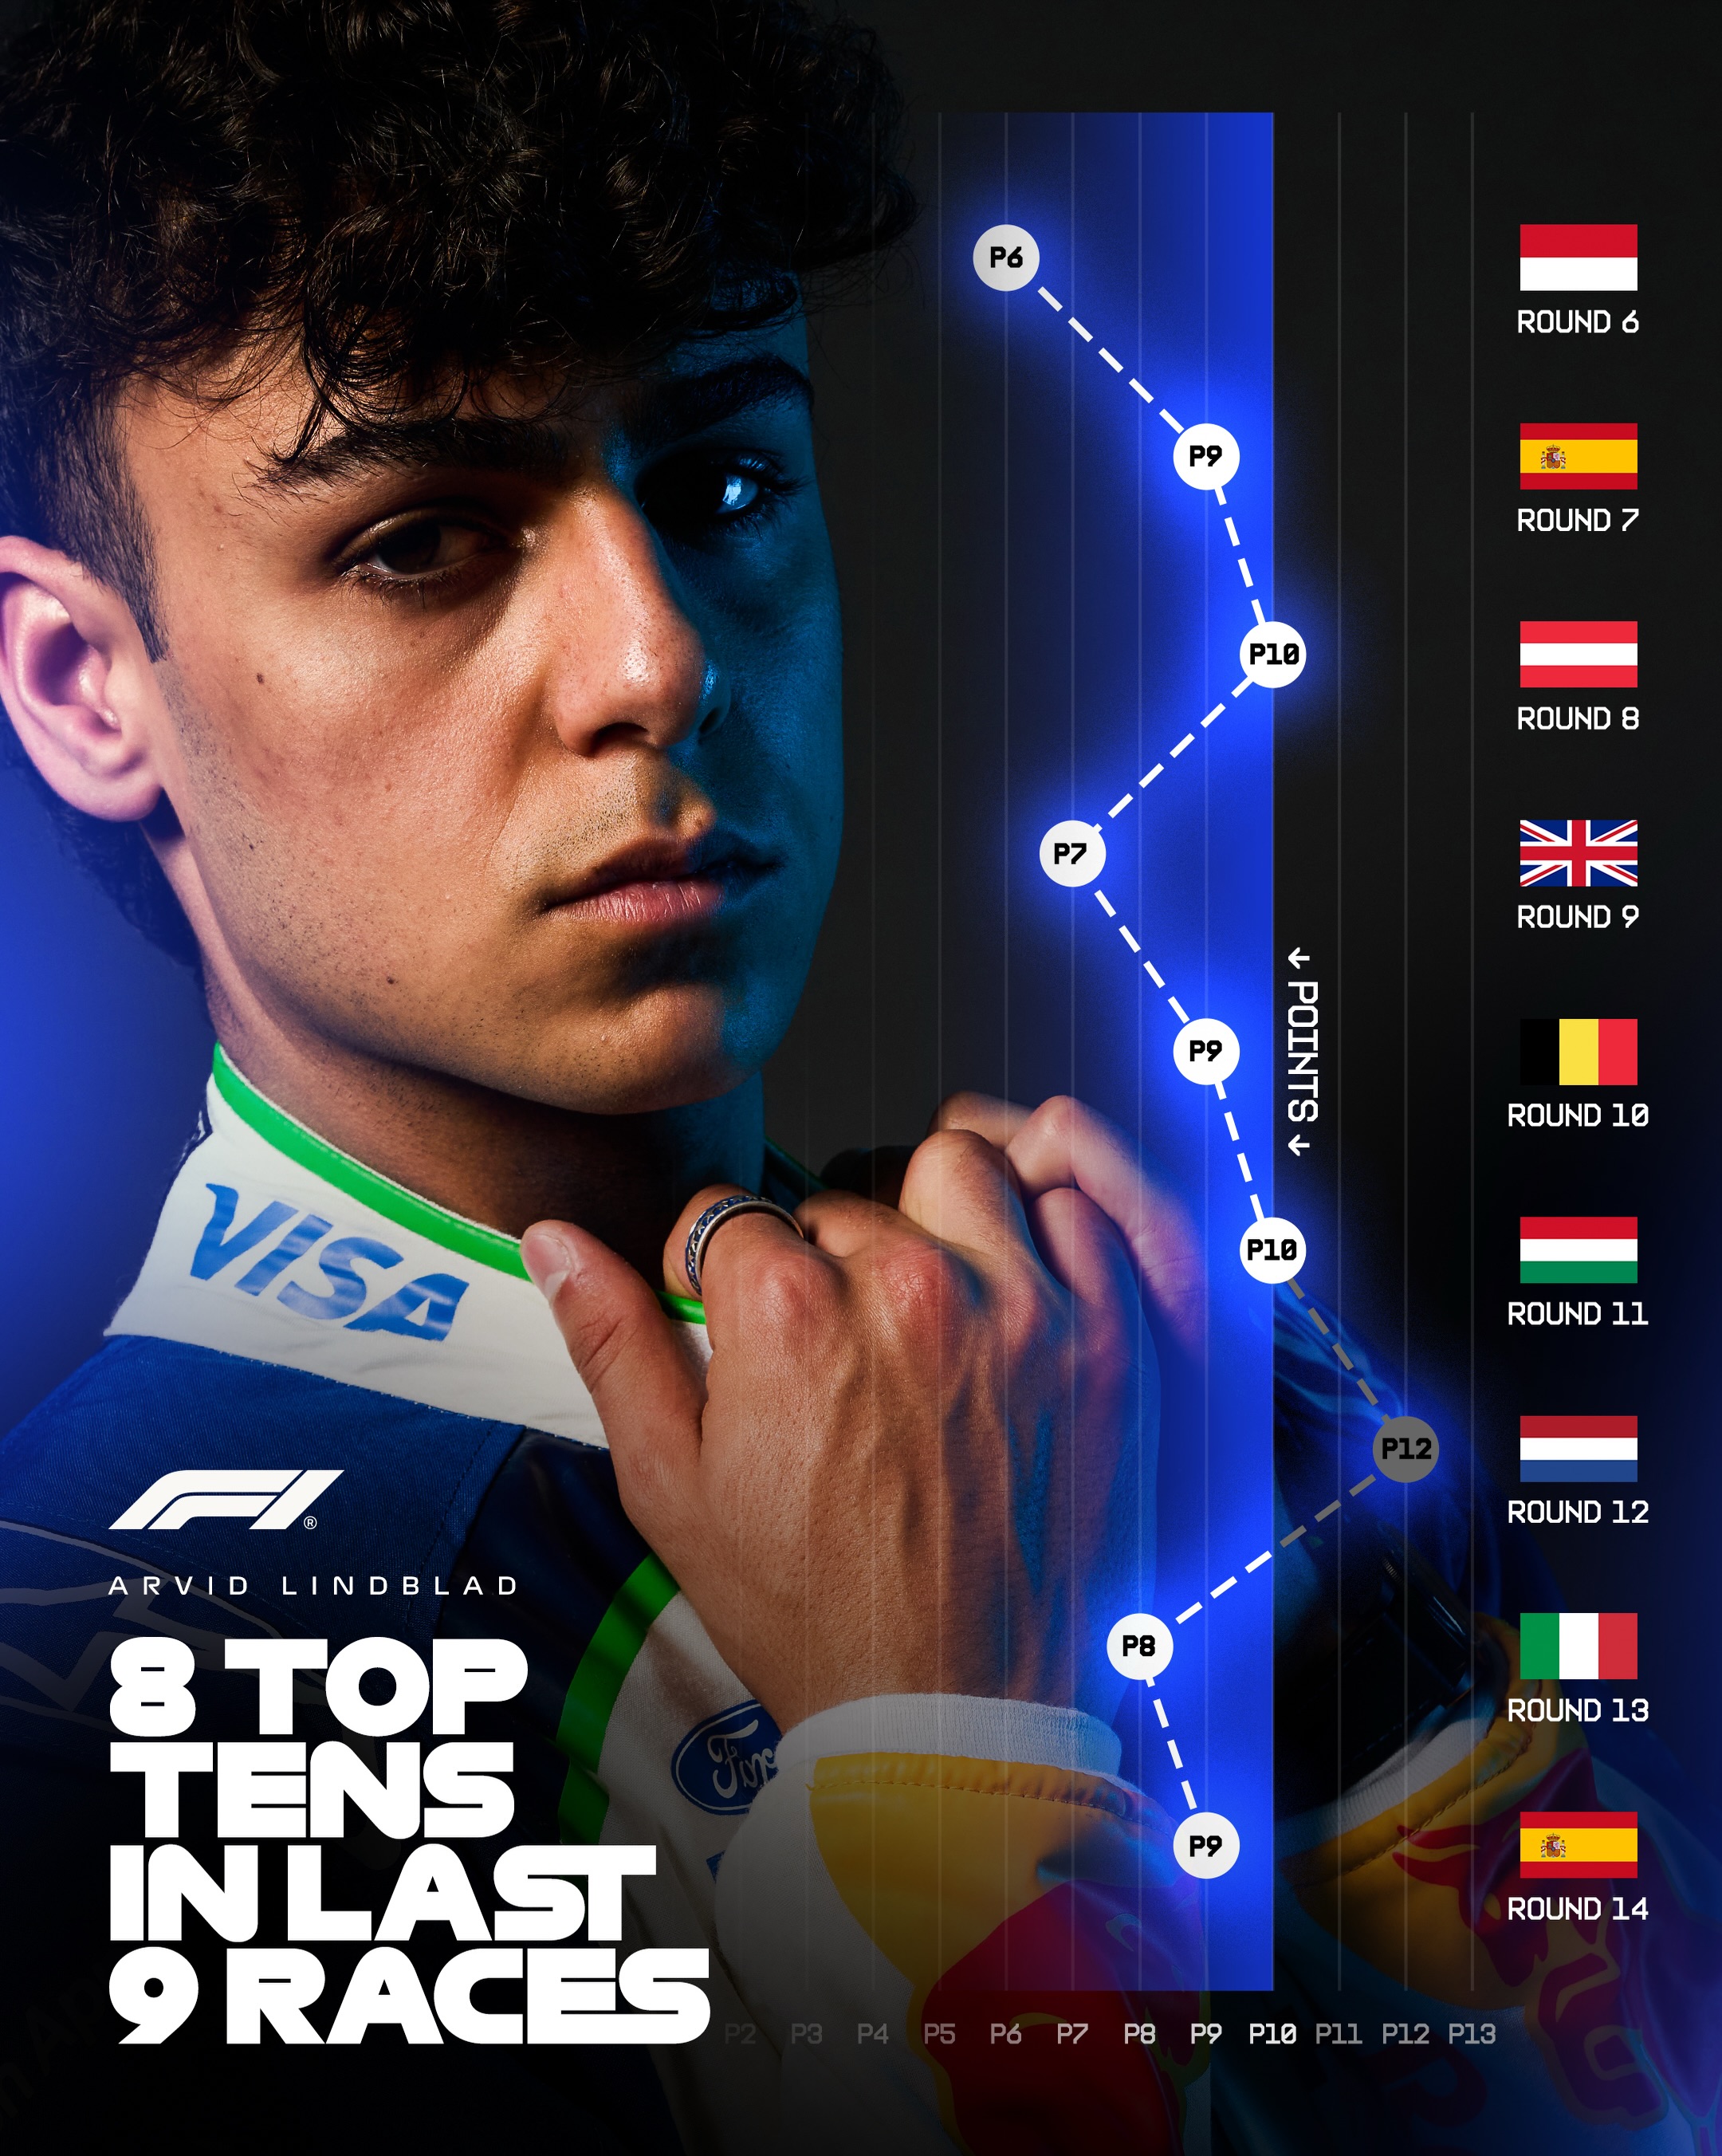
@f1 Lindblad’s levels 😤 The rookie has shown remarkable consistency, scoring in eight of the last nine Grands Prix 👏 #F1 #Formula1 @arvid.lindblad @visacashapprb

@f1
Instagram · Carousel
@f1 Lindblad’s levels 😤 The rookie has shown remarkable consistency, scoring in eight of the last nine Grands Prix 👏 #F1 #Formula1 @arvid.lindblad @visacashapprb
Performance
Video #42884 · Carousel
[01]
This is a promotional graphic for racing driver Arvid Lindblad. It features a stylized portrait of him alongside a data visualization chart that highlights his achievement of securing 8 top-ten finishes in his last 9 races, showcasing his consistency and skill.
[02]
[03]
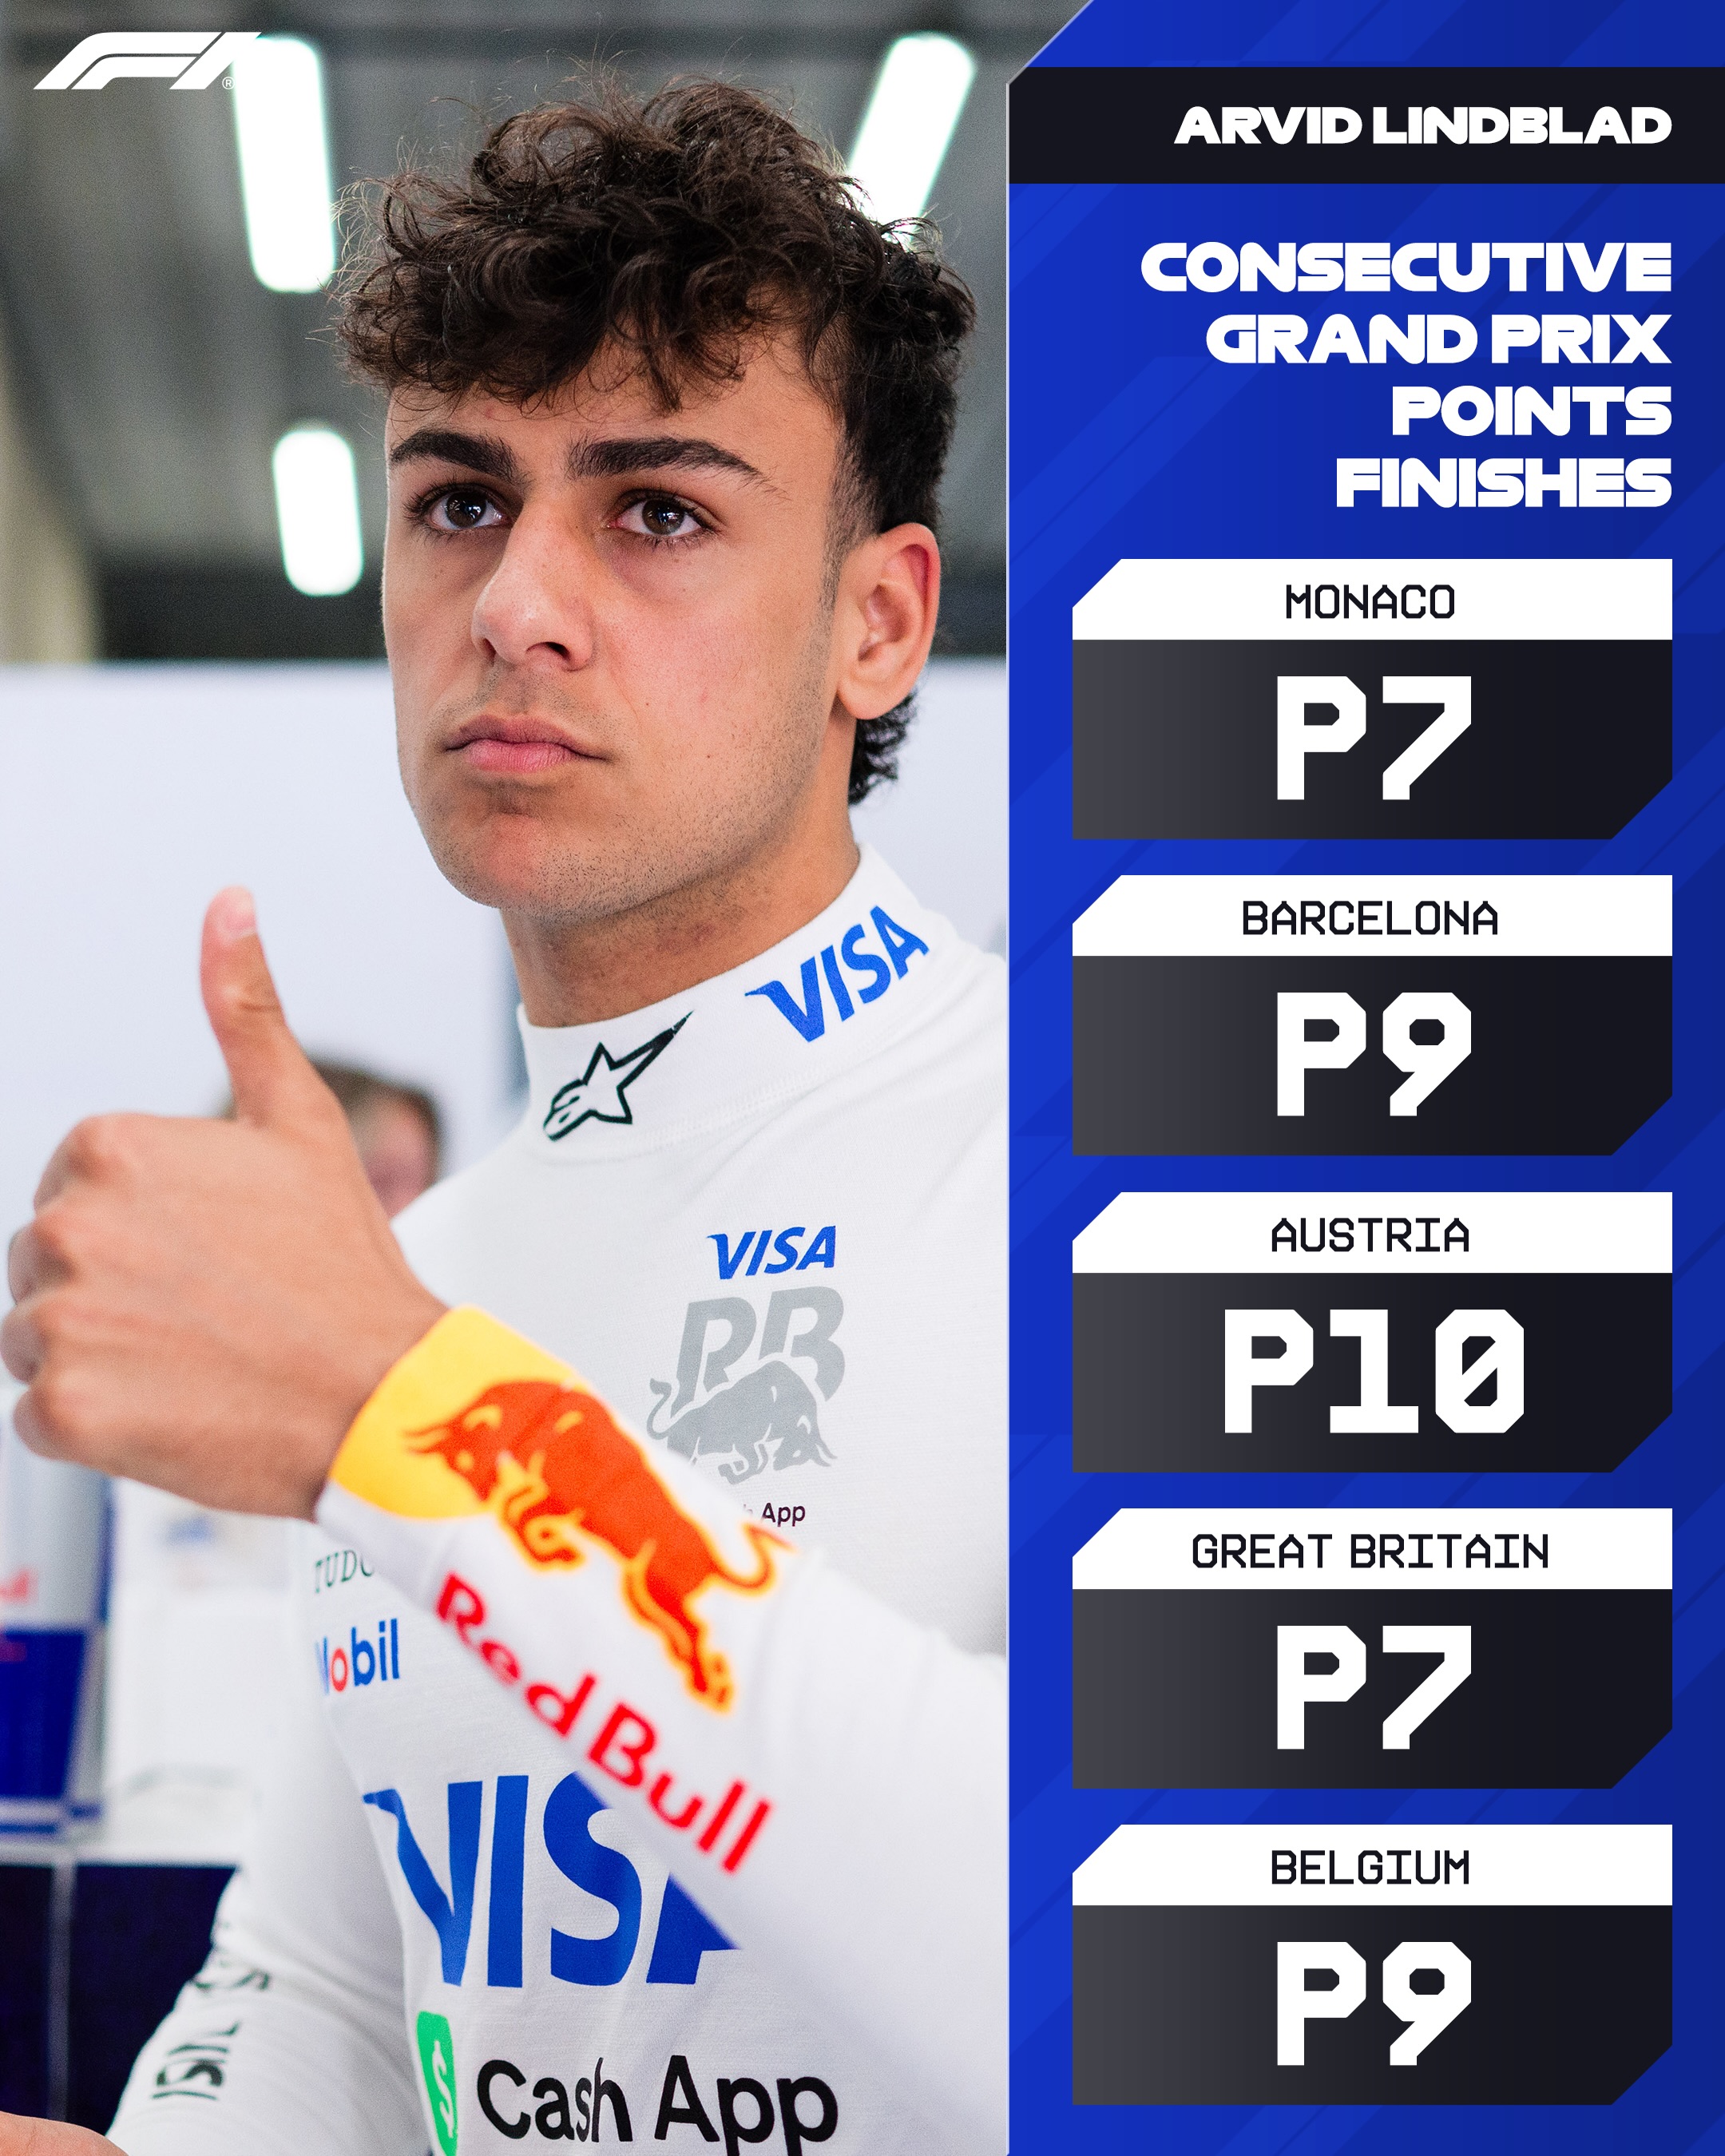 2M87.4×F1 driver stats graphic post@f1 · Milestone Celebration
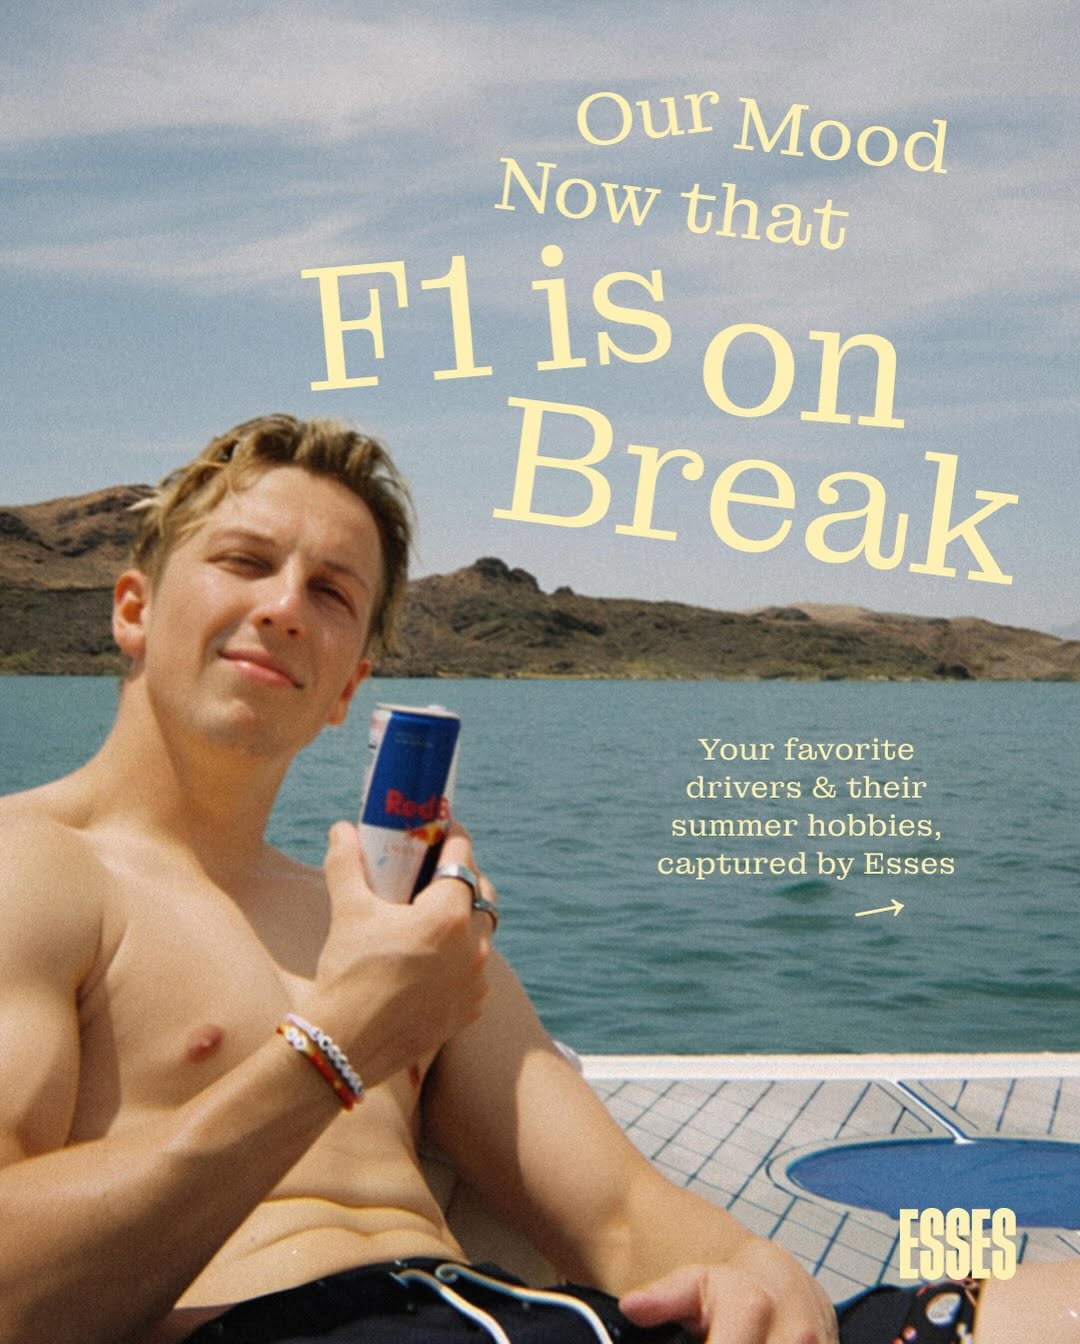 106.2K3.8×F1 driver relaxing on summer break@essesmag · Lifestyle Showcase
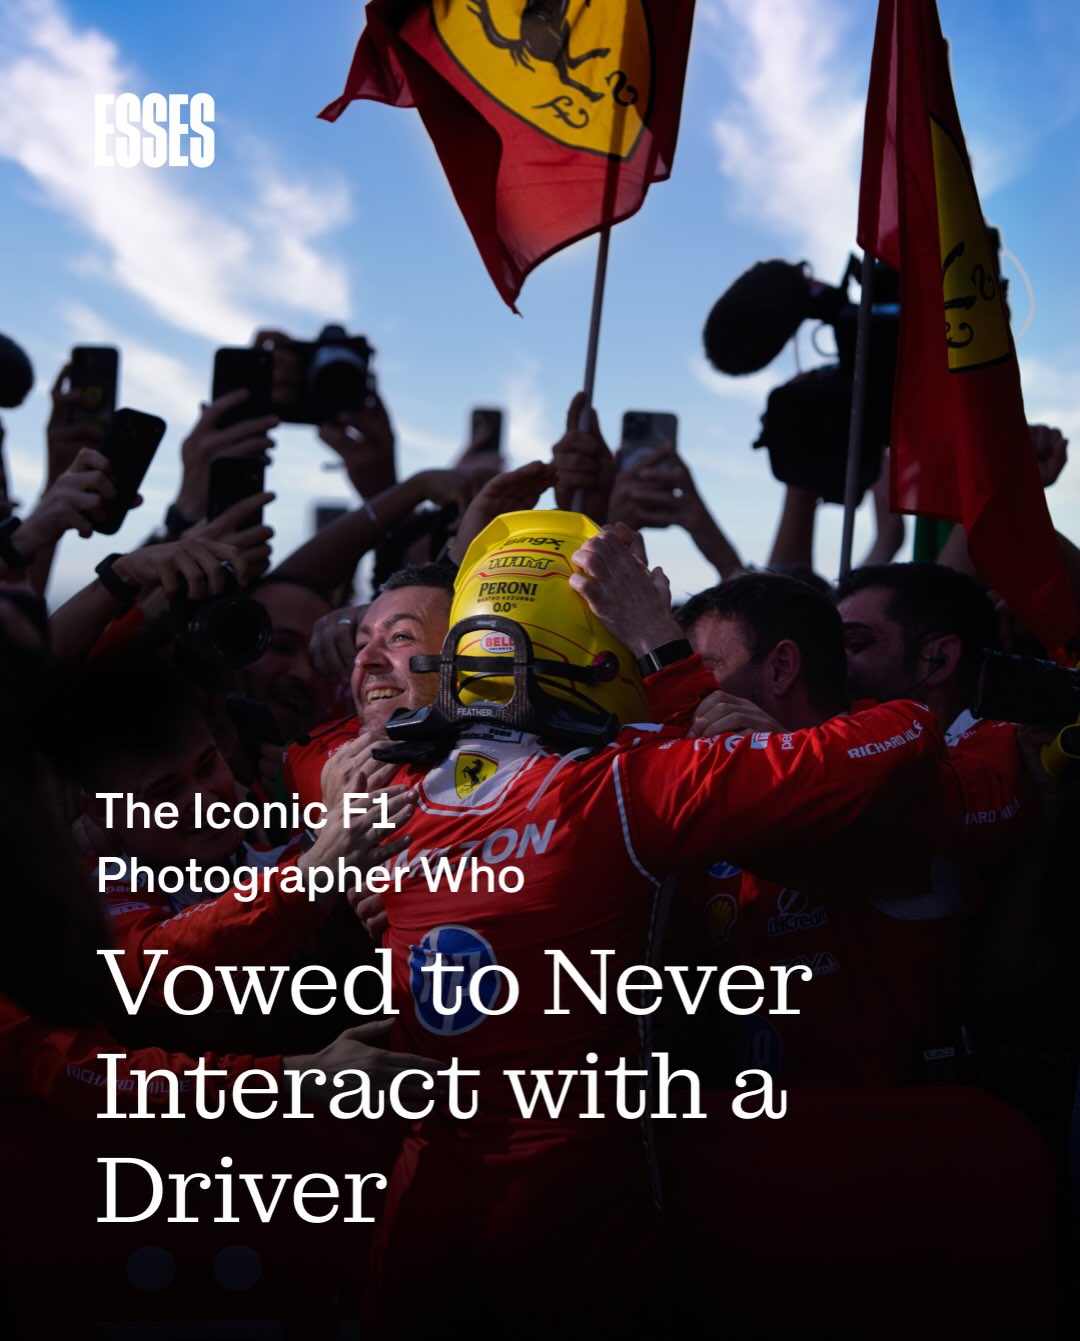 1.3M58.4×F1 photographer's unique story@essesmag · Editorial Carousel
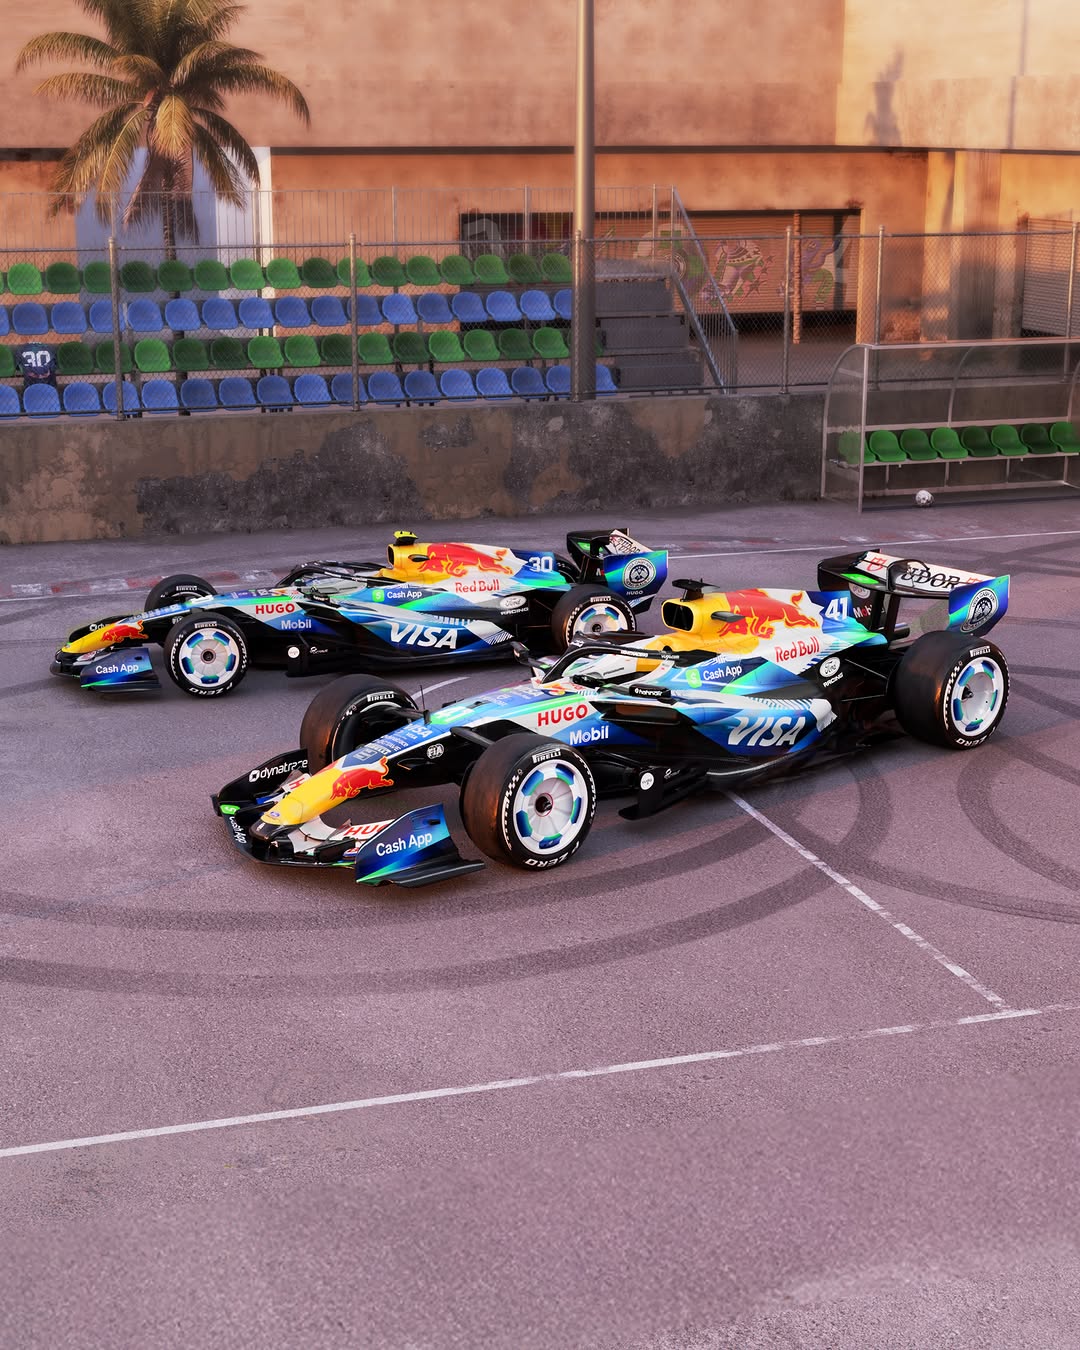 5.5M75.8×Two colorful F1 race cars@visacashapprb · Brand Showcase
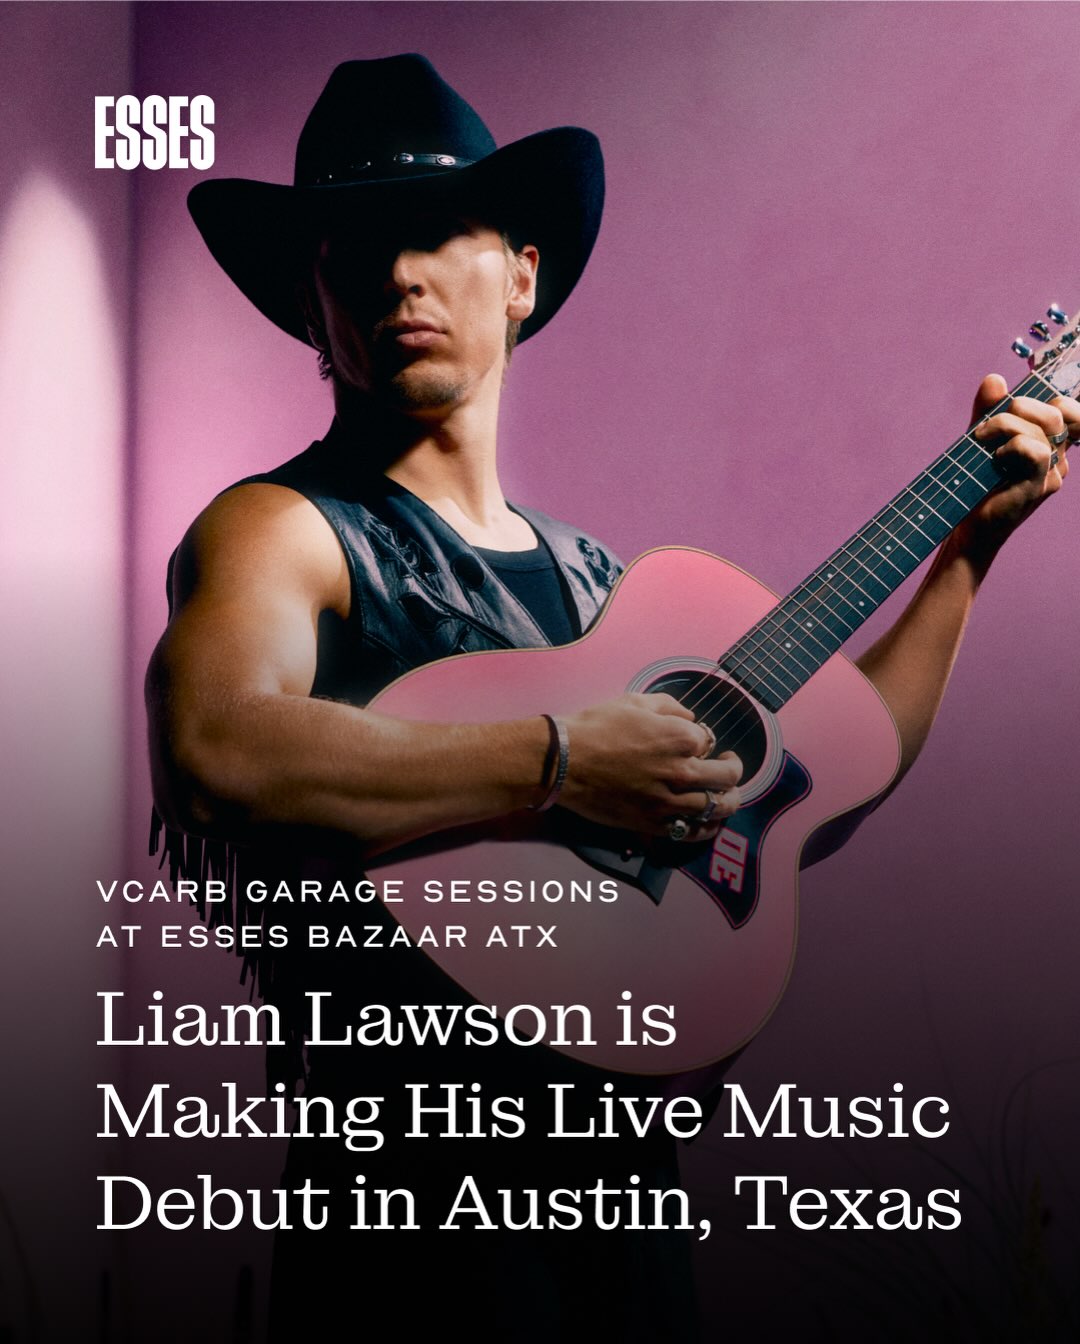 503.3K16.6×F1 driver's country music debut@essesmag · Editorial Carousel
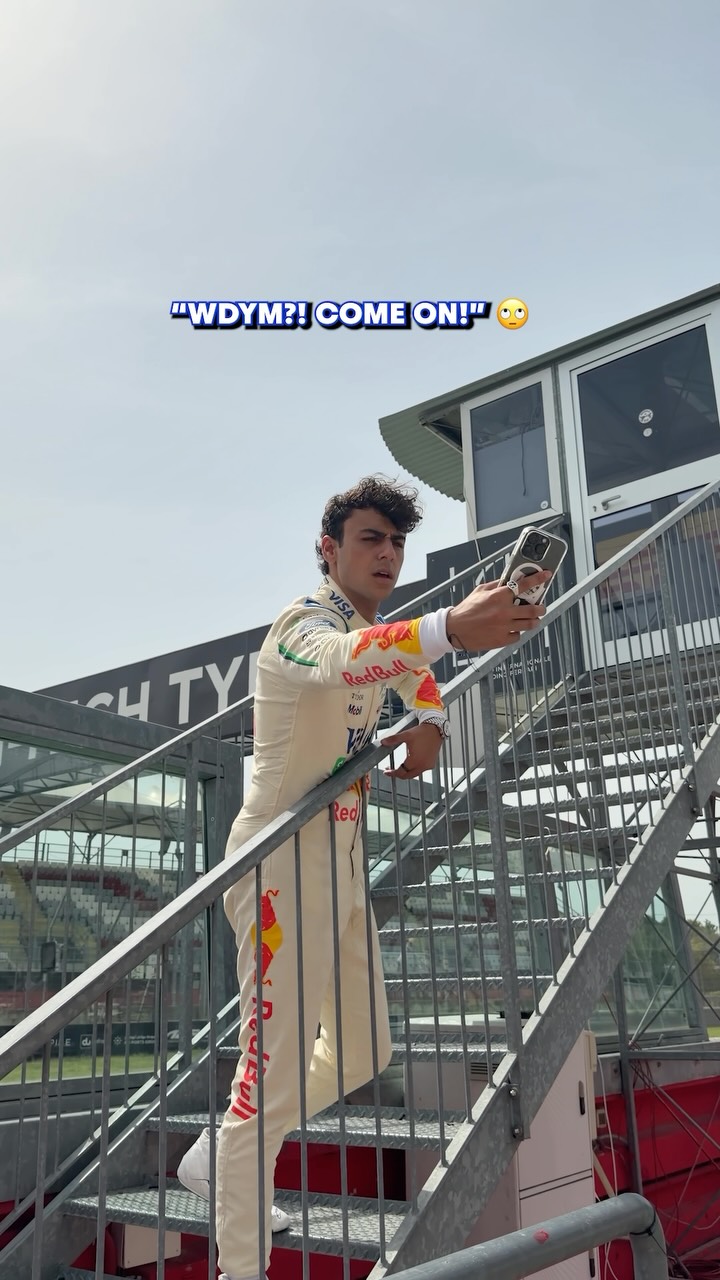 408.7K9.4×Driver too shy for photos@visacashapprb · Relatable One Shot
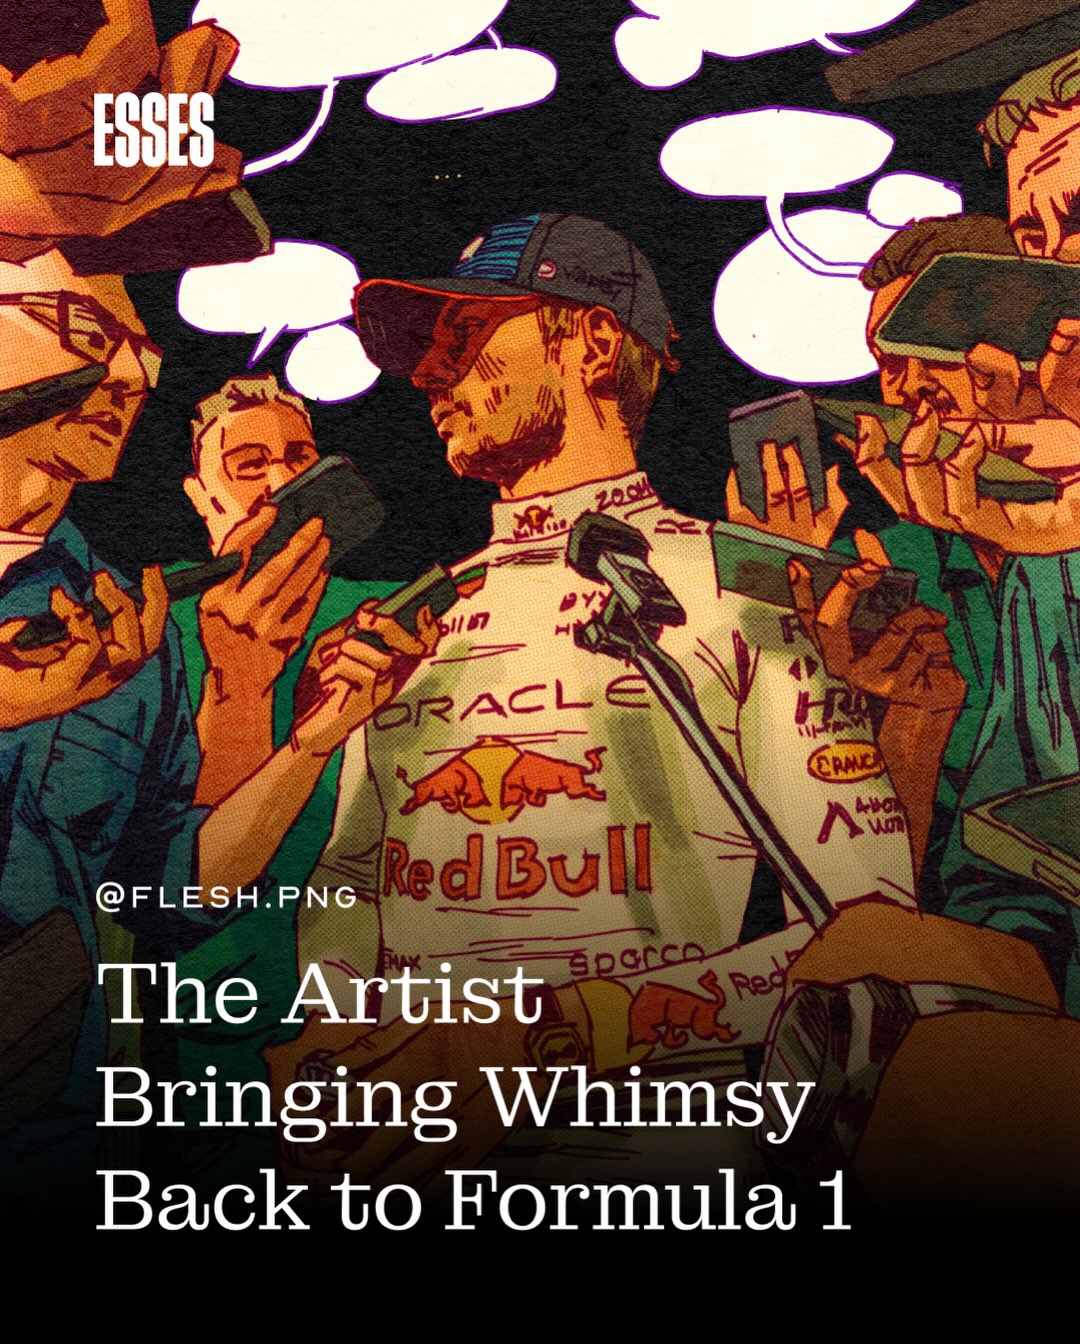 214.2K7.2×Illustrated Formula 1 driver interview@essesmag · Editorial Carousel
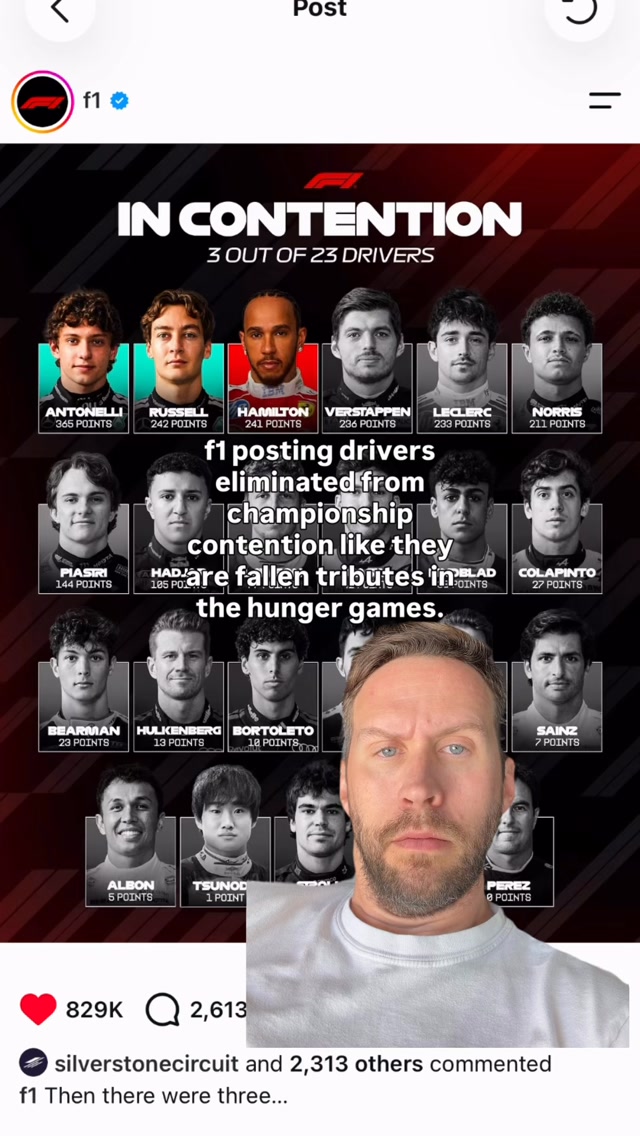 318.9K17.1×F1 post as Hunger Games tribute@thisjamescoker · Trendjacking
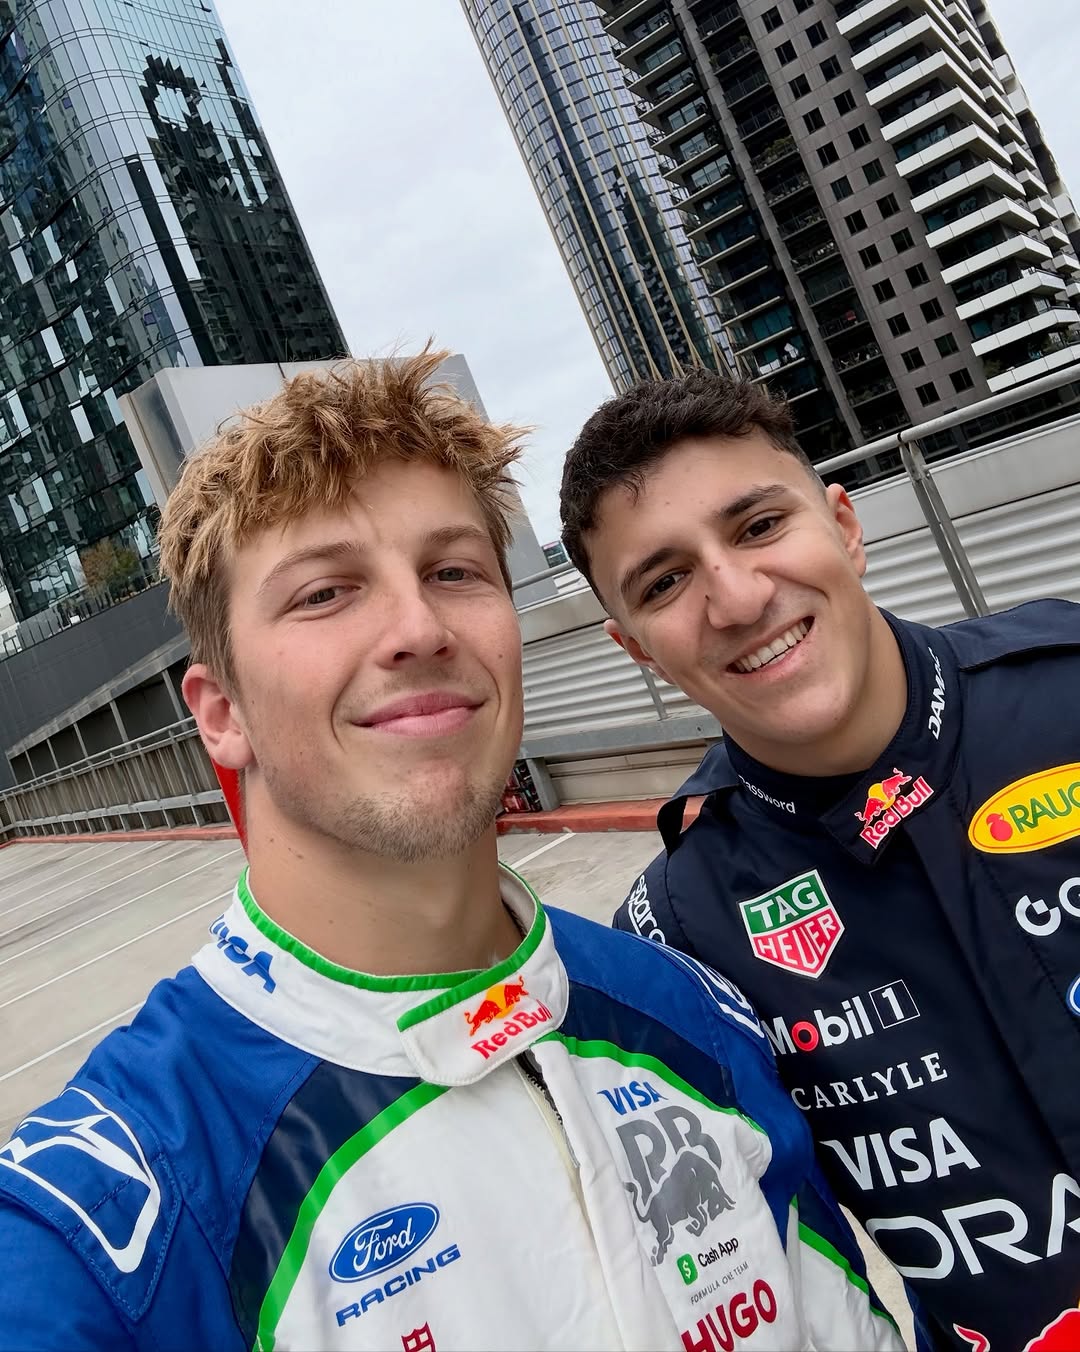 1.9M22.3×Selfie of two racing drivers@visacashapprb · Behind The Scenes
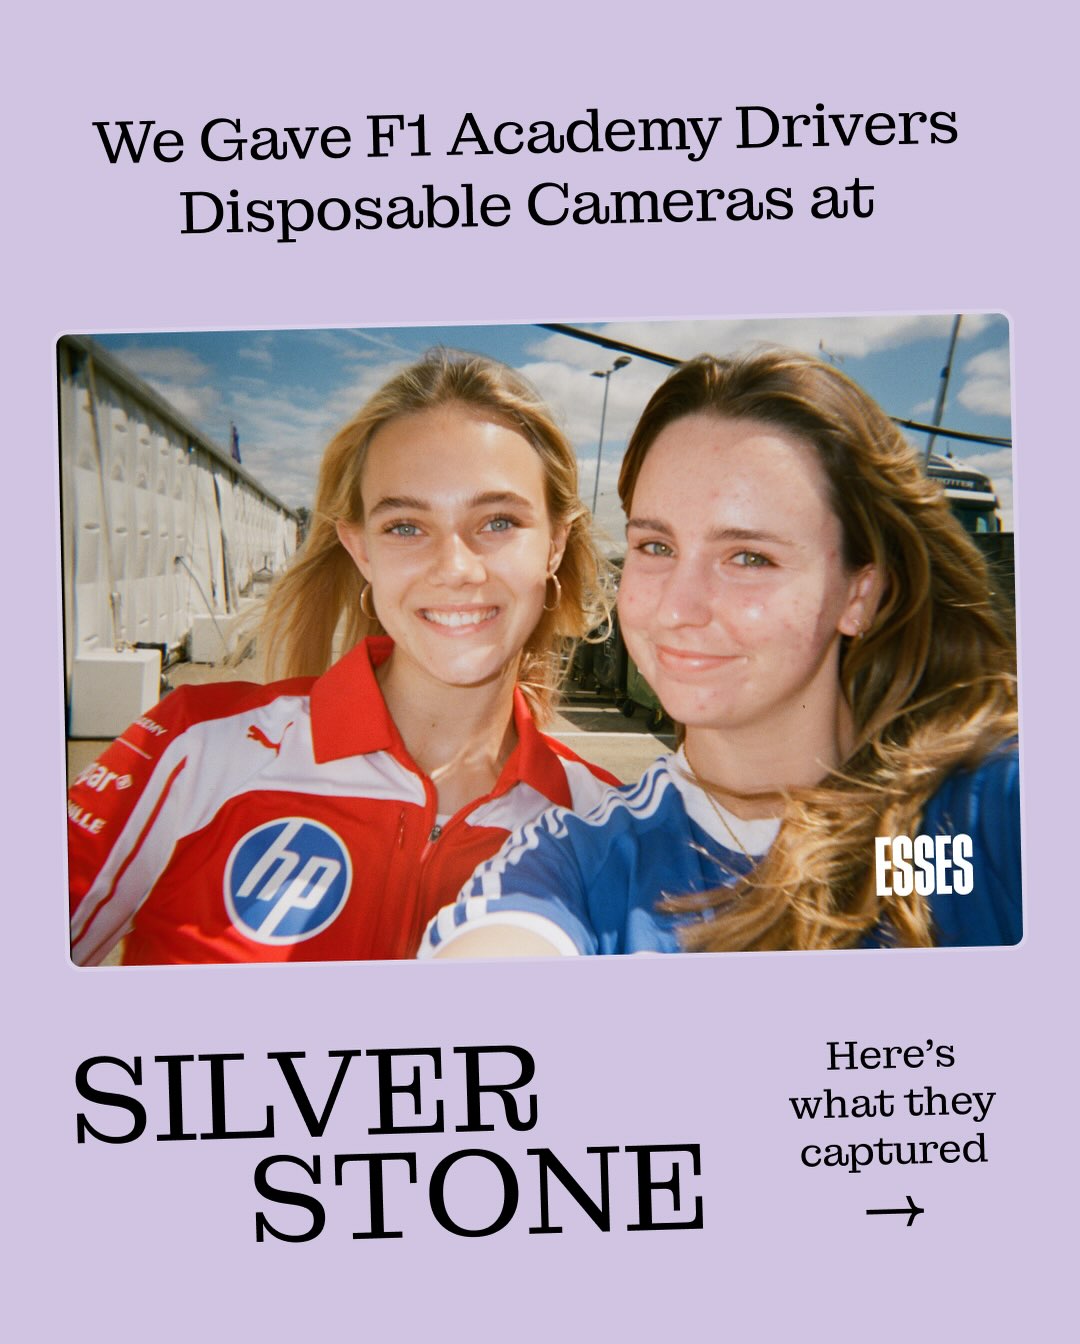 183.9K6.6×F1 drivers with disposable cameras@essesmag · Behind The Scenes
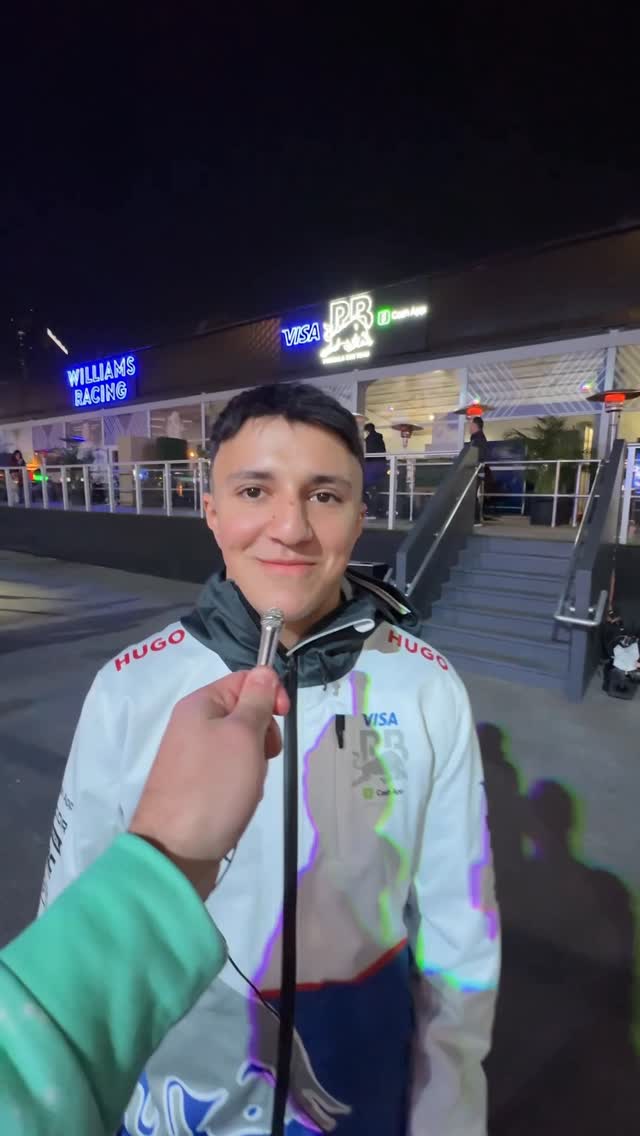 2.7M2×Celebrities all name same favorite driver@visacashapprb · Question Montage
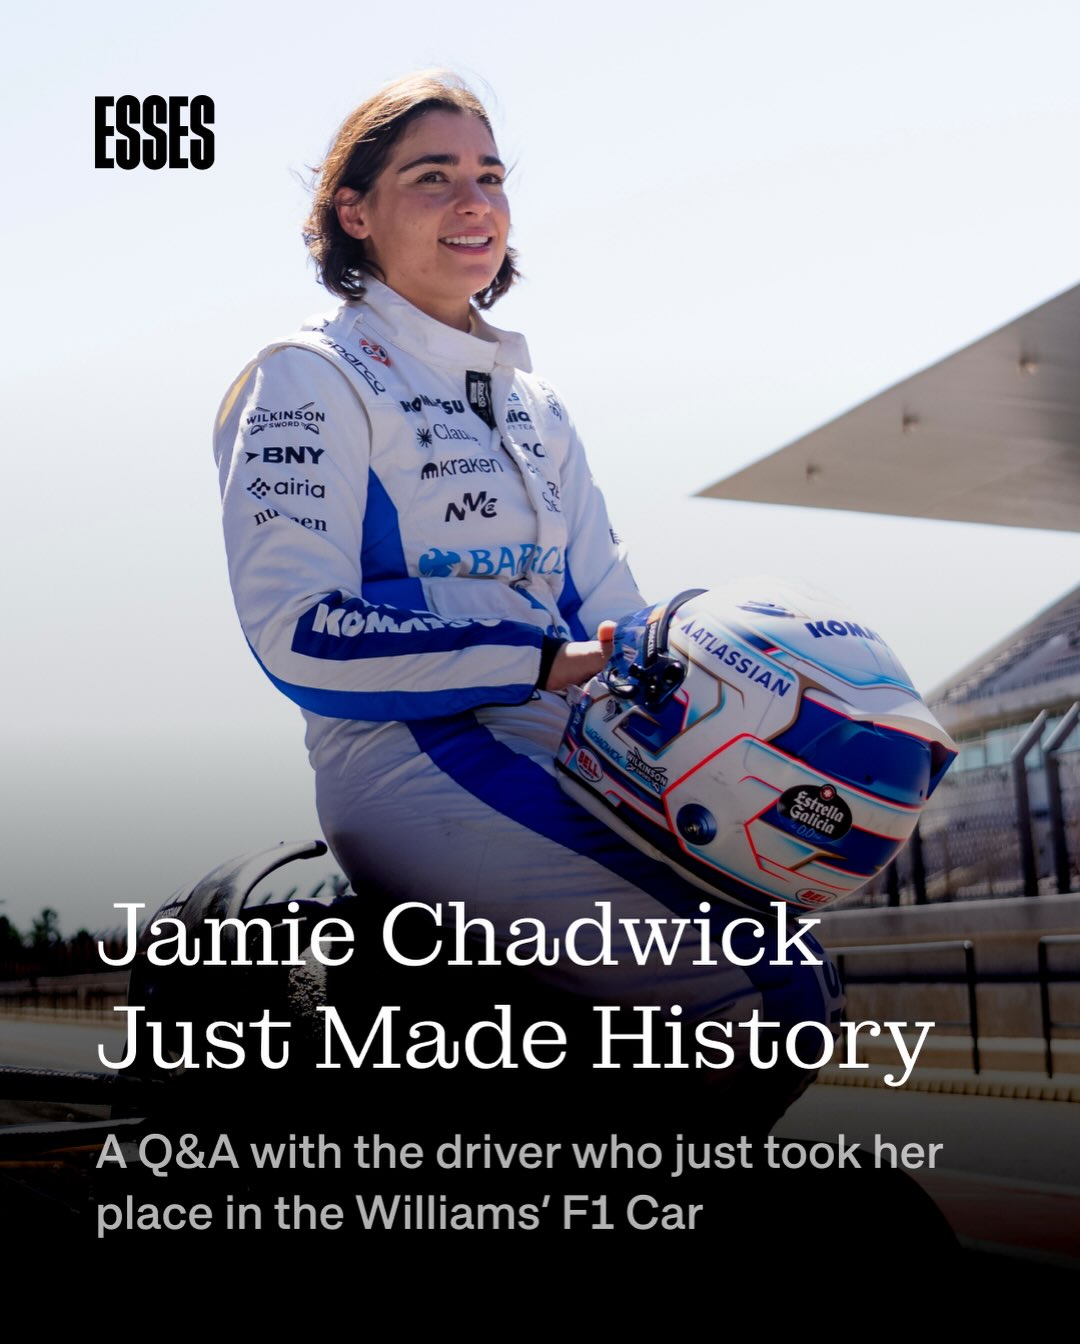 74.8K2.5×Female F1 driver makes history@essesmag · Editorial Carousel
[04]
[05]
What stops the scroll in the first 3 seconds
Title hook · 65%
8 TOP TENS IN LAST 9 RACES
Verbal hook · 5%
Lindblad’s levels 😤
Visual hook · 30%
An intense, dramatically lit close-up portrait of a driver is juxtaposed with a bold, blue data visualization graphic, creating a strong contrast between the human subject and their performance statistics.
[06]
Steal this for your own video
IN LAST
[07]
The promise the opener makes, and how the video pays it back
Hook
A large, high-quality portrait of the subject is paired with a bold, quantifiable headline to immediately establish the story's hero and their impressive achievement.
Payoff
The viewer receives a complete, credible, and impressive narrative in a single glance, delivering instant understanding and validation of the subject's success.
[08]
The structural pattern this video runs on
Framework
The Data-Backed Hero Shot
Combines a compelling subject portrait with a bold statistical claim and an immediate data visualization to tell a complete, verifiable story of achievement in a single, dense frame.
The Visual Evidence
A central data visualization (e.g., a graph) is presented as the undeniable proof for the headline's claim, allowing the audience to trace the journey and verify the achievement for themselves.
The Data Legend
A clear legend or set of labels runs parallel to the data visualization, providing the necessary context (e.g., events, dates, locations) to fully understand the data points and the scope of the achievement.
Lindblad’s levels 😤 The rookie has shown remarkable consistency, scoring in eight of the last nine Grands Prix 👏 #F1 #Formula1 @arvid.lindblad @visacashapprb
branding · photo_0
ARVID LINDBLAD
title · photo_0
8 TOP TENS IN LAST 9 RACES
informational · photo_0
P6
informational · photo_0
P9
informational · photo_0
P10
contextual · photo_0
ROUND 6
branding · photo_0
VISA