@f1
Instagram · Carousel
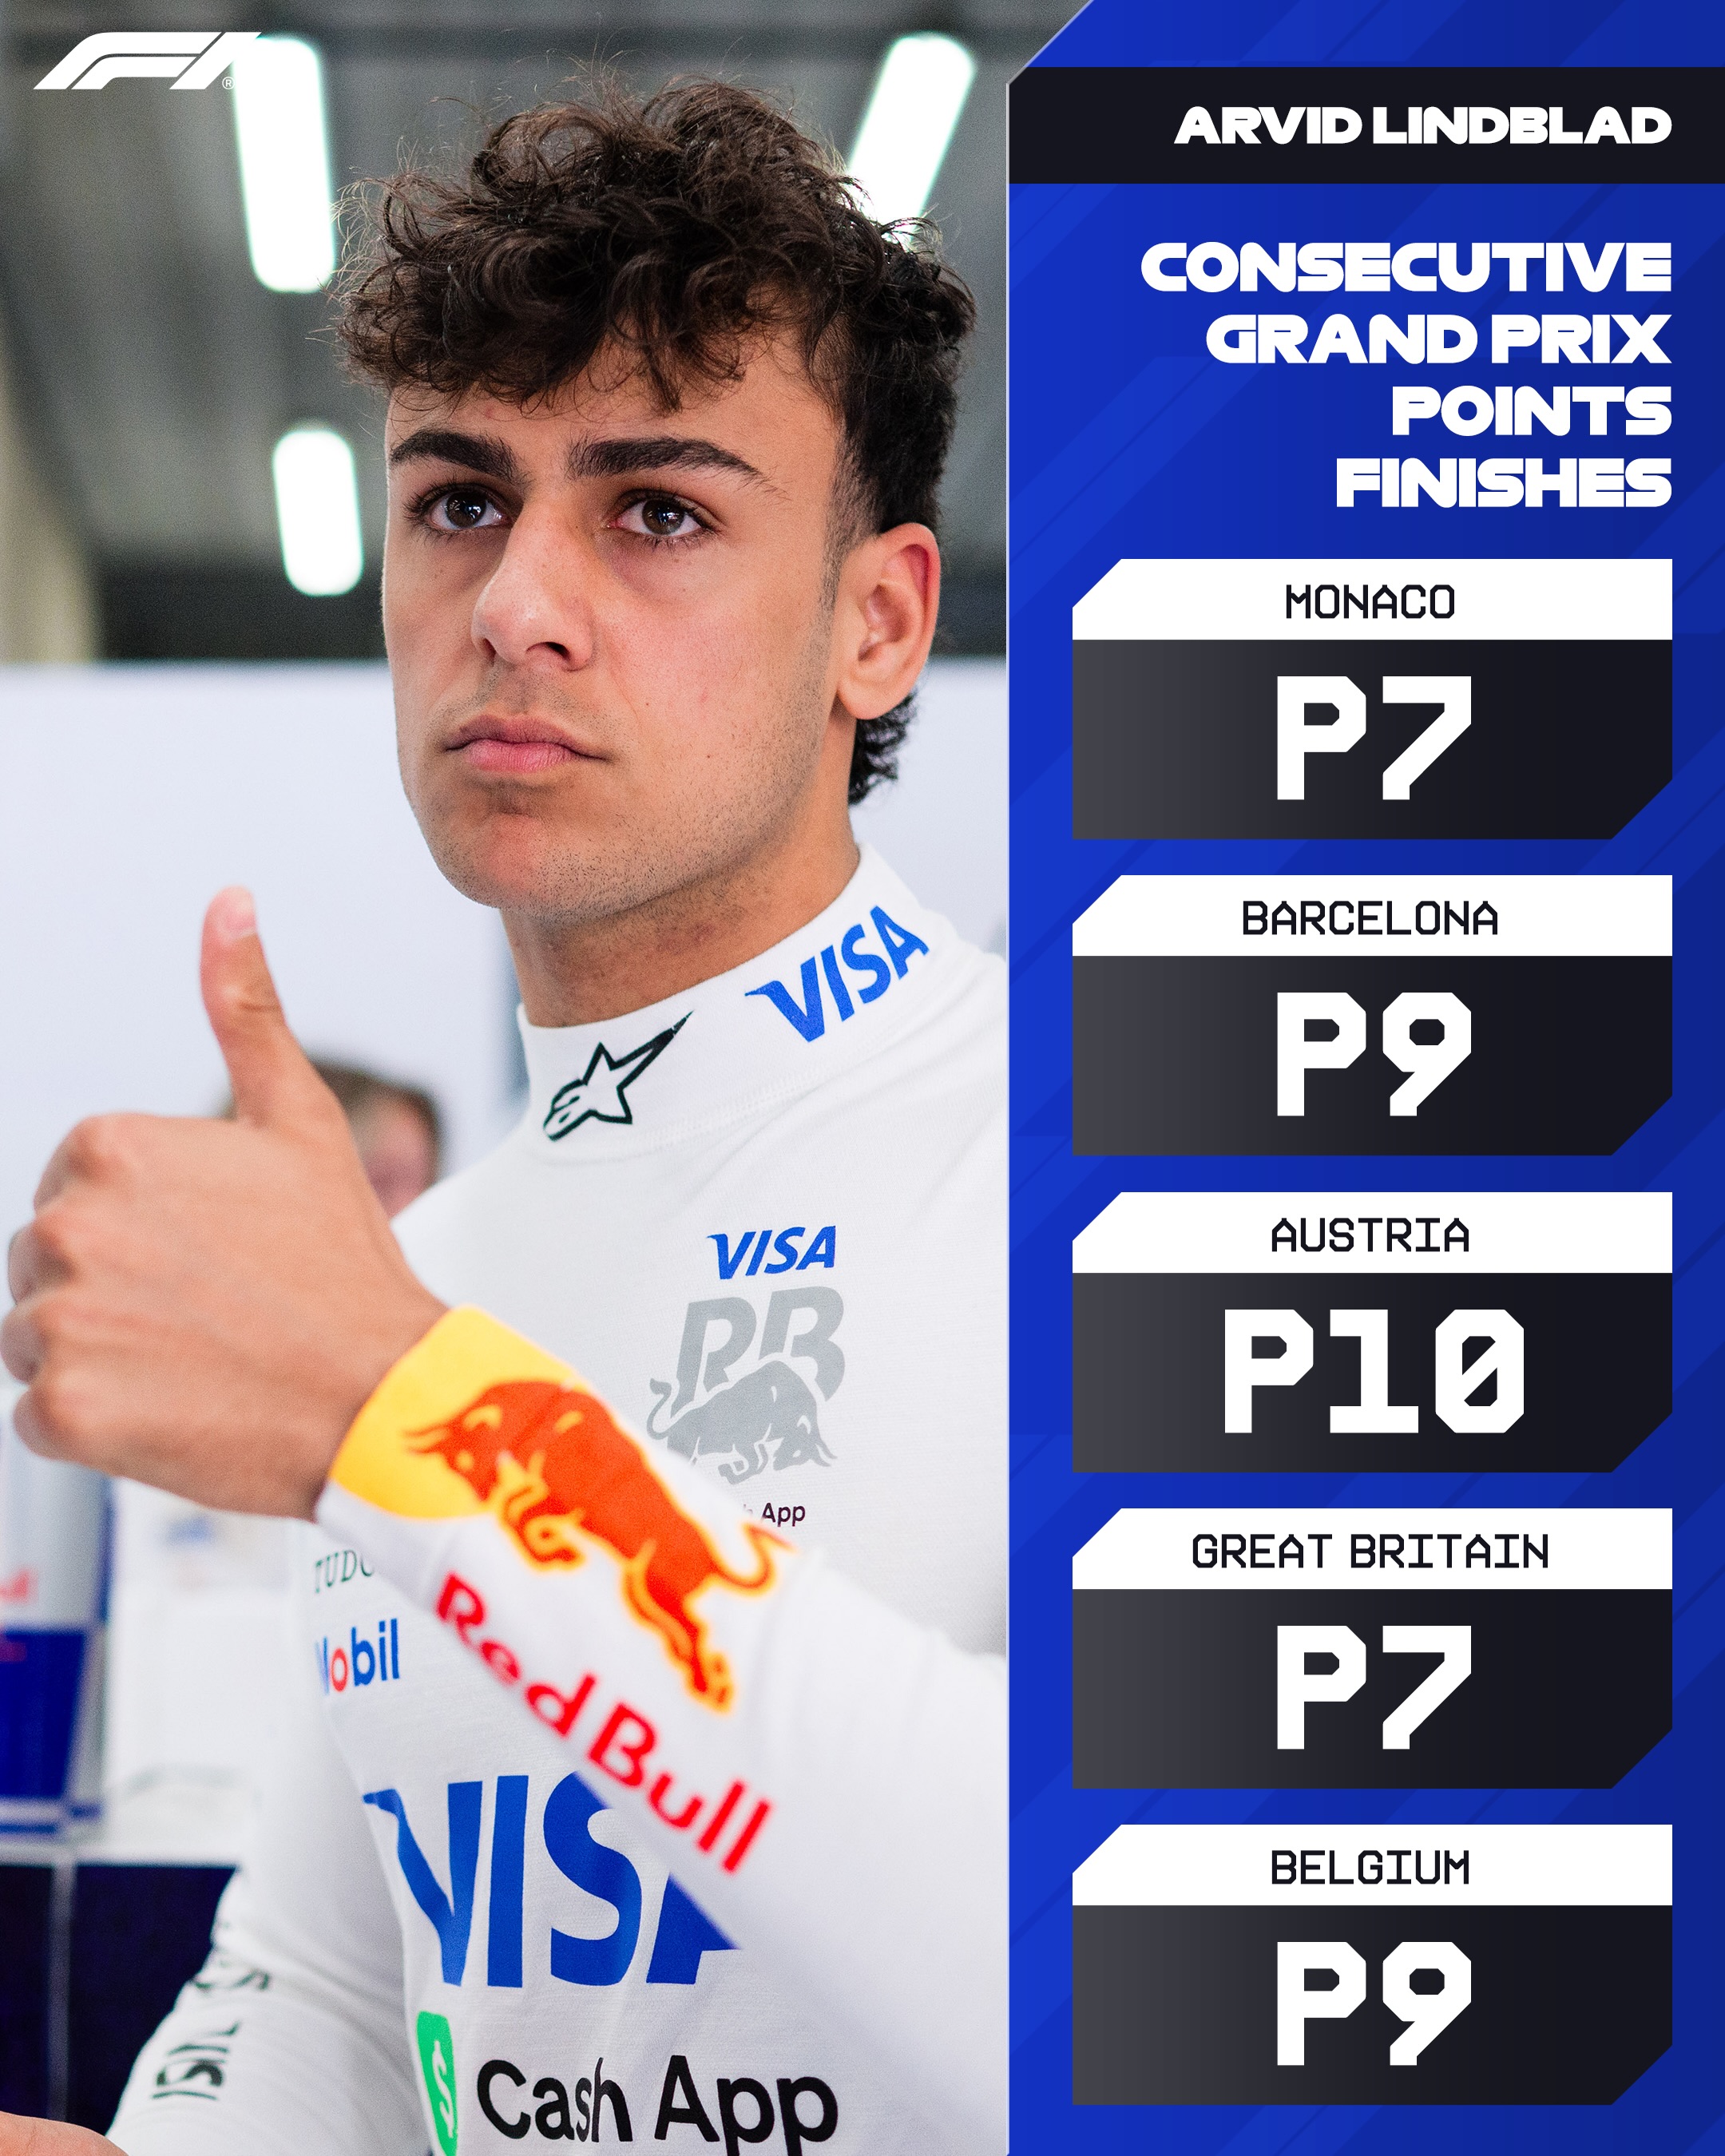
@f1 Impressing consistently 🤝 What a run of consecutive of Grand Prix points finishes from rookie @arvid.lindblad 🤩 #F1 #Formula1 #BelgianGP @visacashapprb

@f1
Instagram · Carousel
@f1 Impressing consistently 🤝 What a run of consecutive of Grand Prix points finishes from rookie @arvid.lindblad 🤩 #F1 #Formula1 #BelgianGP @visacashapprb
Performance
Video #36854 · Carousel
[01]
The image is a composite graphic celebrating Formula 1 driver Arvid Lindblad. The left side features a photo of Lindblad in his racing suit giving a thumbs-up, while the right side is a graphic panel listing his consecutive points finishes in recent Grand Prix races.
[02]
[03]
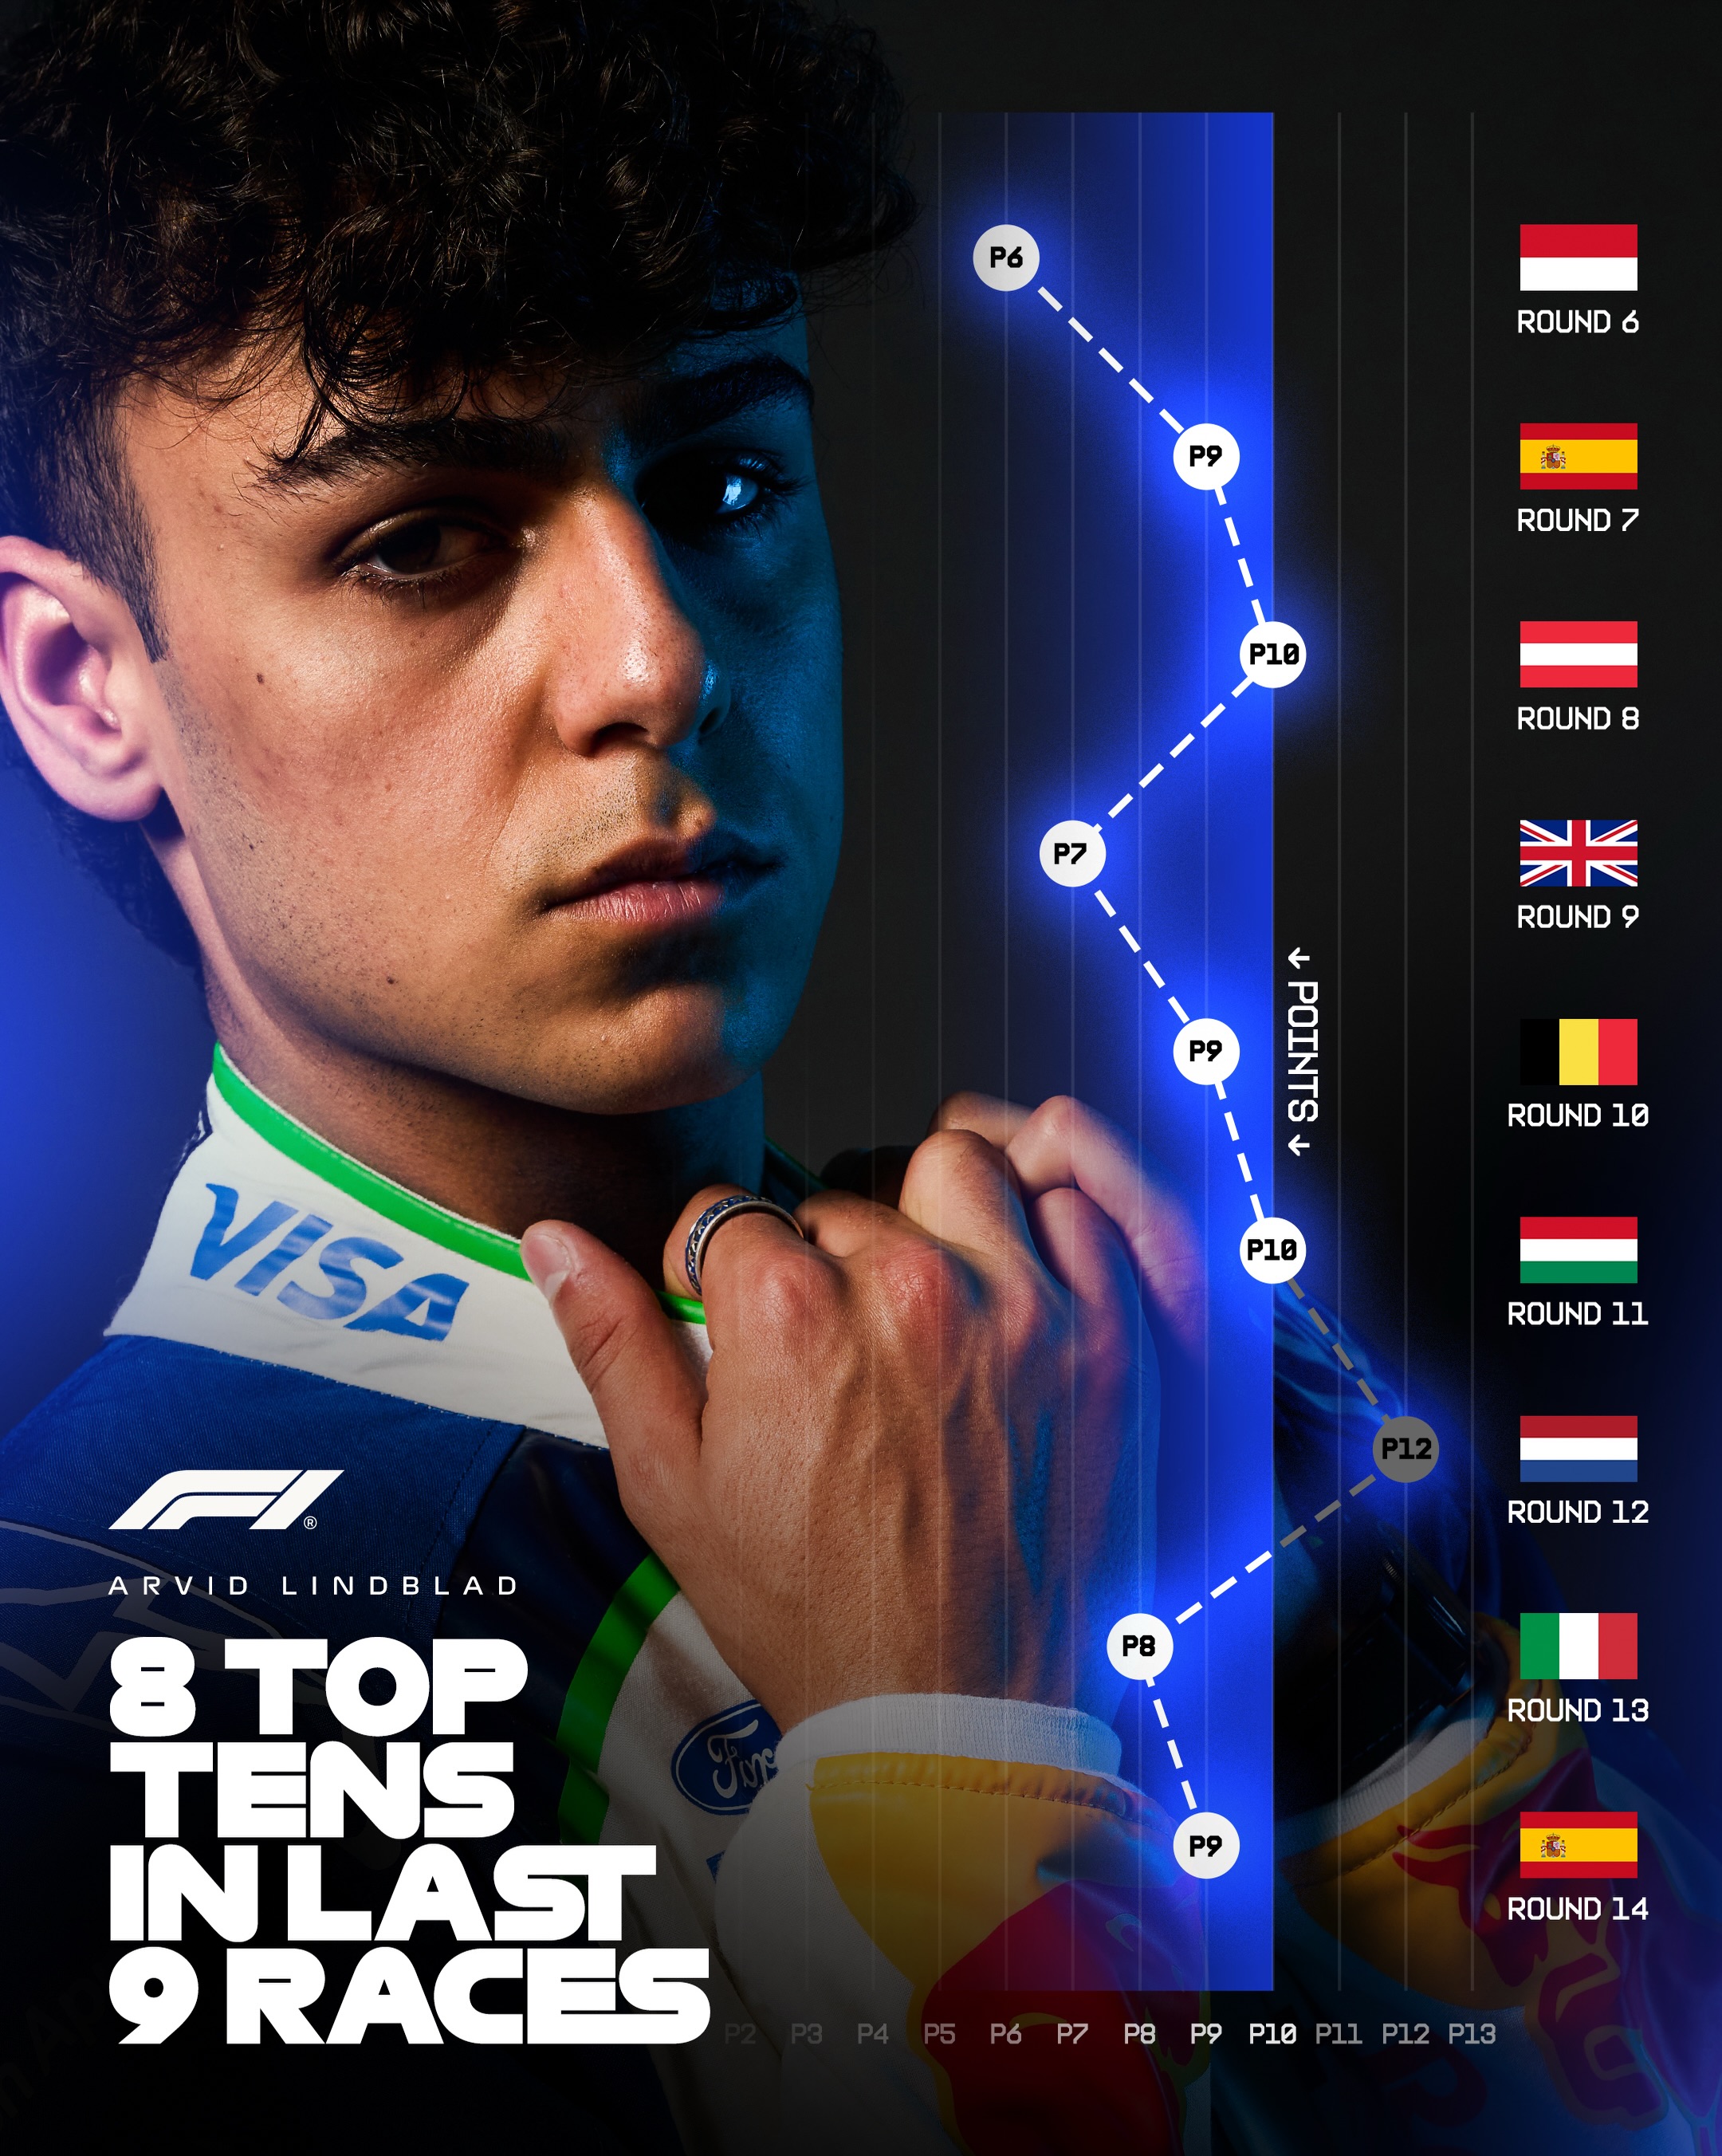 2.1M76.5×Racing driver performance stat graphic.@f1 · Performance Proof
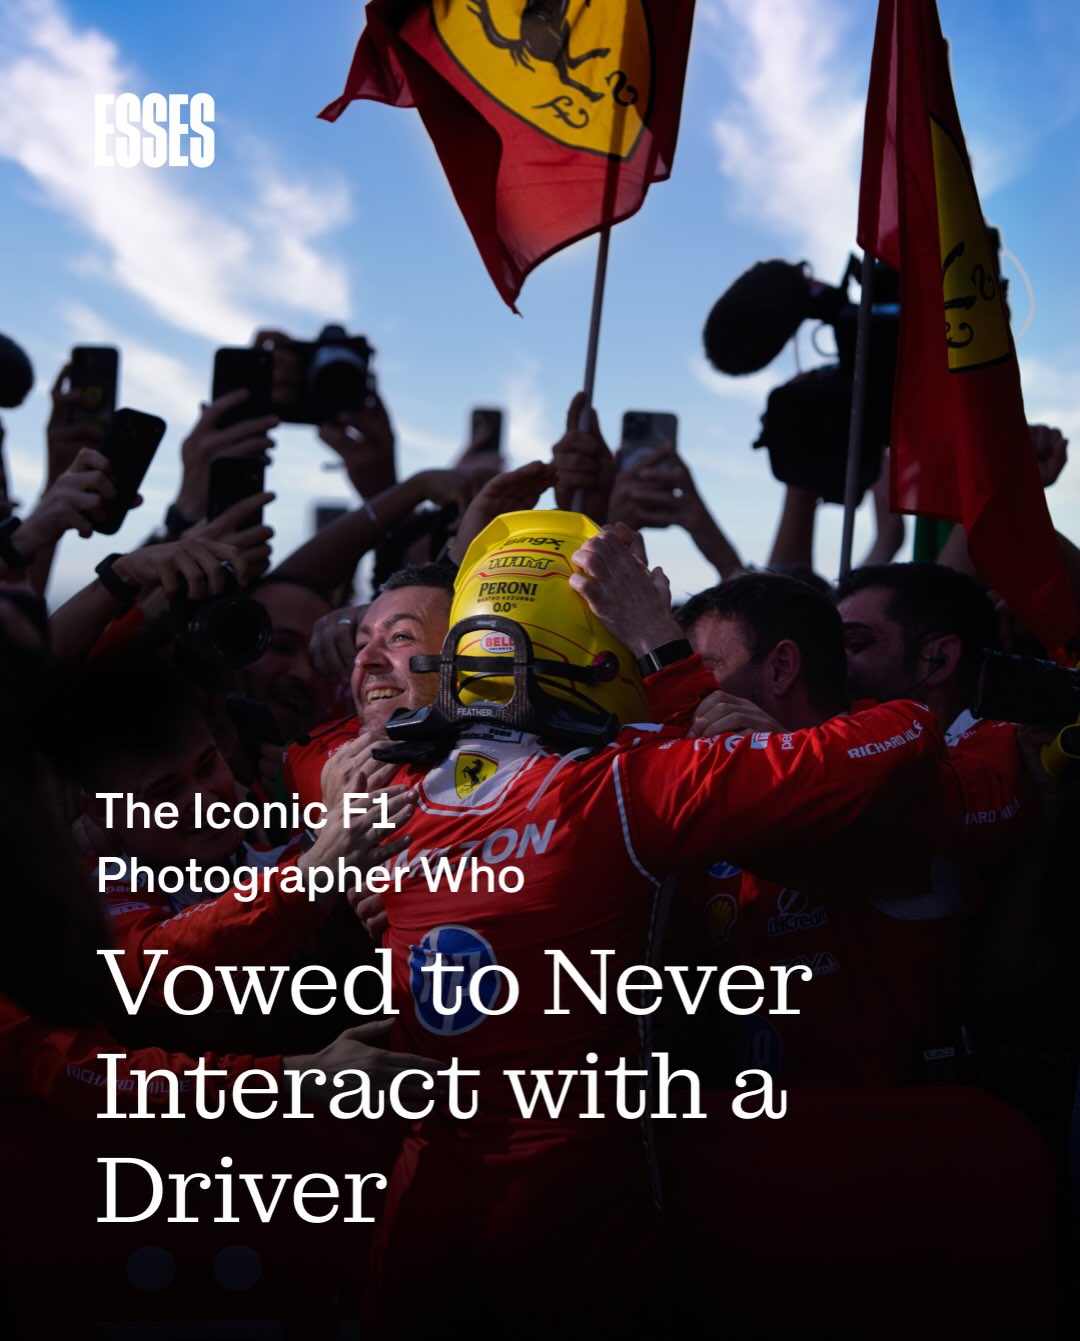 1.3M58.4×F1 photographer's unique story@essesmag · Editorial Carousel
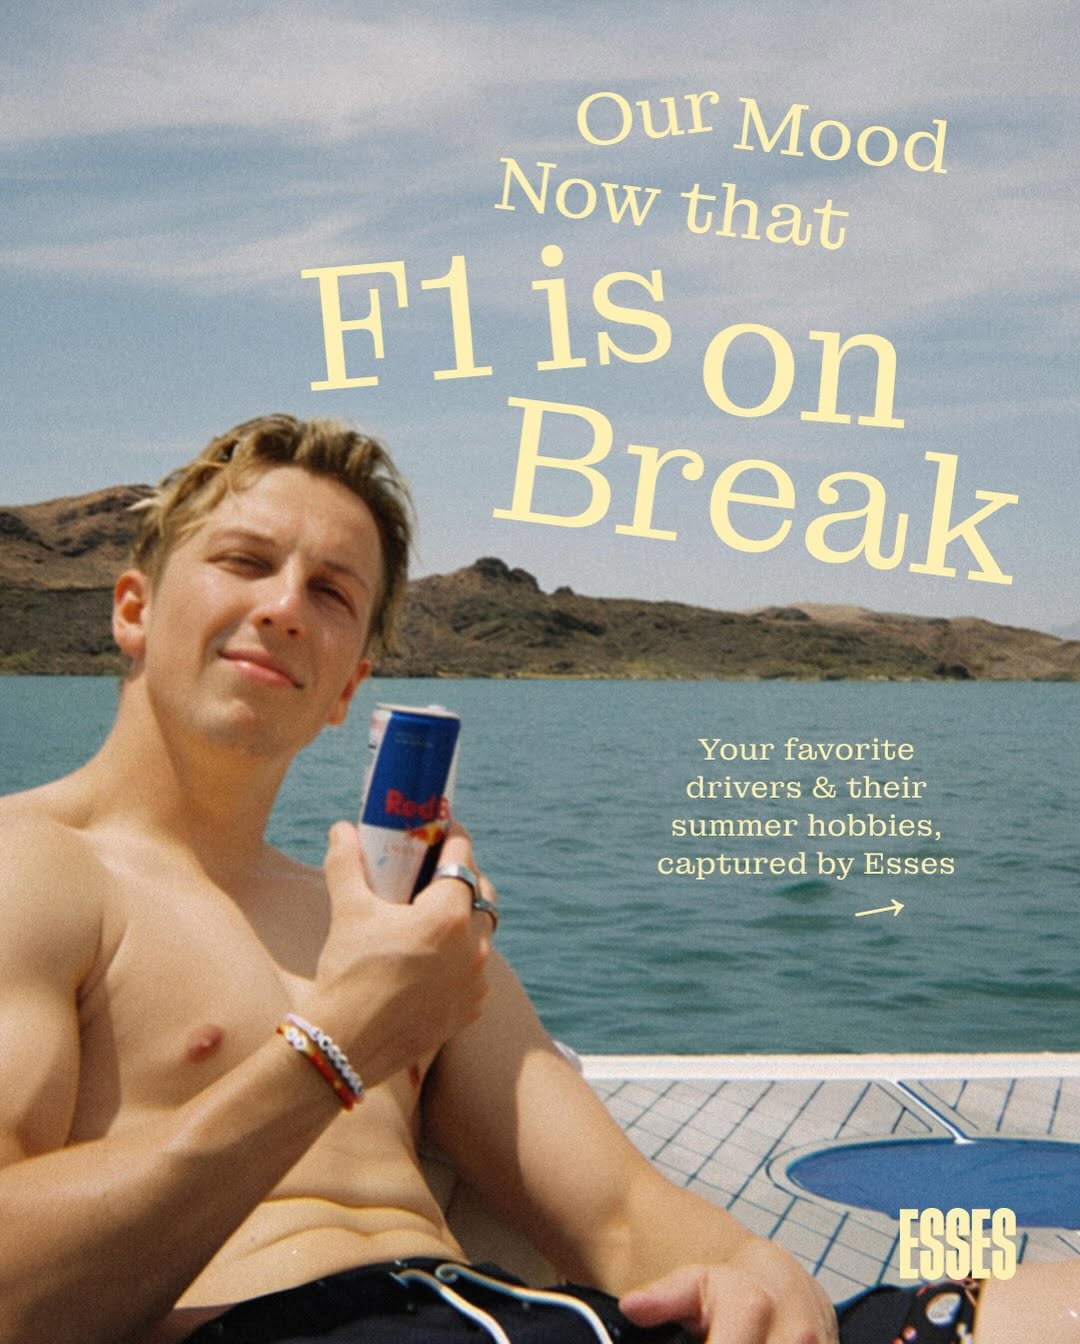 106.2K3.8×F1 driver relaxing on summer break@essesmag · Lifestyle Showcase
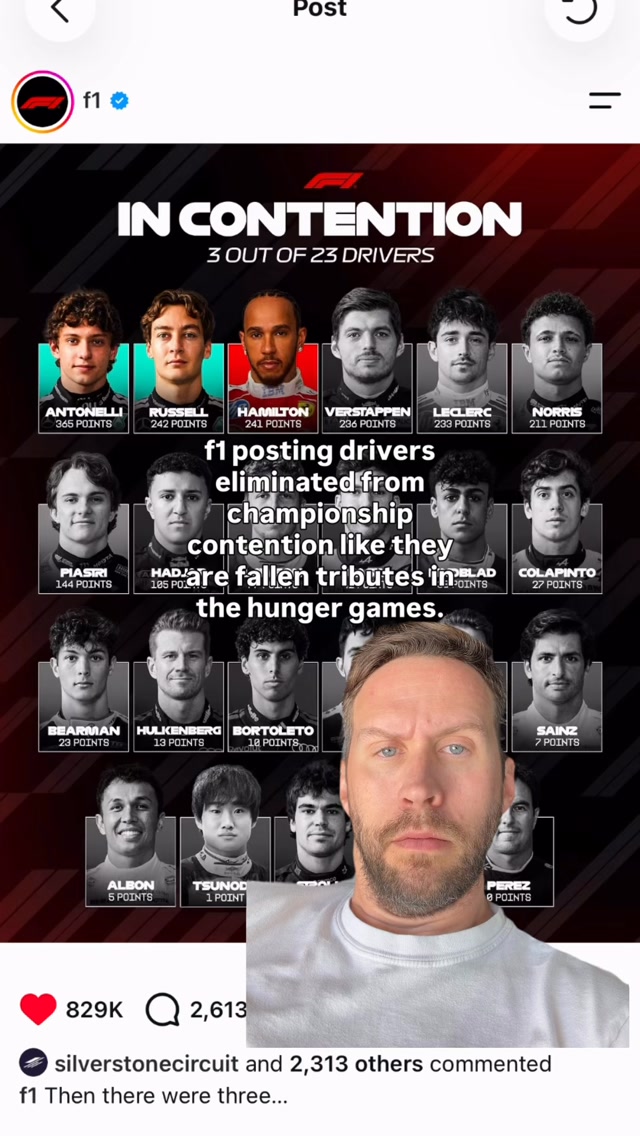 318.9K17.1×F1 post as Hunger Games tribute@thisjamescoker · Trendjacking
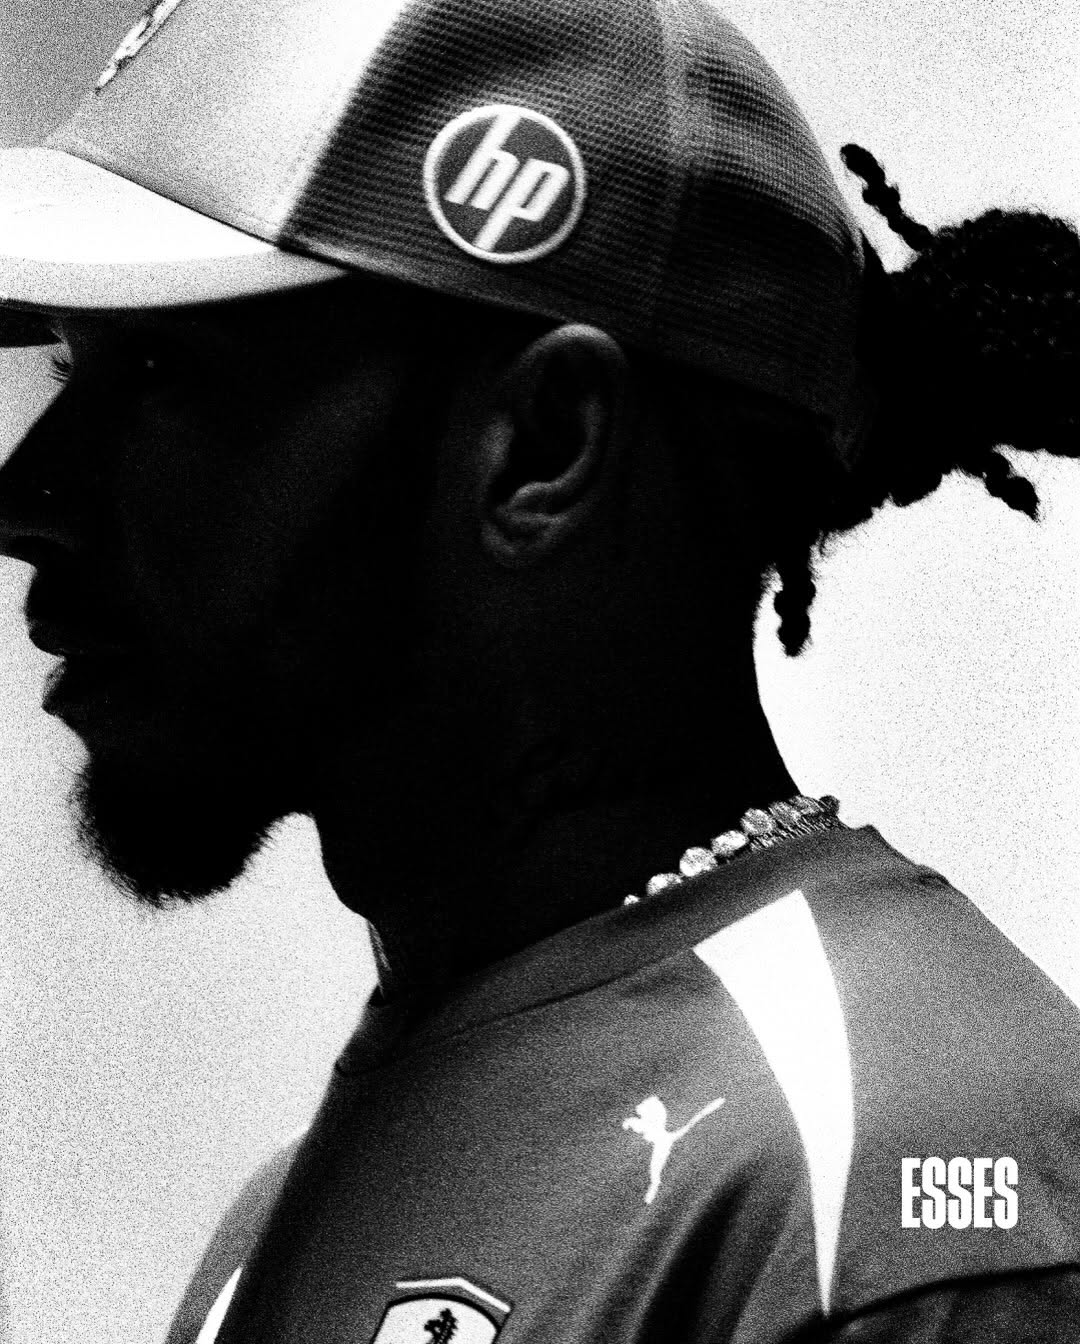 109.2K7.2×Dramatic black and white athlete portrait@essesmag · Editorial Carousel
 183.9K6.6×F1 drivers with disposable cameras@essesmag · Behind The Scenes
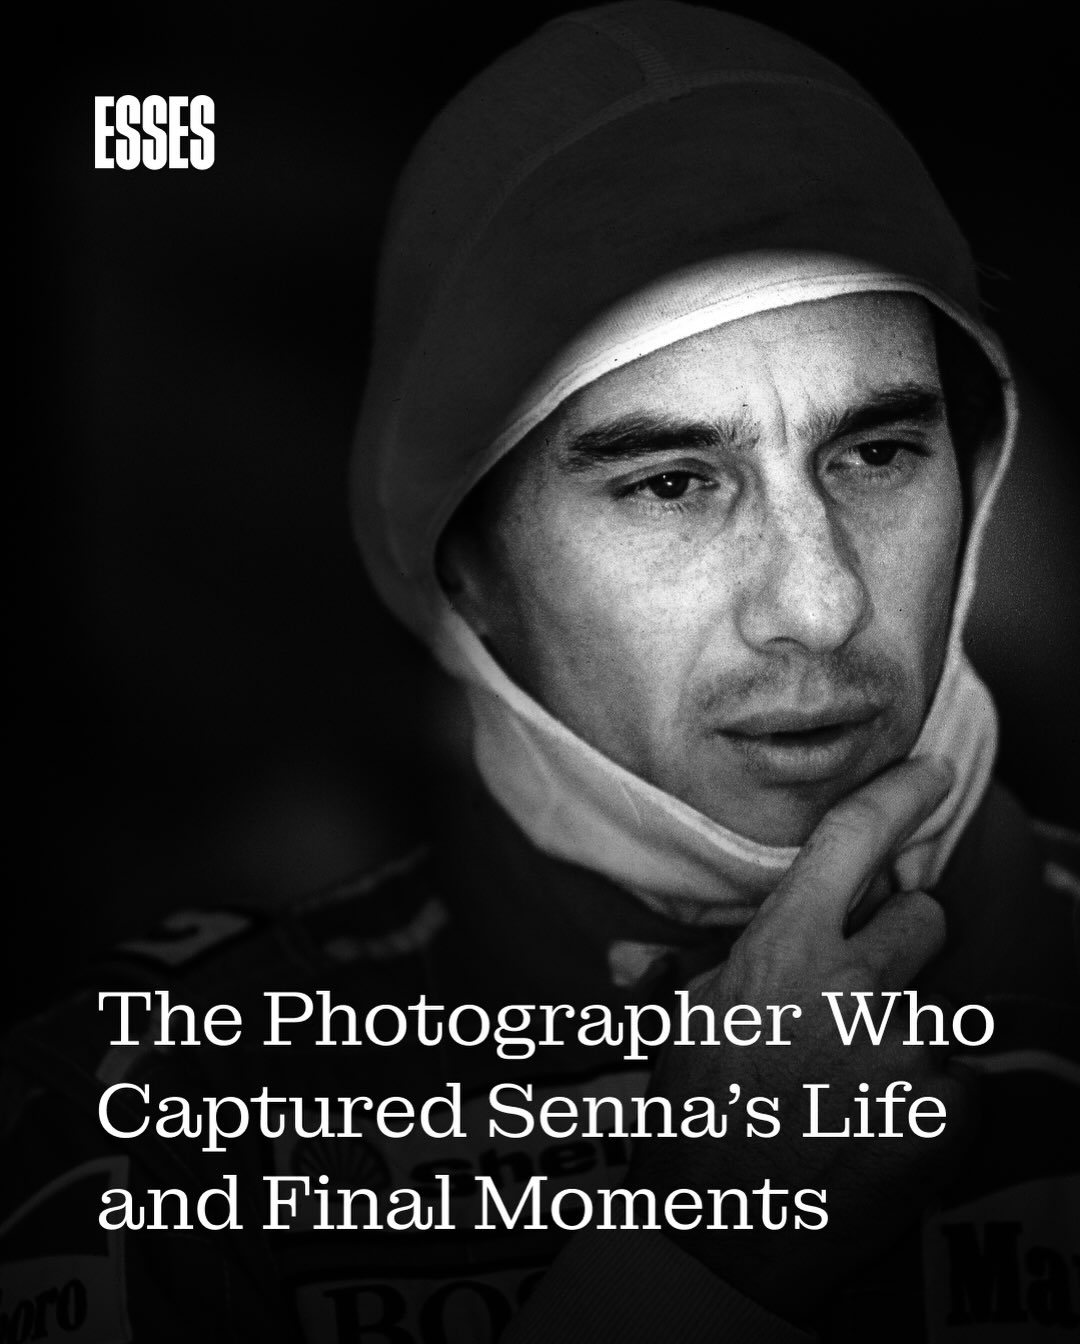 167.7K5.6×Dramatic portrait of Ayrton Senna@essesmag · Editorial Carousel
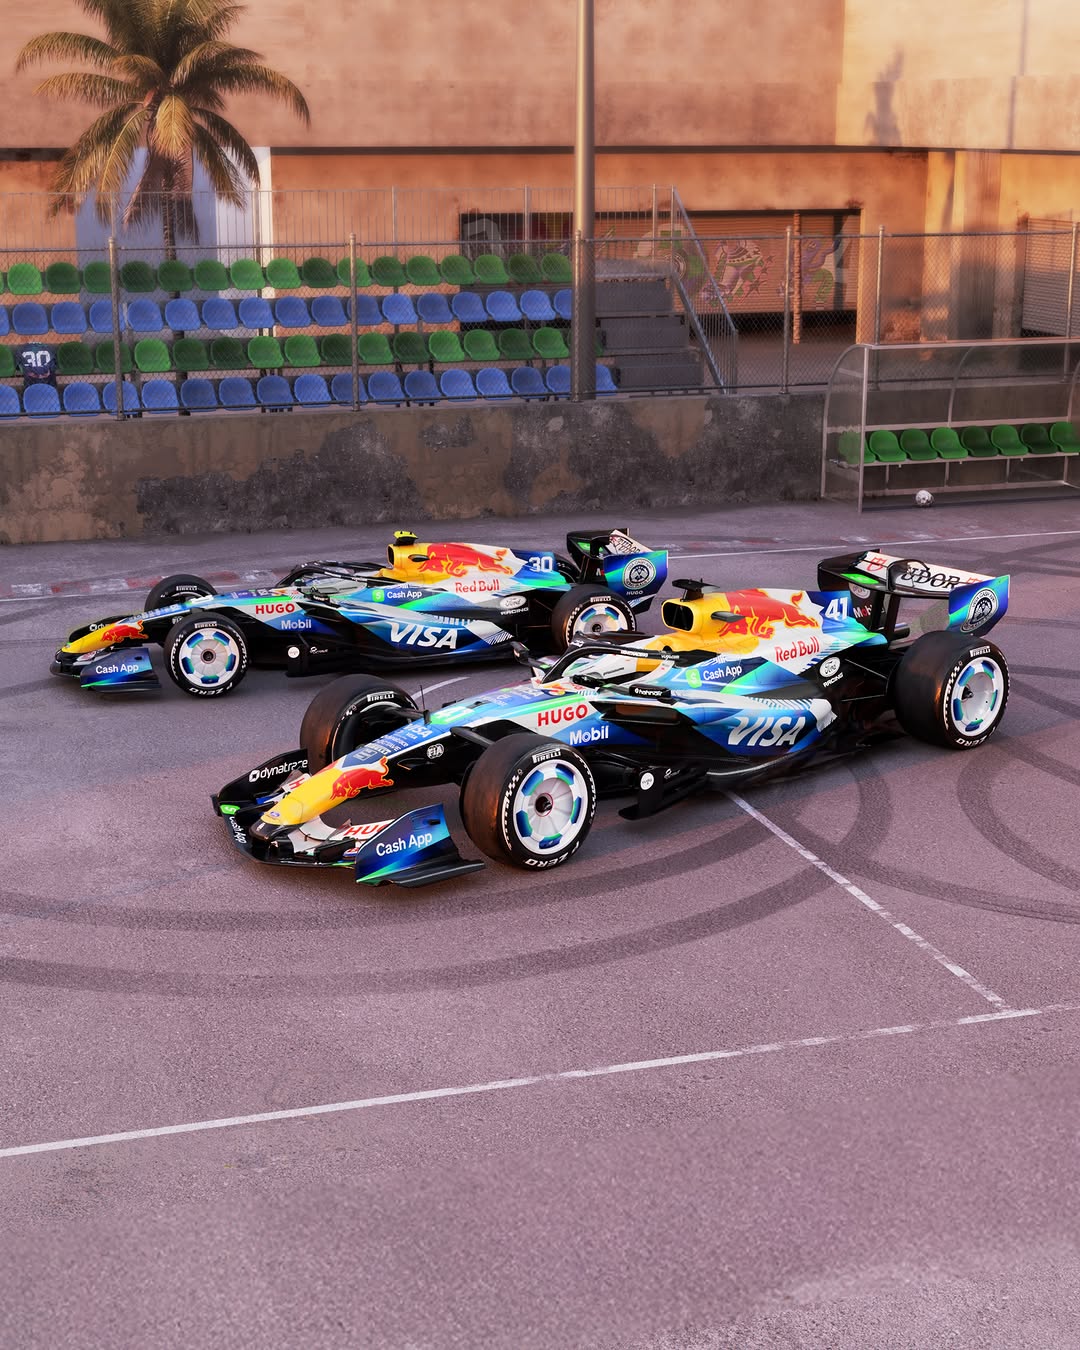 5.5M75.8×Two colorful F1 race cars@visacashapprb · Brand Showcase
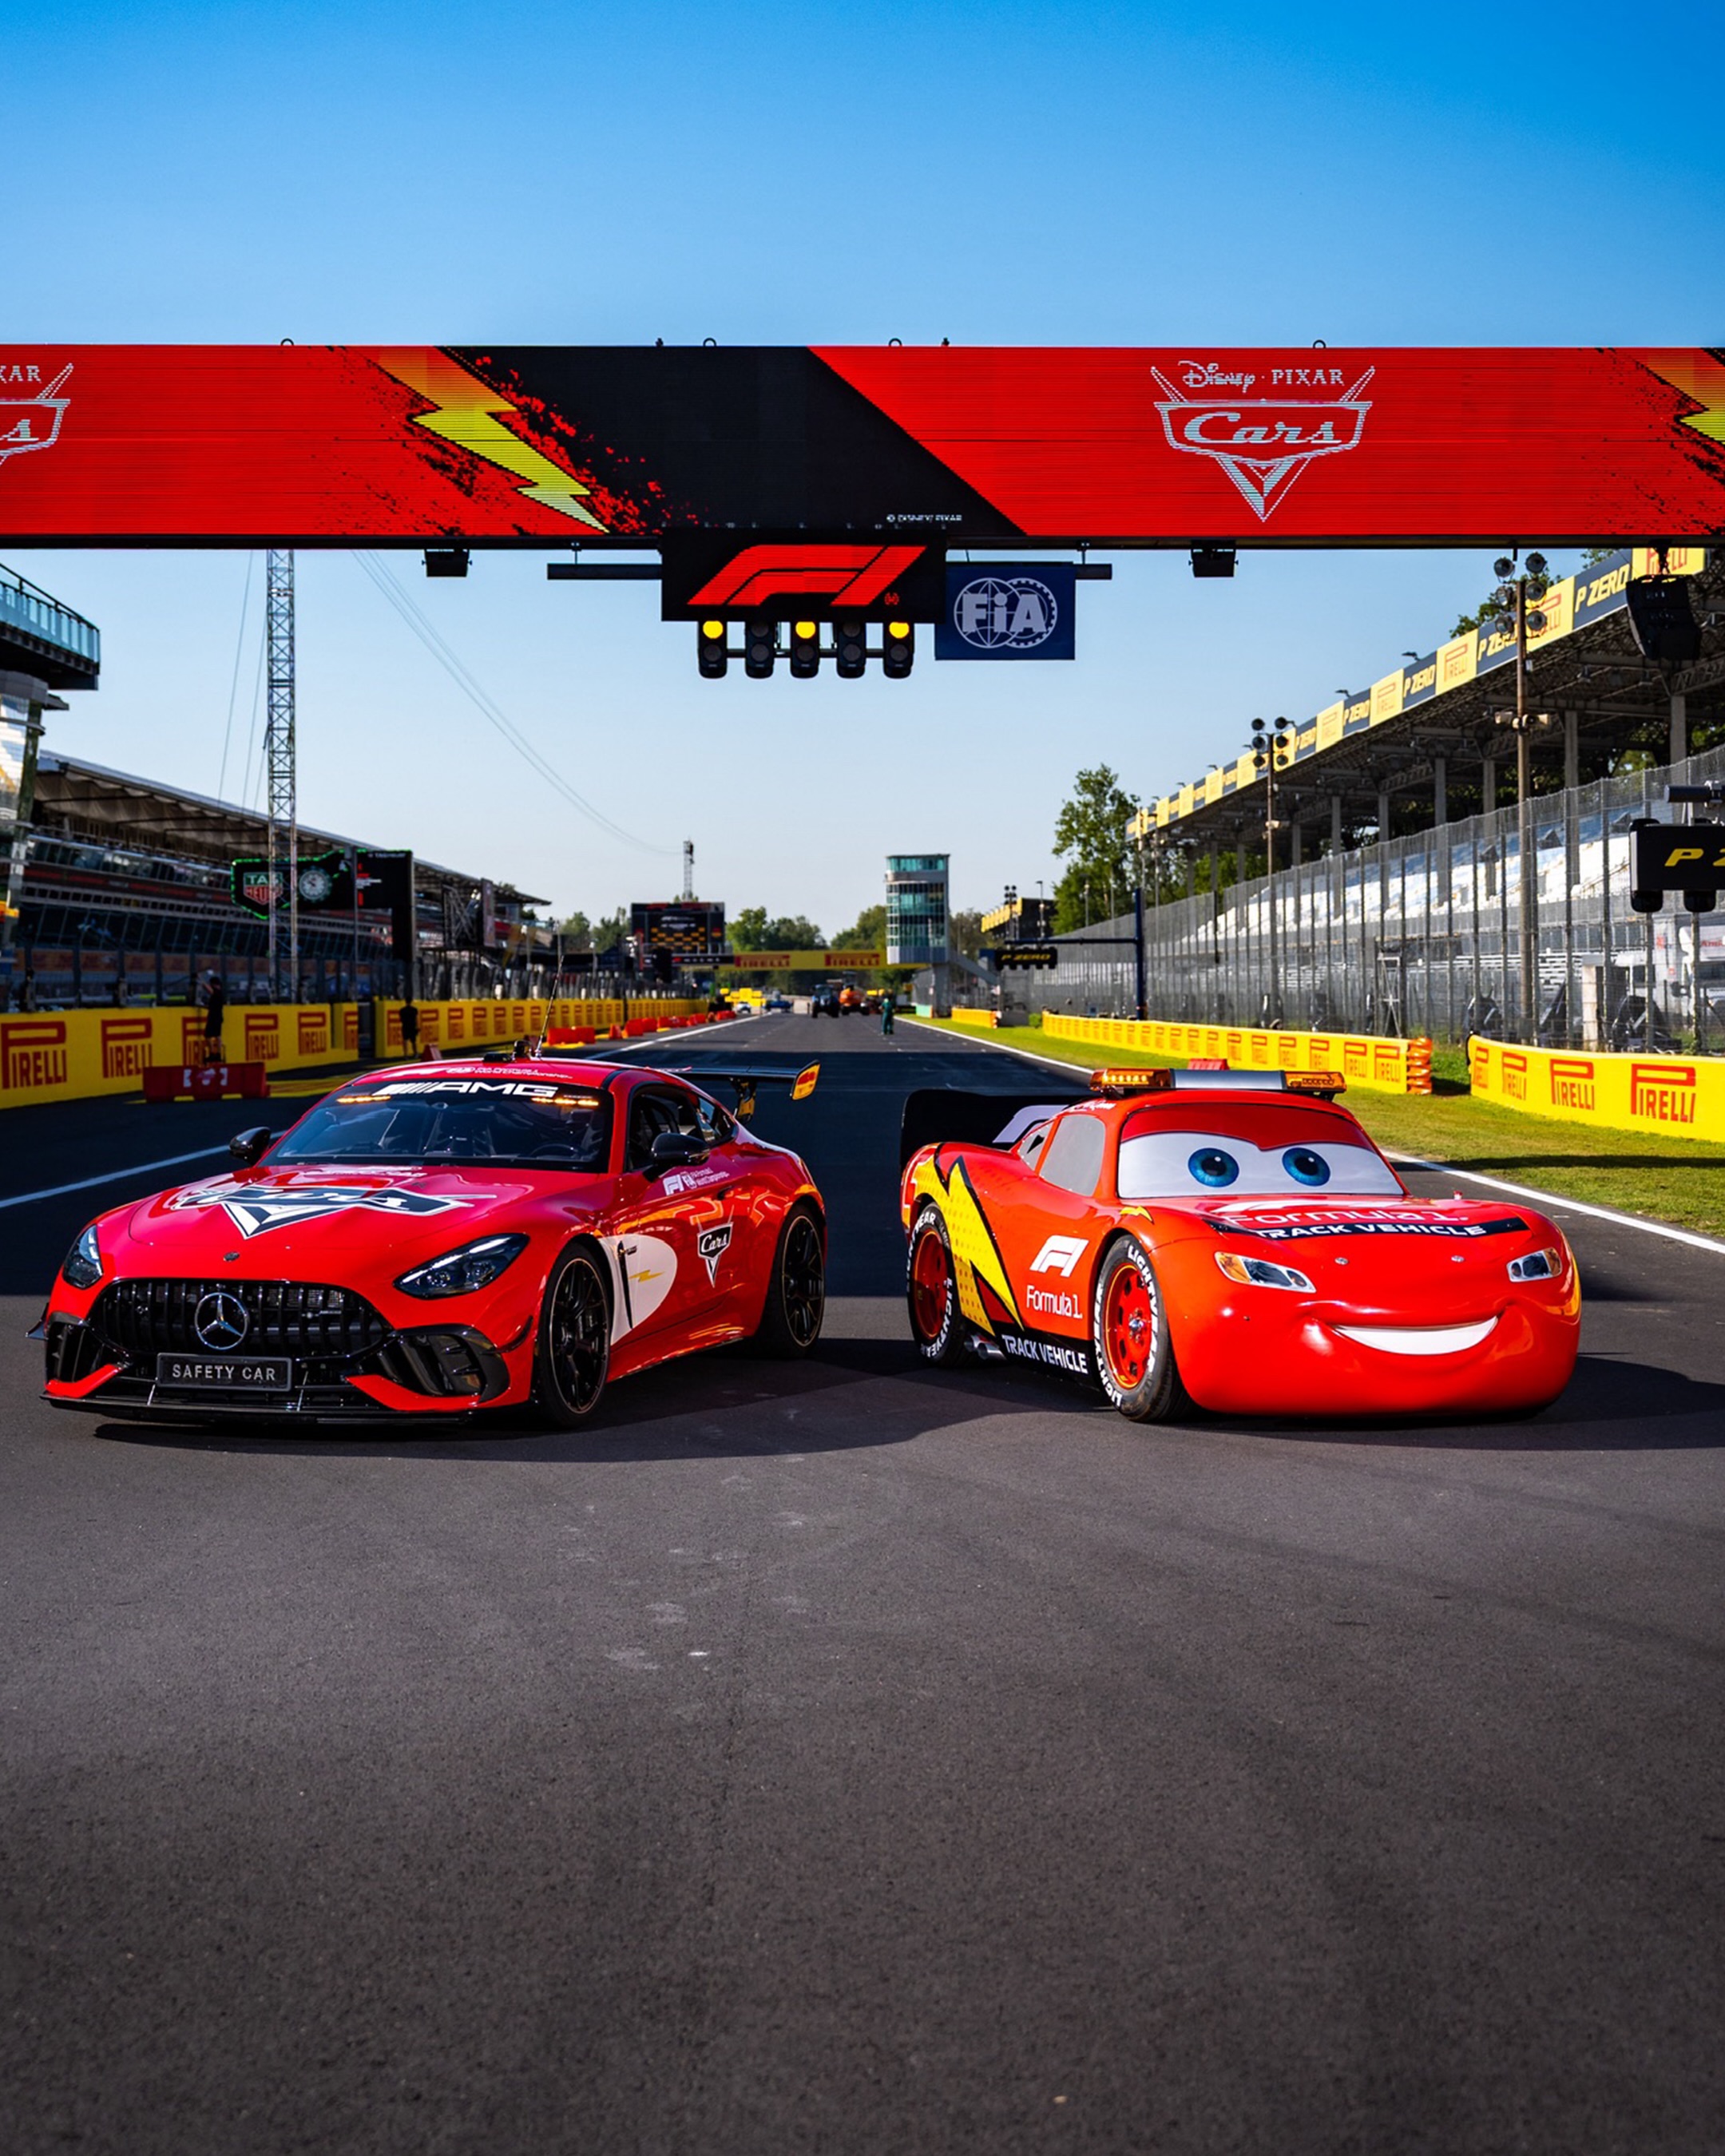 32.4M316×Lightning McQueen meets F1 Safety Car@f1 · Event Showcase
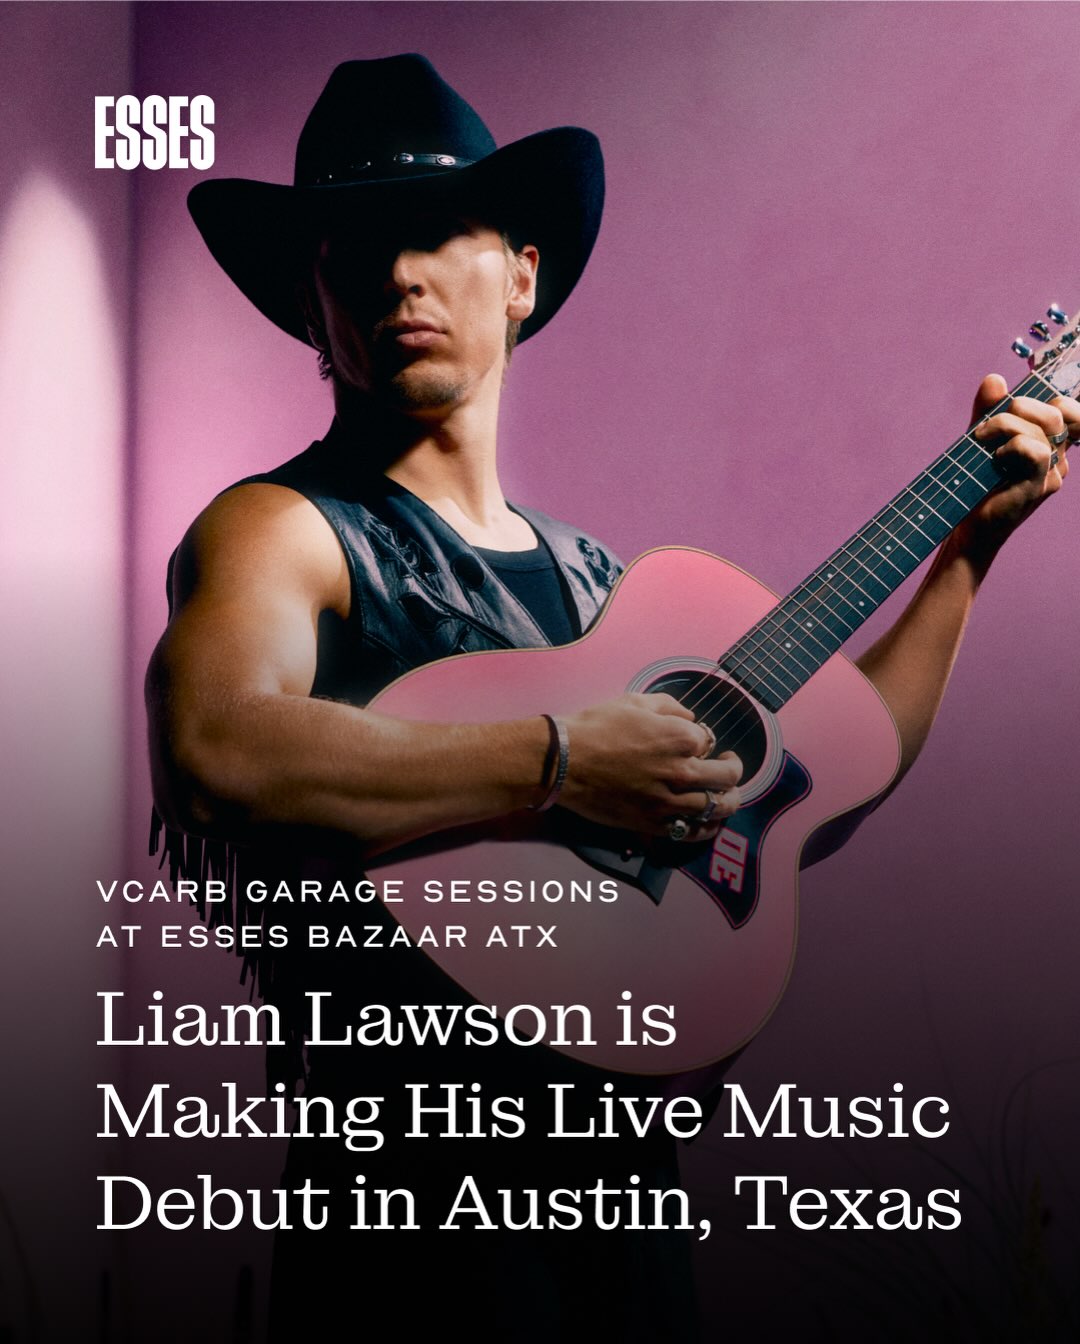 503.3K16.6×F1 driver's country music debut@essesmag · Editorial Carousel
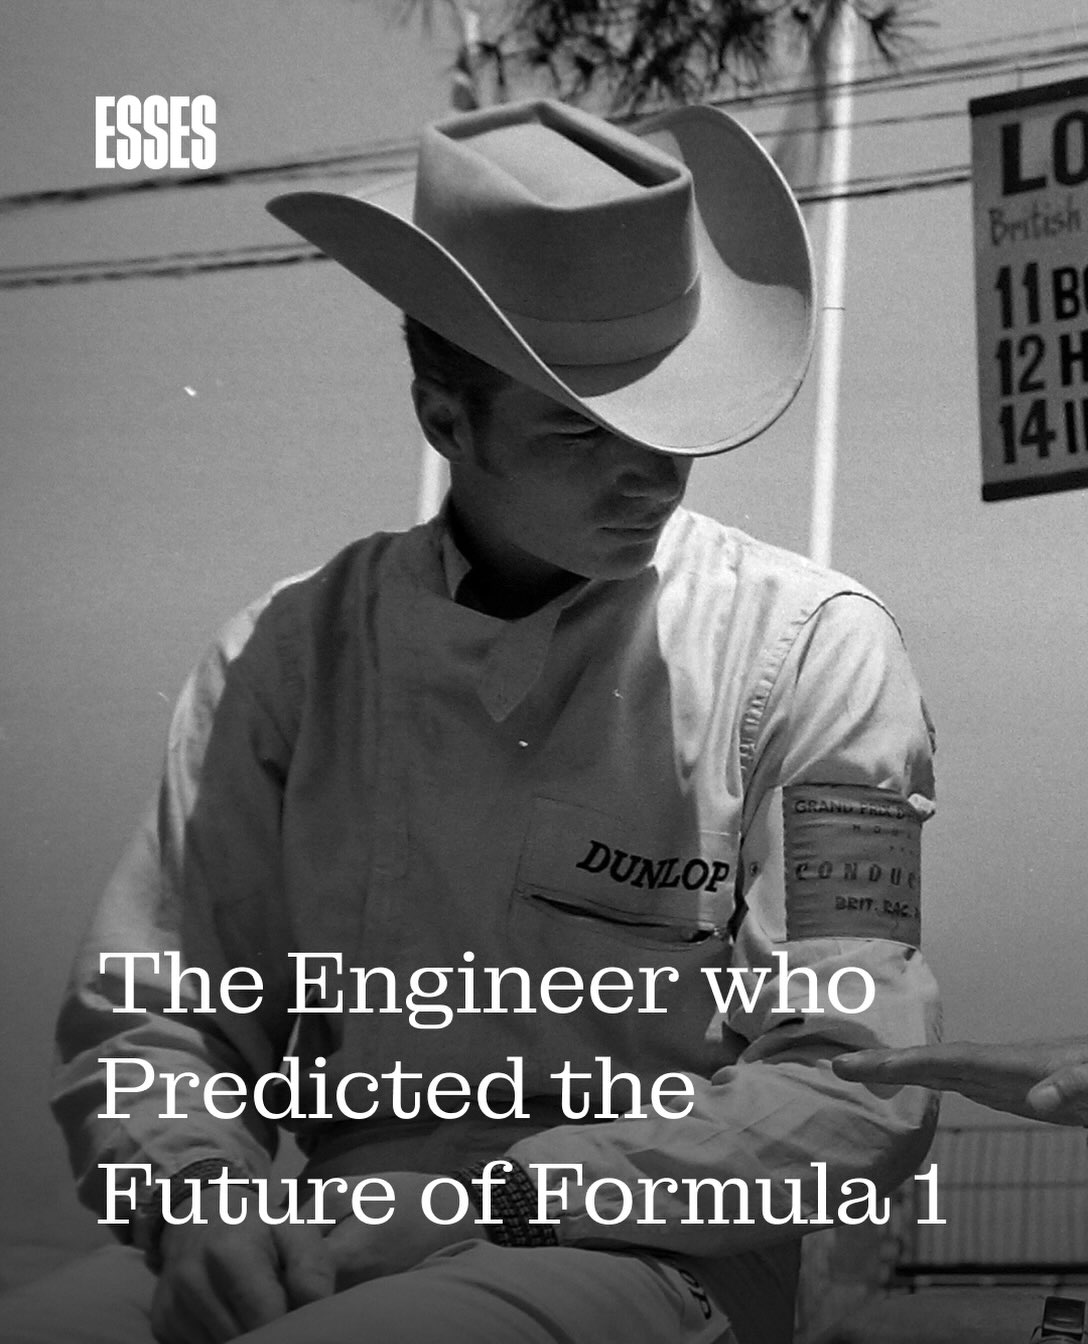 89.5K3×Vintage photo of F1 engineer@essesmag · Editorial Carousel
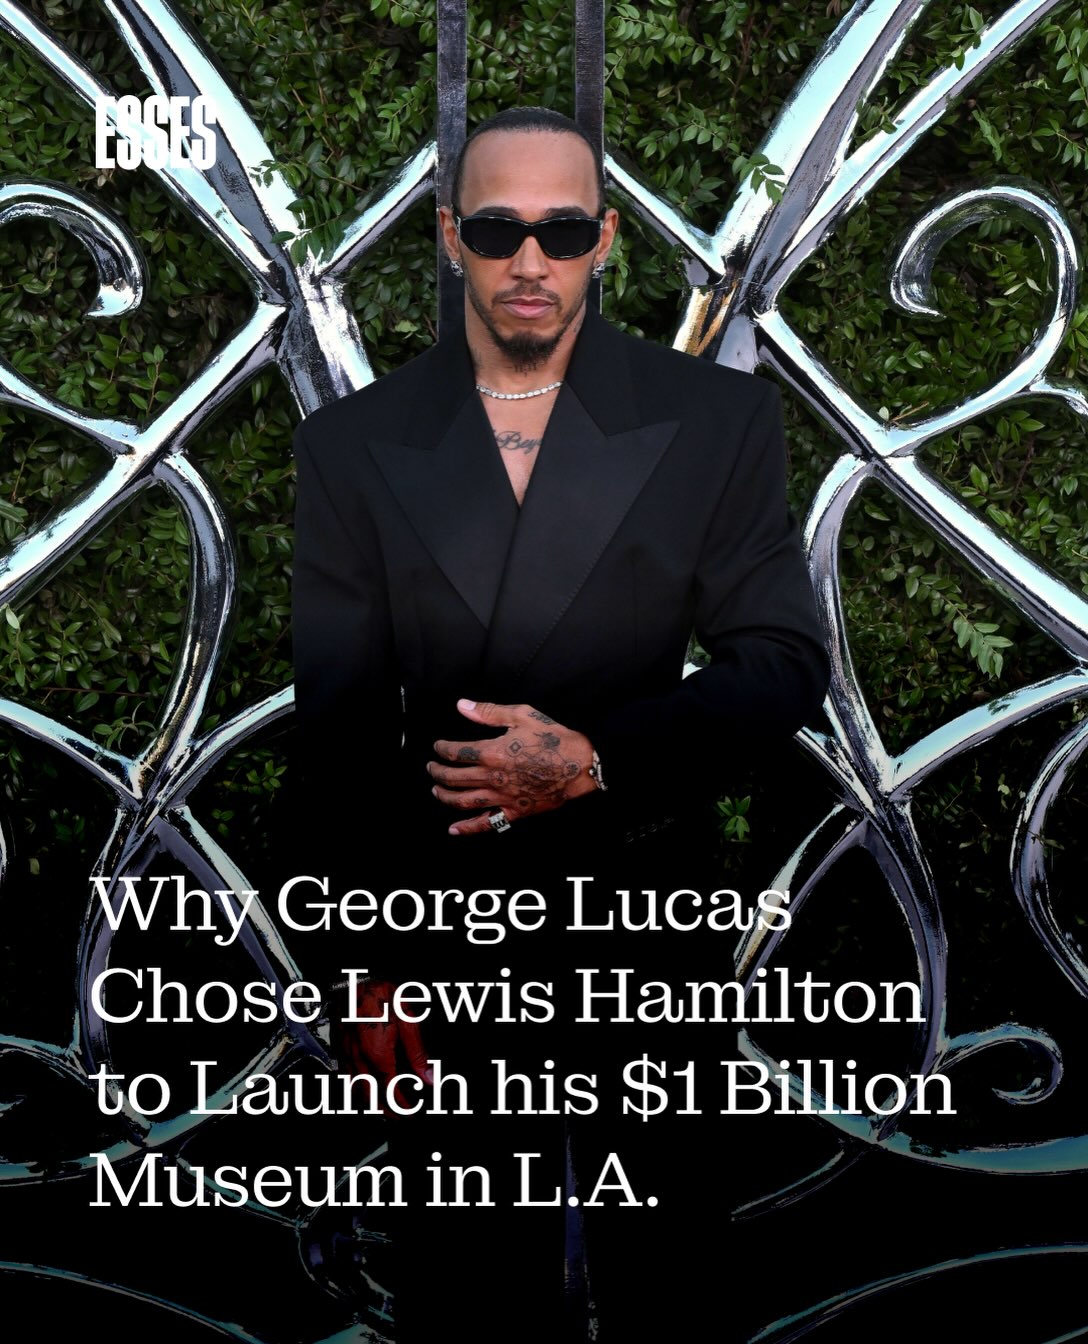 291.2K9.8×Lewis Hamilton celebrity news photo@essesmag · News Carousel
[04]
[05]
What stops the scroll in the first 3 seconds
Title hook · 55%
CONSECUTIVE GRAND PRIX POINTS FINISHES
Verbal hook · 15%
Impressing consistently 🤝
Visual hook · 30%
A split-screen layout combining a professional portrait of a driver with a bold, data-driven graphic panel. The driver's direct gaze and thumbs-up gesture create a personal connection, while the clean graphic design makes the performance stats easy to digest.
[07]
The promise the opener makes, and how the video pays it back
Hook
The graphic is bifurcated. The left side uses a strong portrait to create a human connection with the subject. The top right introduces the subject's name and a bold headline ('CONSECUTIVE GRAND PRIX POINTS FINISHES') that frames the data to follow, establishing the core premise.
Payoff
The cumulative effect of the stacked data provides a powerful, at-a-glance validation of the subject's success. The viewer leaves with a single, strong impression of high performance without needing to swipe.
[08]
The structural pattern this video runs on
Framework
The Single-Pane Stat Sheet
To deliver a powerful, data-backed narrative in a single, digestible graphic by pairing a compelling subject portrait with a vertically stacked, consistently formatted list of achievements.
The Data Stack
A vertical list of individual data points that collectively prove the headline's claim. The visual repetition of the data blocks creates a rhythm and reinforces the consistency of the achievement, making the information easy to scan and absorb.
Impressing consistently 🤝 What a run of consecutive of Grand Prix points finishes from rookie @arvid.lindblad 🤩 #F1 #Formula1 #BelgianGP @visacashapprb
informational · photo_0
ARVID LINDBLAD
title · photo_0
CONSECUTIVE GRAND PRIX POINTS FINISHES
informational · photo_0
MONACO P7
informational · photo_0
BARCELONA P9
informational · photo_0
AUSTRIA P10
informational · photo_0
GREAT BRITAIN P7
informational · photo_0
BELGIUM P9
branding · photo_0
F1