@brodyautomates
Instagram · Speaker address
@brodyautomates This automation basically guarantees a girlfriend #n8n

@brodyautomates
Instagram · Speaker address
@brodyautomates This automation basically guarantees a girlfriend #n8n
Performance
Video #9128 · Speaker address
[01]
The creator presents a detailed case study of his automated dating campaign. He walks through the entire funnel, from lead scraping and qualification to message delivery, reply rates, and sentiment analysis, using on-screen data tables to support his points. He then provides a complete cost breakdown of the campaign and calculates key performance metrics like cost per lead and cost per date, concluding with his overall assessment of the results.
[02]
[03]
 208.1K1.9×Explaining a tech dating workflow@brodyautomates · Breakdown
 4.9M47.7×Data breakdown of dating experiment@maxxingwjett · Case Study Breakdown
 1.1M5.3×Creator shares dating experiment data@maxxingwjett · Performance Proof
 187.2K7.6×AI-powered direct mail sales playbook@angus.sewell · Playbook
 413.7K4×Data breakdown of dating experiment@maxxingwjett
 4M12.1×Creator shares data from DMing women.@maxxingwjett
 1.7M5.2×Dating experiment results with data@maxxingwjett · Performance Proof
 2.9M9.6×Creator shares data from dating experiment@maxxingwjett · Performance Proof
 1.7M12×Data breakdown of dating experiment@maxxingwjett · Performance Proof
 597.3K4.3×Creator shows dating experiment data@maxxingwjett · Performance Proof
 157.7K7.8×Build an AI-powered listening website@angus.sewell · Tutorial / How To
 4.1MCreator shares data from dating experiment@jettmp4 · Quest Recap
[04]
[05]
What stops the scroll in the first 3 seconds
Title hook · 55%
EVERYBODY'S RESULTS AUTOMATION. 10,000 PER HOUR
Verbal hook · 40%
Everybody's been asking me my results on my automation that sends 10,000 pickup lines per hour, so here it is.
Visual hook · 5%
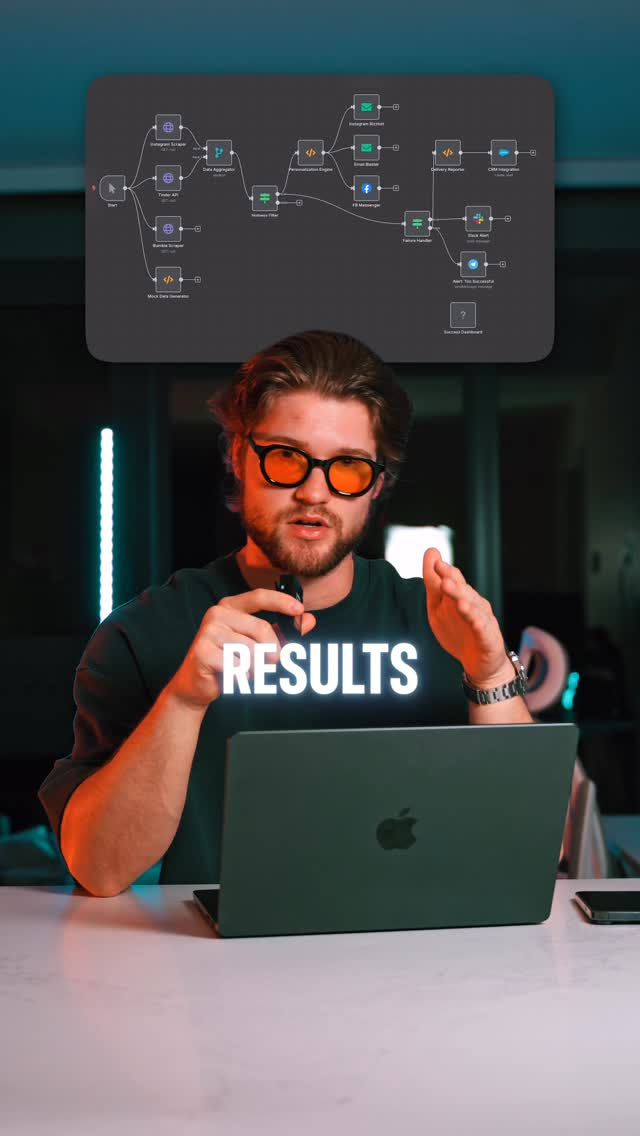
A man sits in front of a laptop with stylized teal and orange lighting, with a complex workflow diagram graphic floating above his head, establishing a tech-savvy and expert aesthetic.
[07]
The promise the opener makes, and how the video pays it back
Hook
Acknowledge audience curiosity about a previously mentioned high-concept project and promise a full, data-driven reveal of the results.
Payoff
The payoff is the final calculation of the 'Cost Per Outcome,' which serves as a definitive, easily digestible scorecard for the entire complex operation.
[08]
The structural pattern this video runs on
Framework
The Funnel Report
To present the results of a large-scale experiment by guiding the viewer through a data funnel, starting with a massive top-level number and progressively narrowing it down to the final outcome, while transparently revealing costs and key performance indicators.
The Scale Declaration
Establishes the massive scope of the experiment by presenting the largest top-of-funnel number first (e.g., total leads scraped), immediately capturing attention with the scale of the operation.
The Qualification Gauntlet
Begins the narrative funnel by showing how the initial large number was filtered down to a more qualified subset, often supported by a quick visual proof to substantiate the claim.
The Engagement Funnel
Continues the funnel by revealing the results of the first active step (e.g., messages sent vs. replies received), quantifying the initial engagement rate.
The Sentiment Verdict
Adds a layer of qualitative analysis by classifying the engagement into positive and negative outcomes, creating tension by revealing the high rate of failure.
The Anomaly Report
Injects personality and humor by highlighting unexpected, strange, or funny outlier results that don't fit the main categories, making the data-heavy narrative more entertaining.
The Conversion Payoff
Reveals the ultimate success metrics (the 'wins') that the entire process was designed to achieve, providing the answer to the core question posed by the experiment.
The Investment Reveal
Shifts focus from results to cost, transparently breaking down the total financial investment into specific, often surprising, line items. This builds credibility and adds a 'behind-the-scenes' feel.
The Unit Economics Summary
Distills the entire experiment into a simple, powerful conclusion by calculating the final cost per desired outcome, providing a clear measure of efficiency.
The Final Analysis
Provides a concluding subjective judgment on the project's overall success, acknowledging flaws or areas for improvement, and offering a final thought on the experiment's value.
This automation basically guarantees a girlfriend #n8n
title · beginning
EVERYBODY'S
title · beginning
RESULTS
title · beginning
AUTOMATION.
title · beginning
10,000
title · beginning
PER HOUR
informational · beginning
Metric: Total Profiles Scraped (Leads) Count: 532,151 Rate: 100%
informational · beginning
Passed "Hotness Filter" (Qualified) Count: 240,000 Rate: 45.10%
informational · middle
Total Outreach Attempts: 240,000 Delivered Messages: 235,200 (98.00%) Failed Messages: 4,800 (2.00%)
informational · middle
Total Replies: 7,056 (3.0% of Delivered)
informational · middle
Positive Sentiment: 428 (6.1% of Replies)
informational · middle
Negative Sentiment: 6,414 (90.9% of Replies)
informational · middle
Neutral Sentiment: 214 (3.0% of Replies)
informational · middle
Replies in Another Language: 42
informational · middle
Replies Threatening Legal Action: 64
informational · middle
Replies That Were Just "Unsubscribe": 211
informational · middle
Relative Incidents: 2
informational · middle
Total Dates Booked (Wins): 87 (20.3% of Positive Replies)
informational · end
Dates Attended: 51 (58.6% of Booked)
informational · end
No-Shows (Churn): 36 (41.4% of Booked)
informational · end
Second Dates Booked (Retention): 7 (13.7% of Attended)
informational · end
Total Campaign Cost: $8,700
informational · end
Total Campaign Cost: $8,700 Cost Per Lead (CPL): $0.02 Cost Per Reply (CPR): $1.23 Cost Per Date (CPD): $100.00
Everybody's been asking me my results on my automation that sends 10,000 pickup lines per hour, so here it is. I ran the campaign for fifty three hours, and there were a total of 532,000 leads scraped. Out of those, 45% passed the hotness filter, so 240,000. Scroll through the spreadsheet right now best so you can see. There are literal hundreds of thousands of leads in here. Total delivered messages were 235,200. Total replies were 7,056, so 3%. The rest just left me on red. The total positive replies were 428, and the total negative replies were 6,414, so 90.9%. And 214 of those were neutral. Now out of those replies, there were a few exceptions. 42 replied in a completely different language because this is worldwide. 64 replies threatened legal action. 211 just said unsubscribe. And there were two incidents where the chatbot started rizzing relatives. The total meetings or dates booked, I guess, was tier, so 20% of the positive replies. The total dates attended were tier, and 36 were no shows. So I just put them through the no show response. Let's talk about the cost breakdown. So the total campaign cost was $8,700 No the cost is a bit high. There was a bit of a unique situation where I needed to pay $5,000 to Tinder for an emergency API access no I didn't get sued. Also for the technology for the hotness filter, I needed to pay $2,500 for a consultant. Also, the premium proxies to make 240,000 messages look legal, costed me a thousand dollars. And then of worse, my CRM costed $200 as well. So from those results, the cost per lead is 2¢. Cost per reply is a dollar tier, and the cost per date is a $100. Overall, these are pretty good results except for the fact that I had to pay an extreme amount to Tinder. I think the bot could use a few improvements, but it's a good start.