@johnny.novo
Instagram · Vlog
@johnny.novo Top NYC Burgers🍔

@johnny.novo
Instagram · Vlog
@johnny.novo Top NYC Burgers🍔
Performance
Video #18839 · Vlog
[01]
The creator provides a mid-point summary of his ongoing series reviewing New York City burgers. He shares data points like the average price, lists his top three ranked burgers with scores, identifies the heaviest and lightest burgers, and names his favorite french fries, concluding with a call-to-action for more recommendations.
[02]
[03]
 332.9K3×Data-driven NYC burger review series@johnny.novo · Review
 293.8K60.7×Rapid fire NYC burger countdown@brotherlyburgers · Rapid Fire Listicle
 274.4K2.5×NYC burger review series installment@johnny.novo · Review
 321.7K8.8×Creator ranks top ten NYC burgers@johnny.novo · Rapid Fire Listicle
 245.6KRapid-fire top 10 burger ranking@brotherlyburgers · Rapid Fire Listicle
 237.4K19.8×Ranking a local NYC burger@brotherlyburgers · Local Business Guide
 455.6K4×Creator reviews a NYC burger@johnny.novo · Review
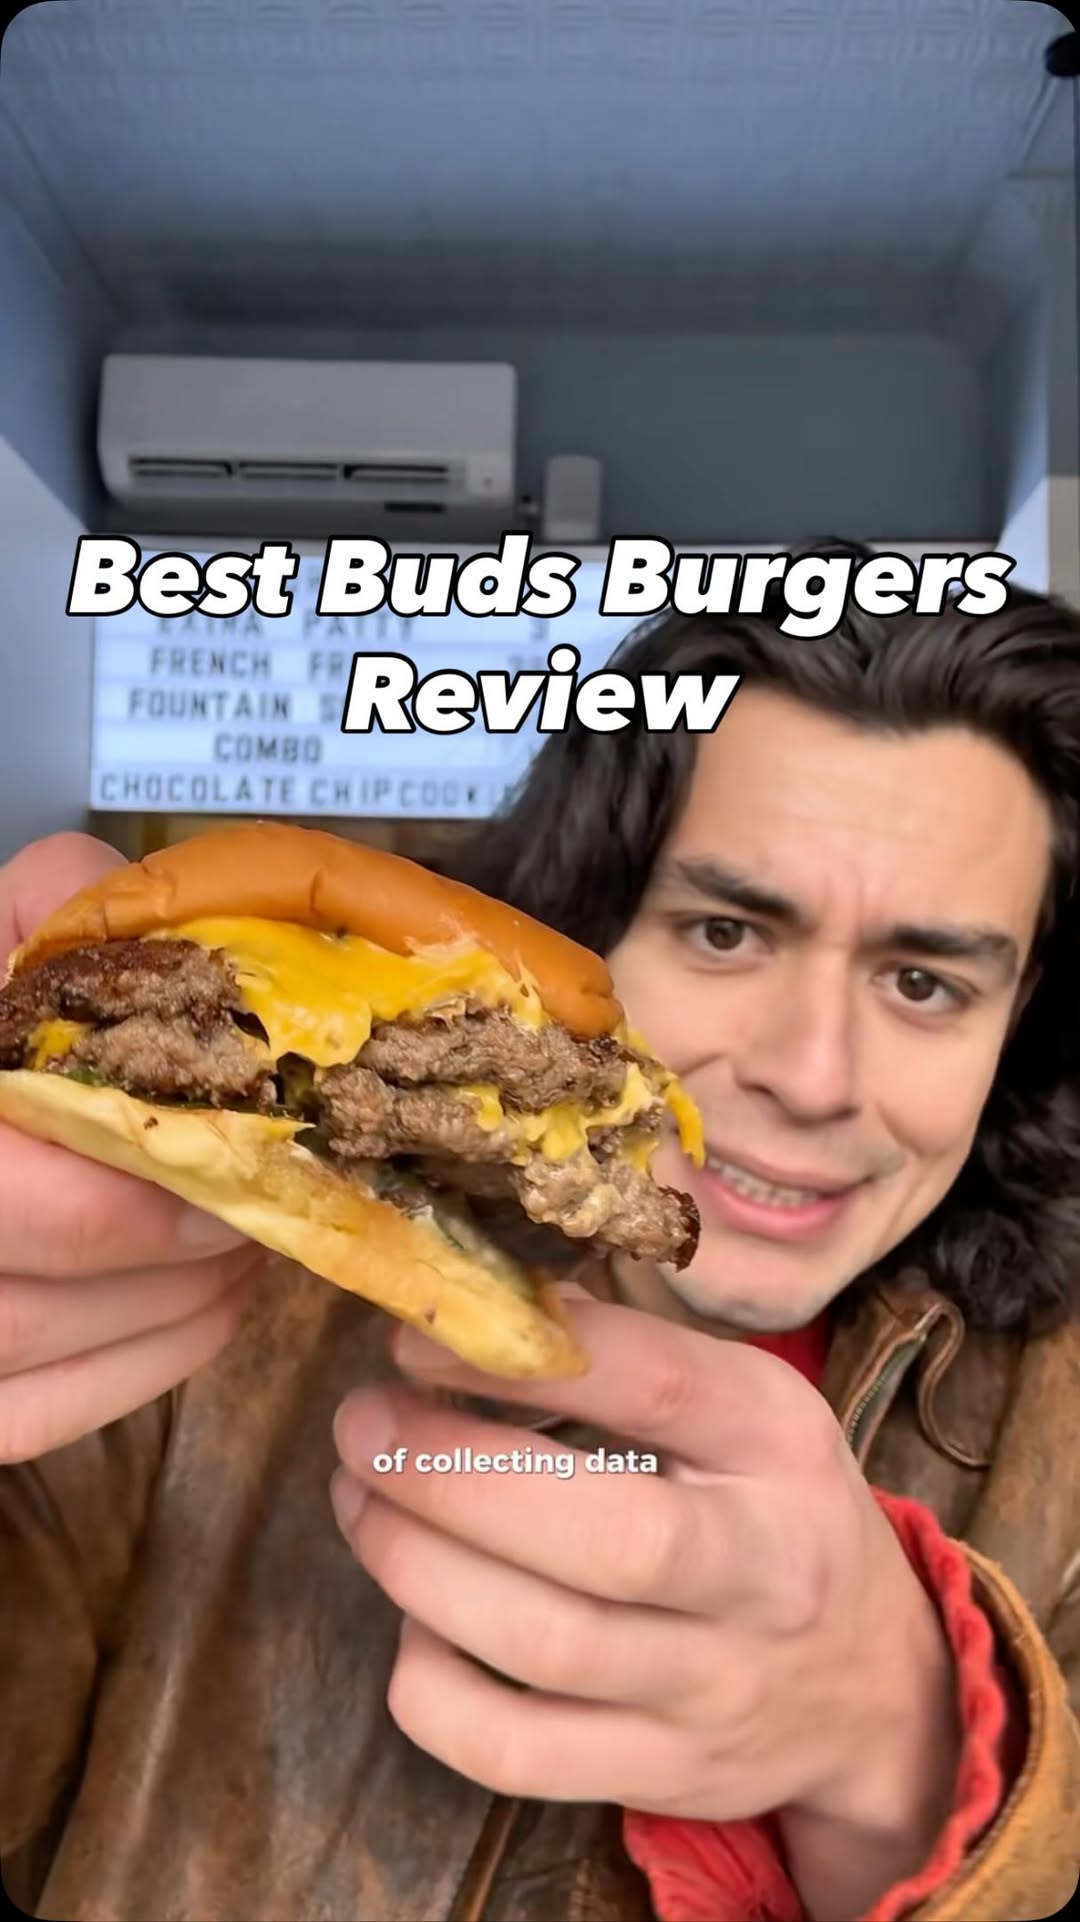 669.6K13.8×Data driven local burger review@johnny.novo · Journey Documentation
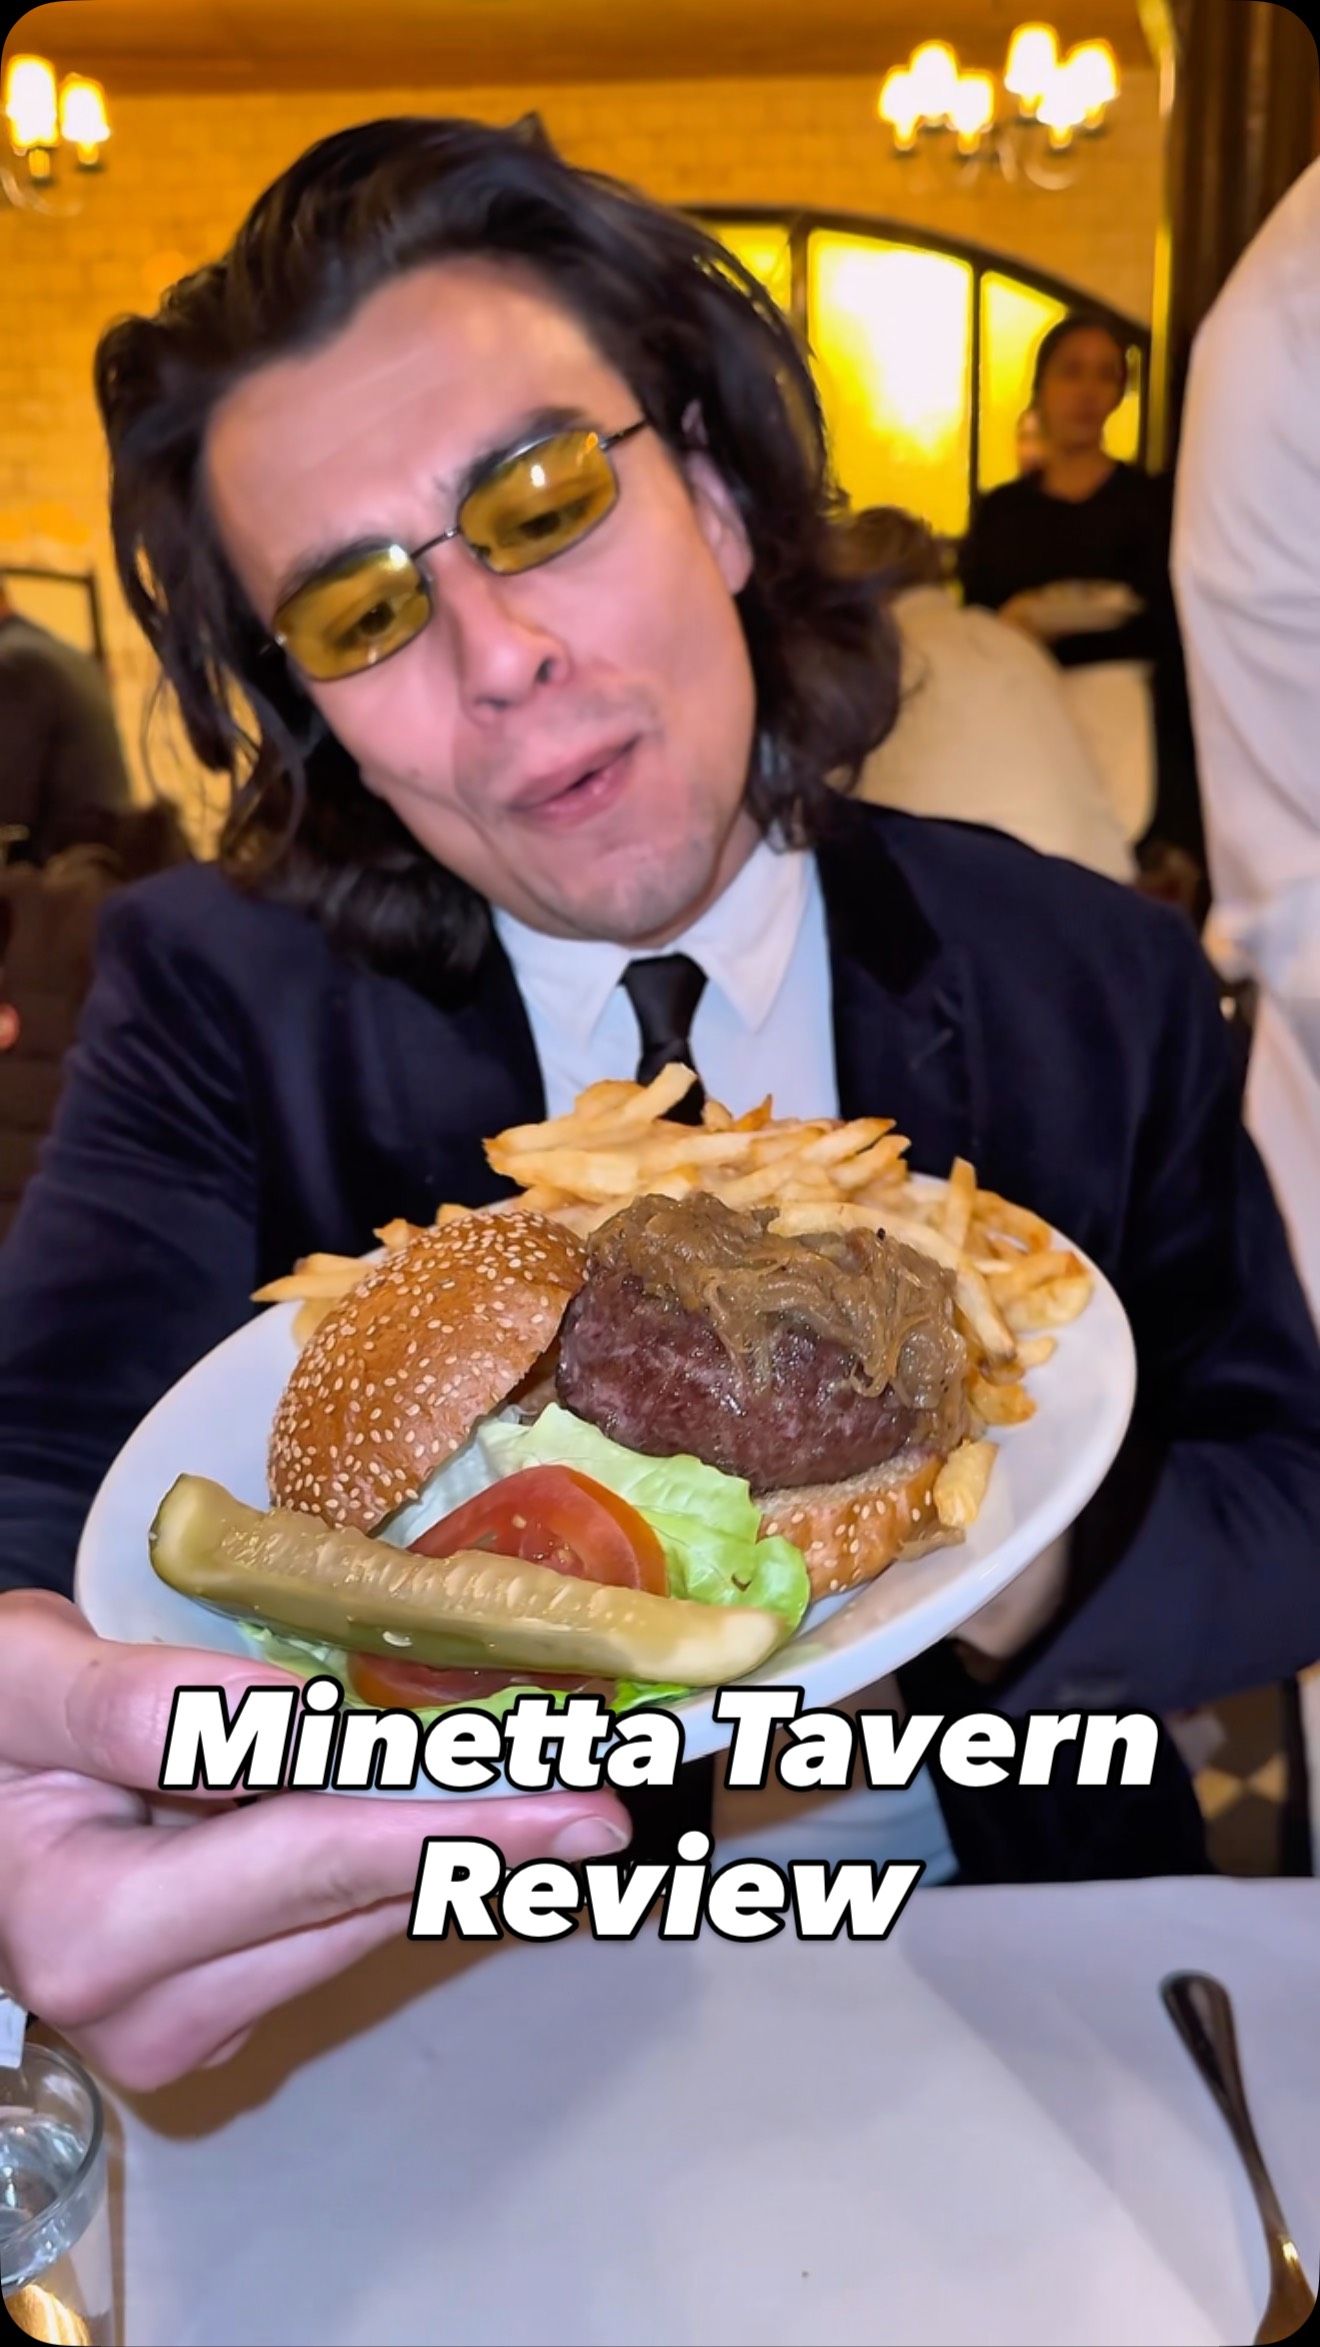 315.6K2.9×Data-driven NYC burger review series@johnny.novo · Journey Documentation
 139.5K12.9×Reviewing NYC burgers with score@brotherlyburgers · Review
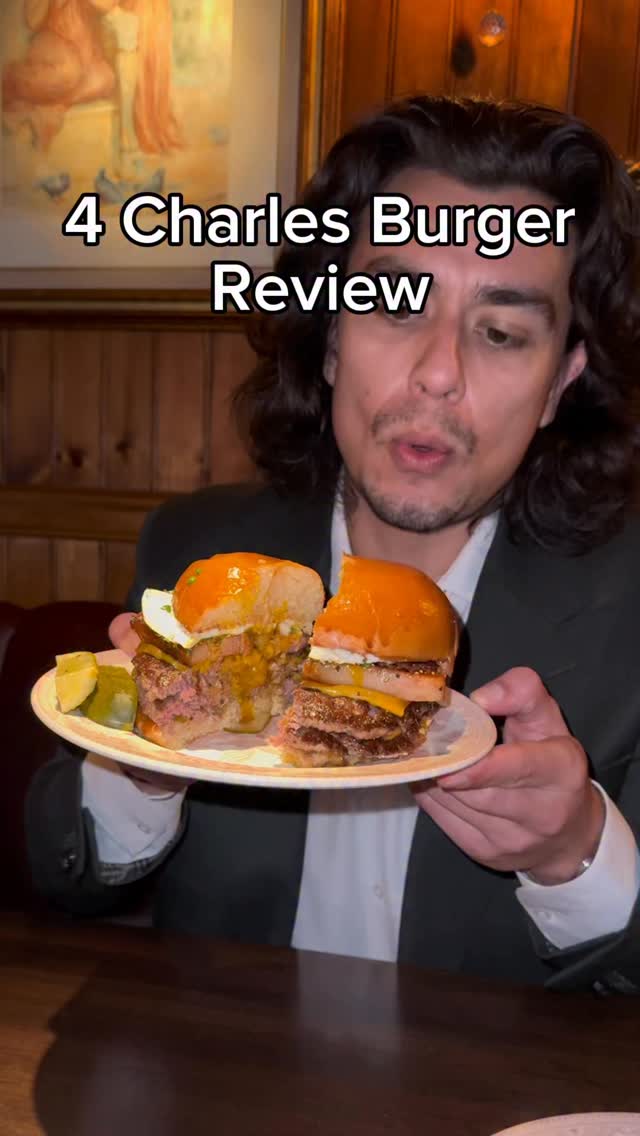 178.5K3.7×Voiceover food review and ranking@johnny.novo · Expert Rate/Rank
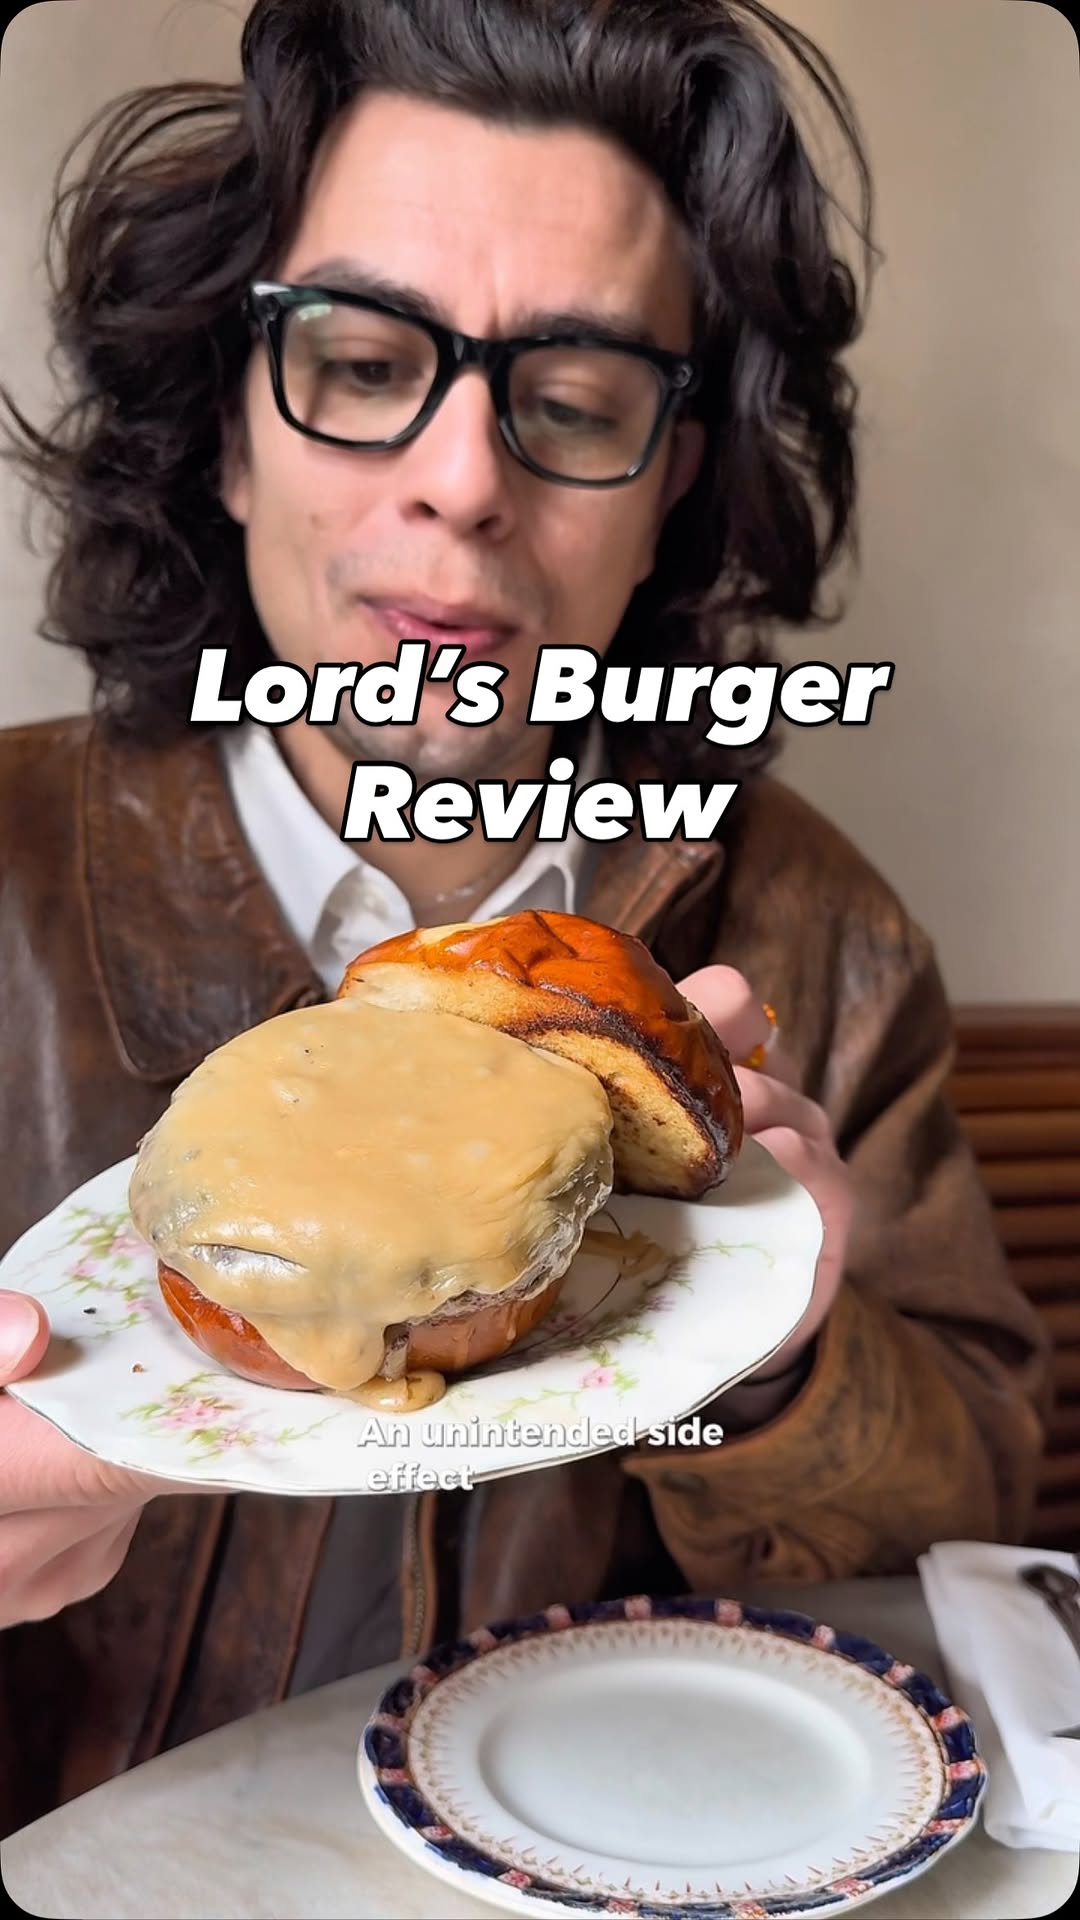 235.4K4.9×Detailed NYC burger and food review@johnny.novo · Review
[04]
[05]
What stops the scroll in the first 3 seconds
Title hook · 35%
Top NYC Burgers
Verbal hook · 45%
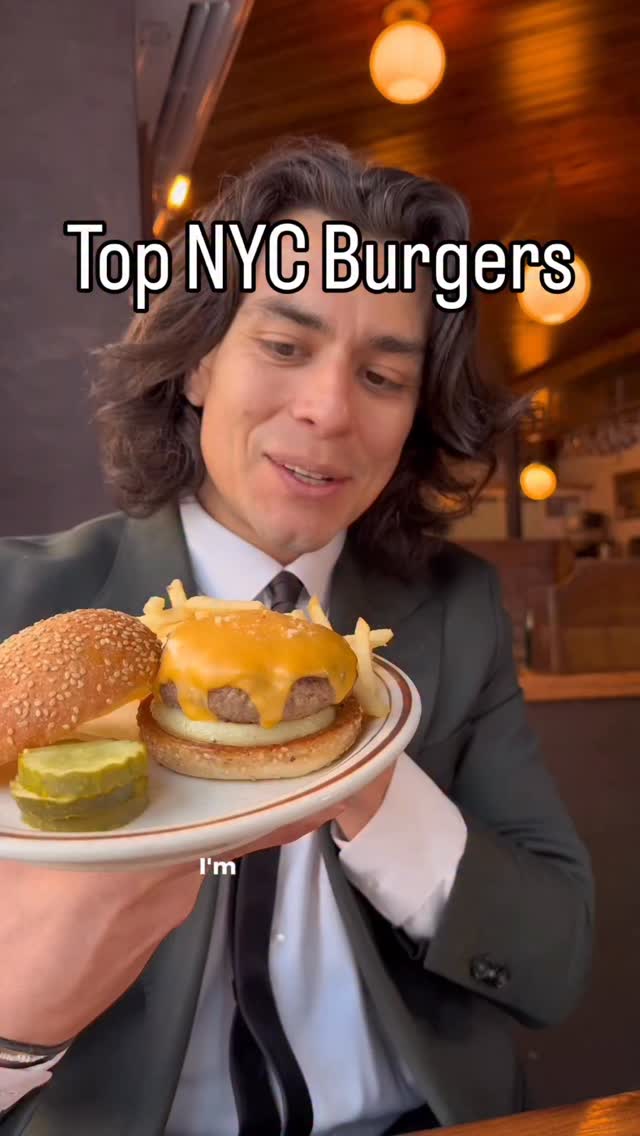
I'm halfway through this New York City burger series and here are my findings thus far.
Visual hook · 20%
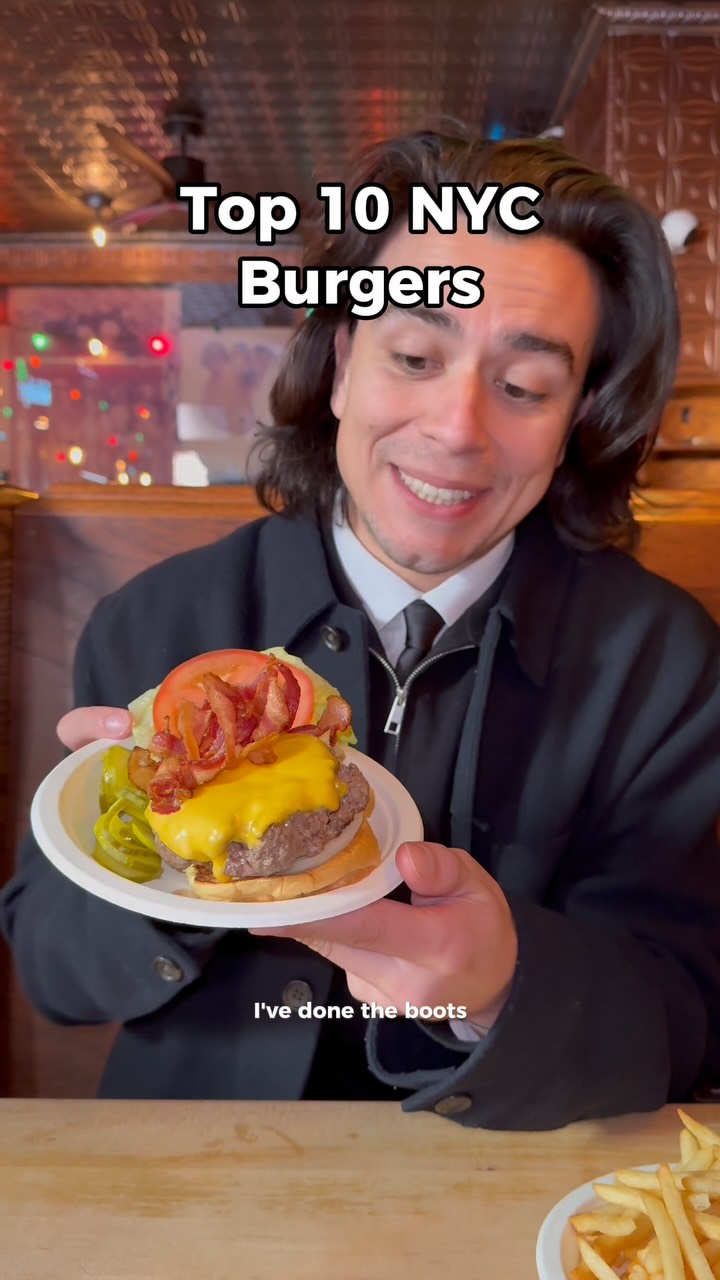
A man in a suit holds up a plate with a perfectly assembled cheeseburger and fries, looking directly at the camera as if about to eat.
[07]
The promise the opener makes, and how the video pays it back
Hook
The Mid-Point Declaration. Announce that this is a progress report from a larger, ongoing project, immediately framing the content as a valuable summary of findings.
Payoff
The Call to Action & Engagement Loop. A multi-pronged closing that (1) asks the audience for input for future content, (2) directs them to an external resource for more detailed information, and (3) explicitly asks for a follow to close the loop.
[08]
The structural pattern this video runs on
Framework
The Data-Driven Mid-Report
Synthesizing and presenting a mix of subjective rankings and objective data points gathered from an ongoing project to establish authority and provide a comprehensive 'state of the union' update.
The Shocking Statistic Hook
Lead with a single, surprising, and often relatable data point (e.g., average cost, time spent) to grab attention and establish the stakes of the investigation.
The Subjective Ranking Countdown
Present a 'Top 3' list based on personal judgment, counting up from #3 to #1 to build suspense. The #1 spot receives the most detailed and emotional description, serving as the emotional climax.
The Personal Philosophy Statement
Briefly state a personal belief or standard related to the topic. This adds personality and serves as a natural transition to a new data category.
The Expectation vs. Reality Check
Present a statistic that confirms or subverts a common assumption about the topic, reinforcing the creator's role as an expert researcher.
The Superlative Showcase (Extremes)
Identify the items at the opposite ends of a data spectrum (e.g., biggest/smallest, most/least expensive, fastest/slowest). Presenting them back-to-back creates a satisfying contrast.
The Category Averages
Provide more granular, 'insider' data by breaking down averages across different sub-categories, appealing to a more dedicated audience segment and deepening authority.
The Ancillary Award
Give a 'best of' award for a secondary, but important, aspect of the items being reviewed (e.g., best packaging, best customer service, best side dish), demonstrating comprehensive analysis.
Top NYC Burgers🍔
title · beginning
Top NYC Burgers
informational · middle
3) Gotham/Nowon
informational · middle
2) Rolo's
informational · middle
1) Red Hook Tavern
Halfway through this New York City better series, and here are my findings thus far. The average price for a respectable burger and fries combo was a brutal $27.41, but welcome to New York City. My top three are Gotham Better and No One, tied at the three slot, scoring a 9.3 out of 10. Rolo's in Ridgewood, Queens at my number two scoring a 9.5, and Red Good Tavern high stepping into the end zone with a hard 10. That best frisbee gave me an out of body experience, and it had me looking in the mirror questioning if I've ever even had a burger before. I'm a believer that a tavern or gourmet type of burger should always come with fries. And so far, five out of 11 have come with papa's fritas, which is honestly more than I thought. The heaviest burger so far has been Al Cheval at 16 ounces flat, but also was the most expensive at $36.47 with tier side of fries being $13.99. The flyweight belt holder for the lightest burger is 7th Street at 7.4 ounces, but it's also the cheapest at $9.50. The average weight of a double smash burger is 9.4 ounces, while the average weight of a standard burger is 12.2. My favorite fries thus far have been brindle rooms with Virginia's being a close second. Please drop any recs on better spots for the back nine of this journey and head to johnnynovo.com for a full list of the rankings and dates, and follow me for more. Rank you so much, bro. That means a lot.