@dunkin
Instagram · Single Photo
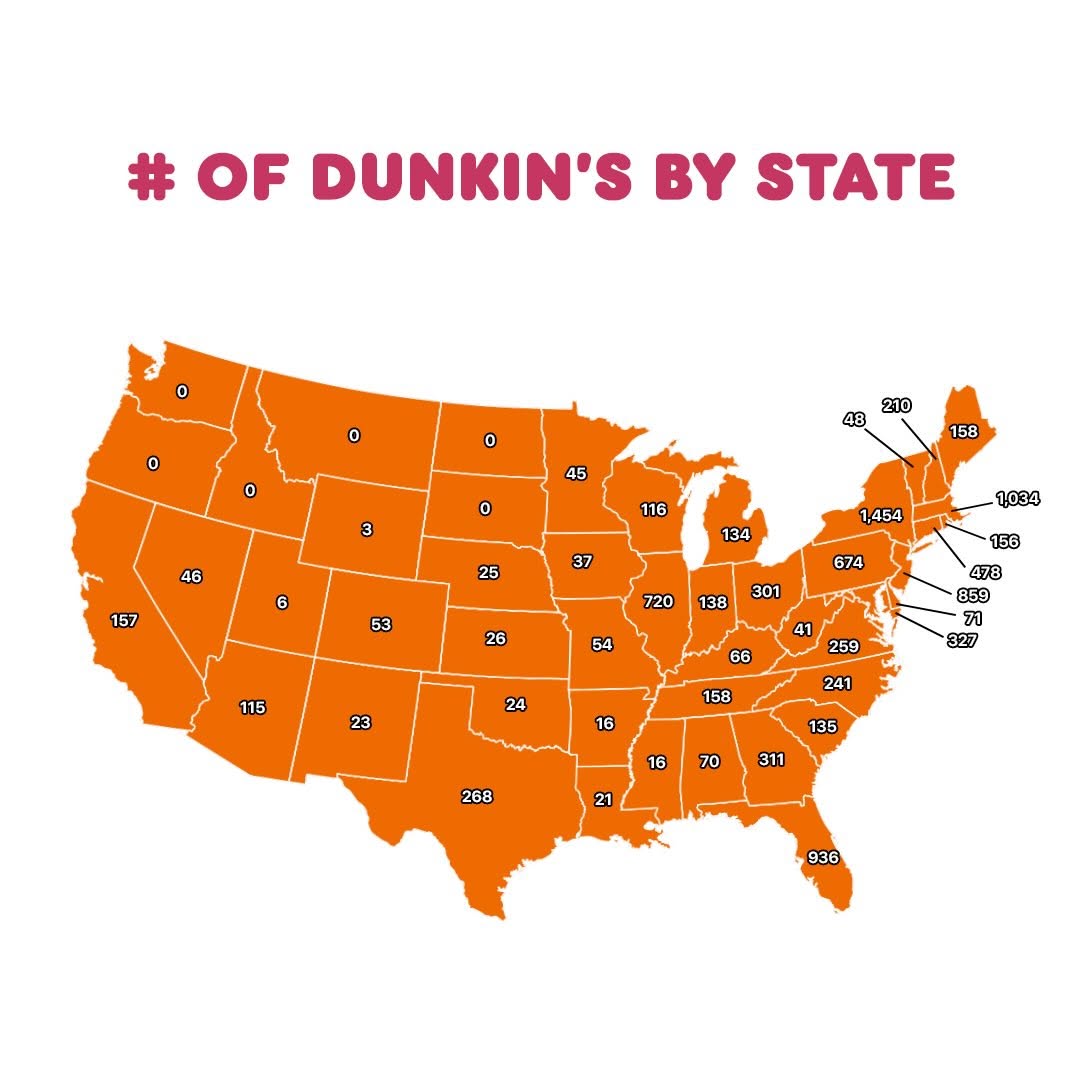
@dunkin me posting this at the corner of dunkin’ and dunkin’

@dunkin
Instagram · Single Photo
@dunkin me posting this at the corner of dunkin’ and dunkin’
Performance
Video #24345 · Single Photo
[01]
This is a single-image infographic that uses a map of the United States to visually represent the number of Dunkin' Donuts locations in each state. The purpose is to inform viewers about the brand's geographic distribution and highlight its heavy concentration in the Northeastern region.
[02]
[03]
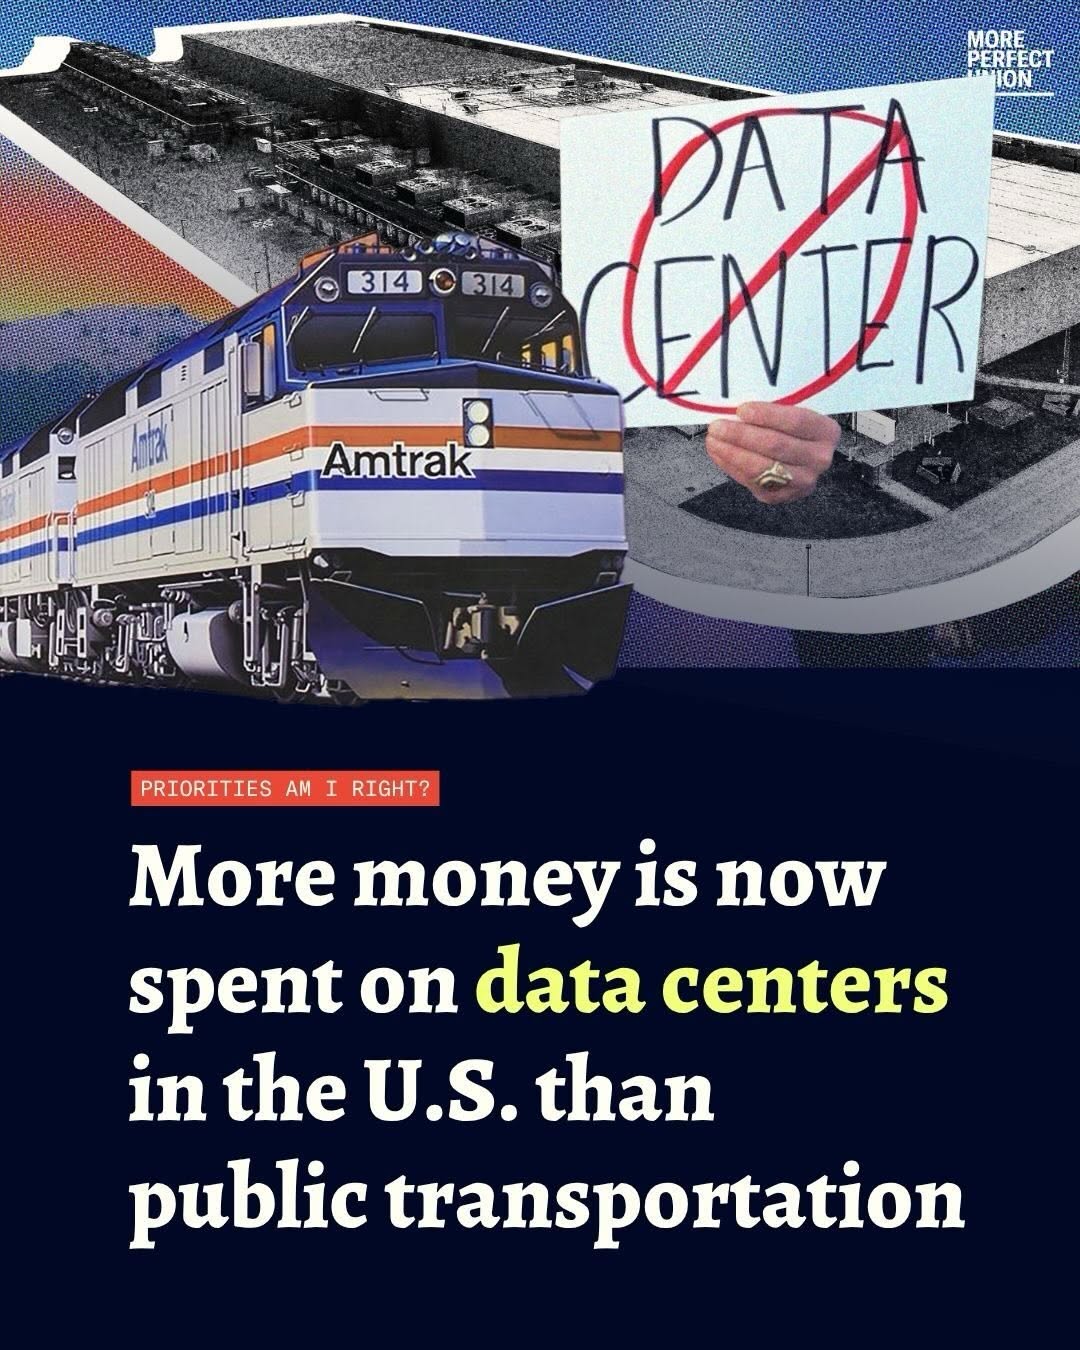 266.1K11.1×Data center vs public transport spending graphic@perfectunion · Statement Carousel
 154.7K1.3×Rapid fire list of places@nationalparksguide · Rapid Fire Listicle
 772.3K13.7×Giant duck building roadside attraction@nationalparksguide · Guide Carousel
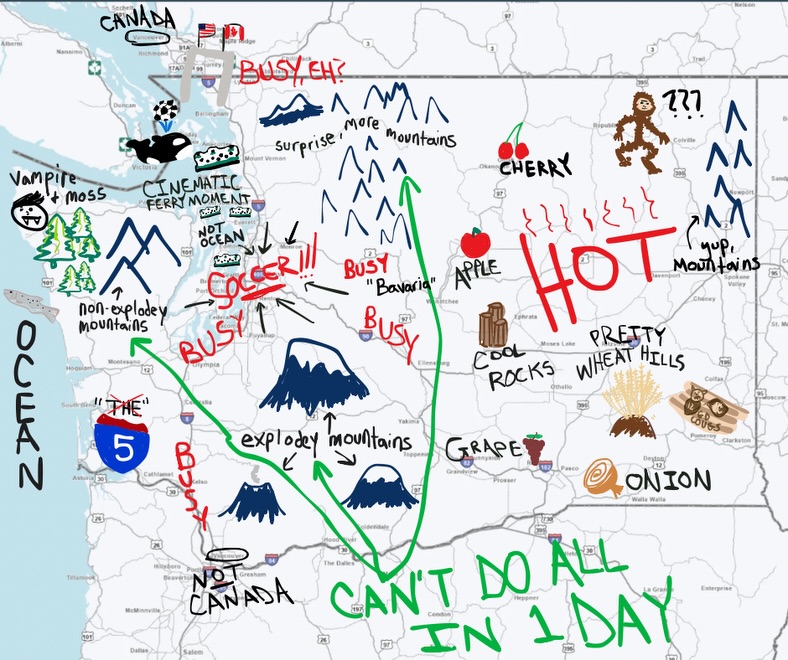 948.4K14.9×Funny hand-drawn annotated Washington map@wsdot · Public Service Announcement
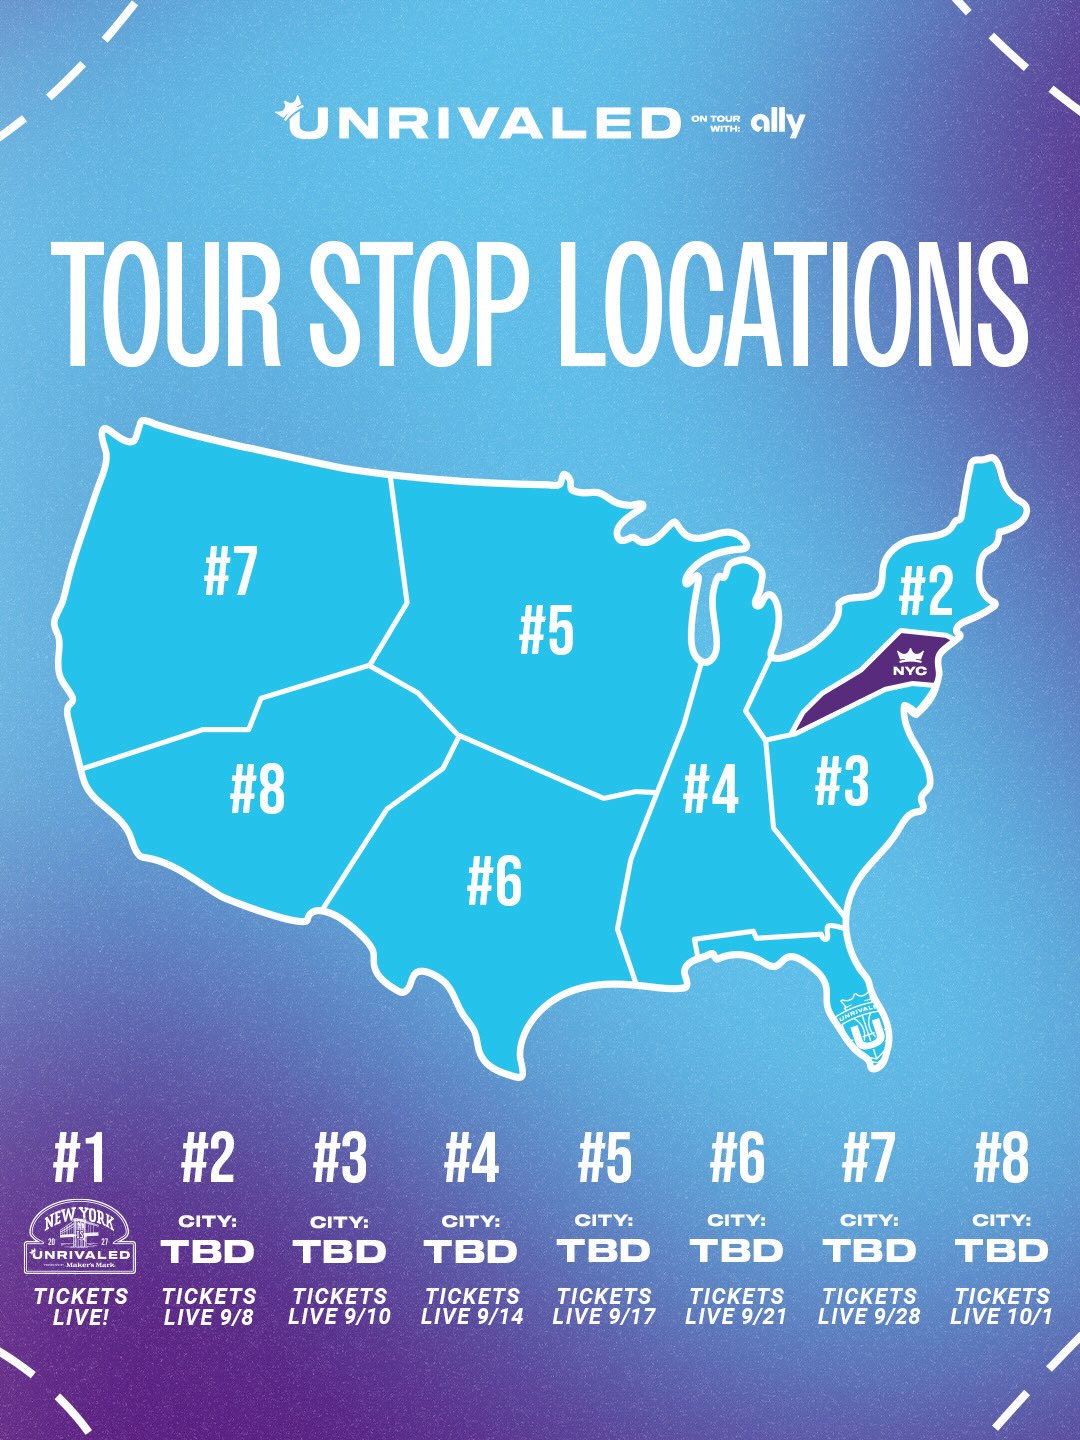 368.9K10.6×Promotional graphic for Unrivaled tour@unrivaledbasketball · Hype Teaser
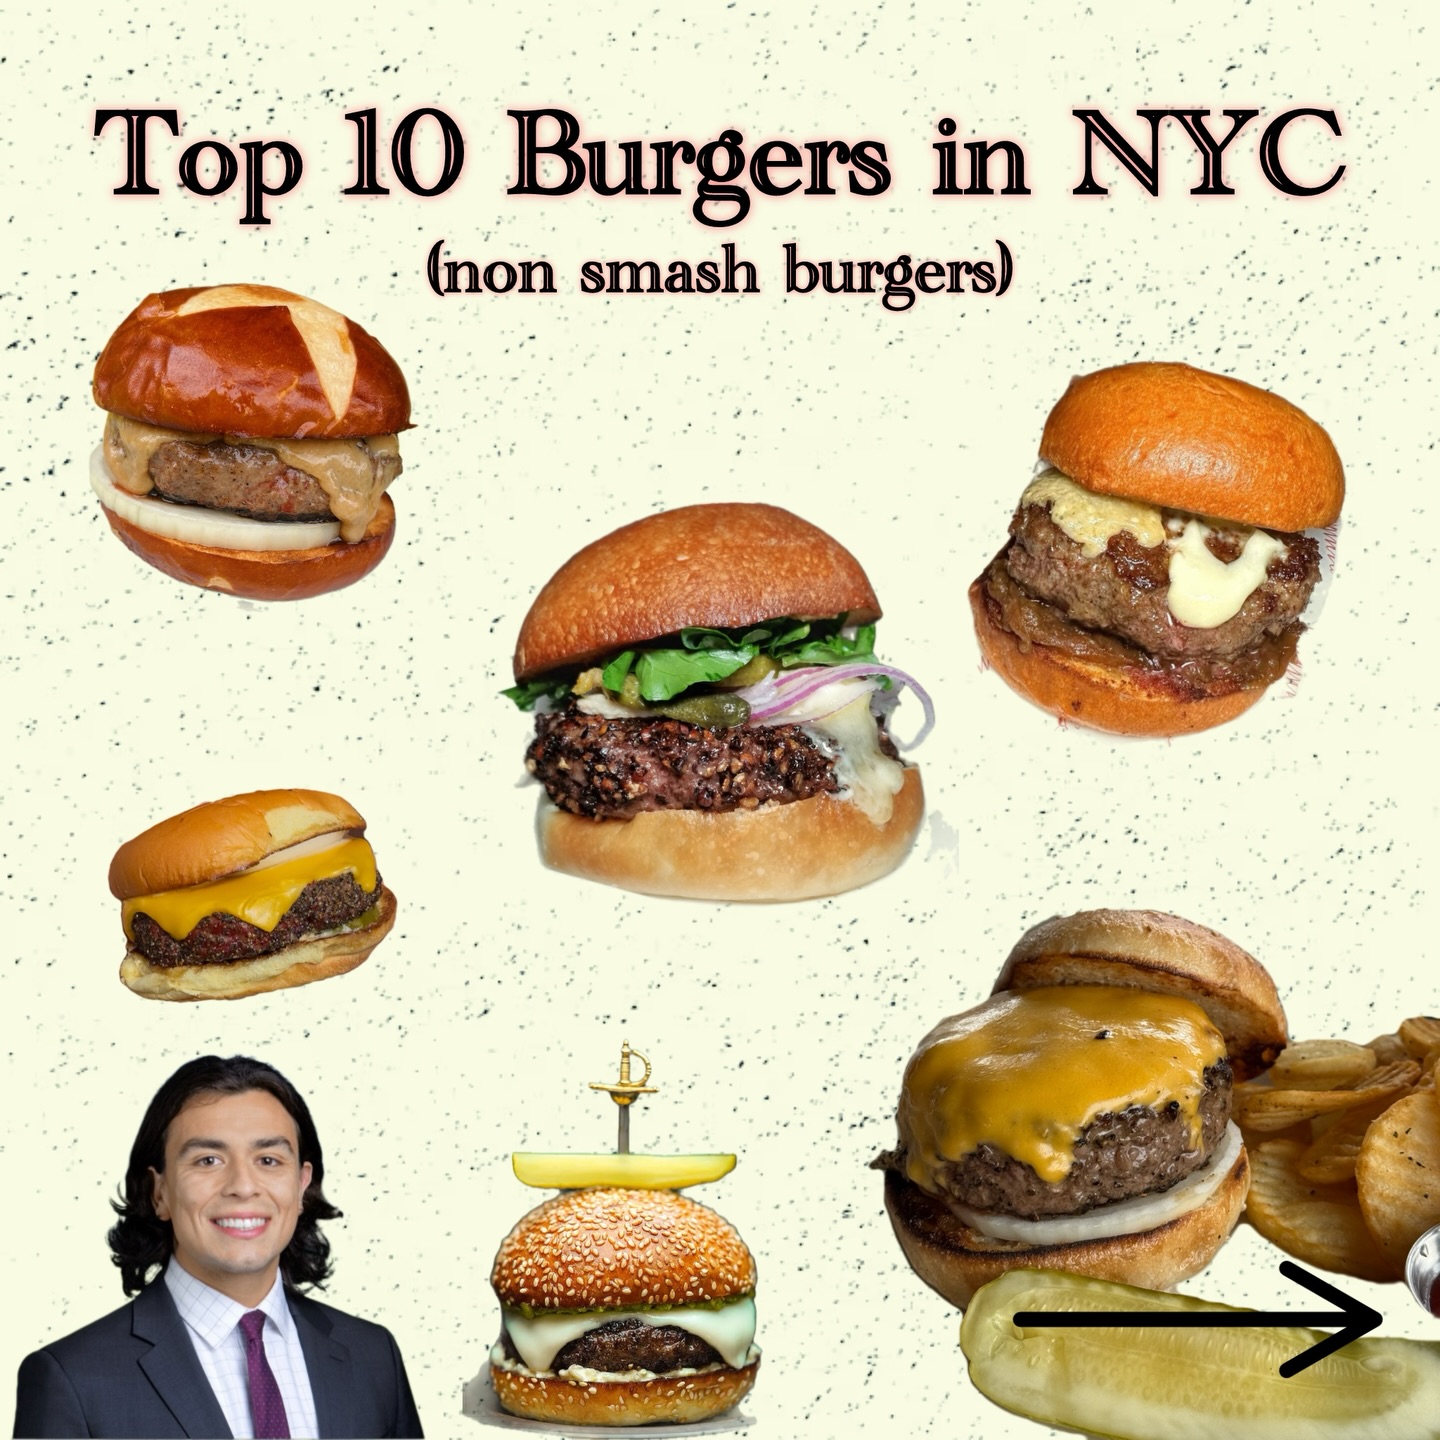 172K5.1×NYC top 10 burger guide collage@johnny.novo · Expert Rate/Rank
 681K13.8×Mapping data centers near schools@yoonj_kim · Breakdown
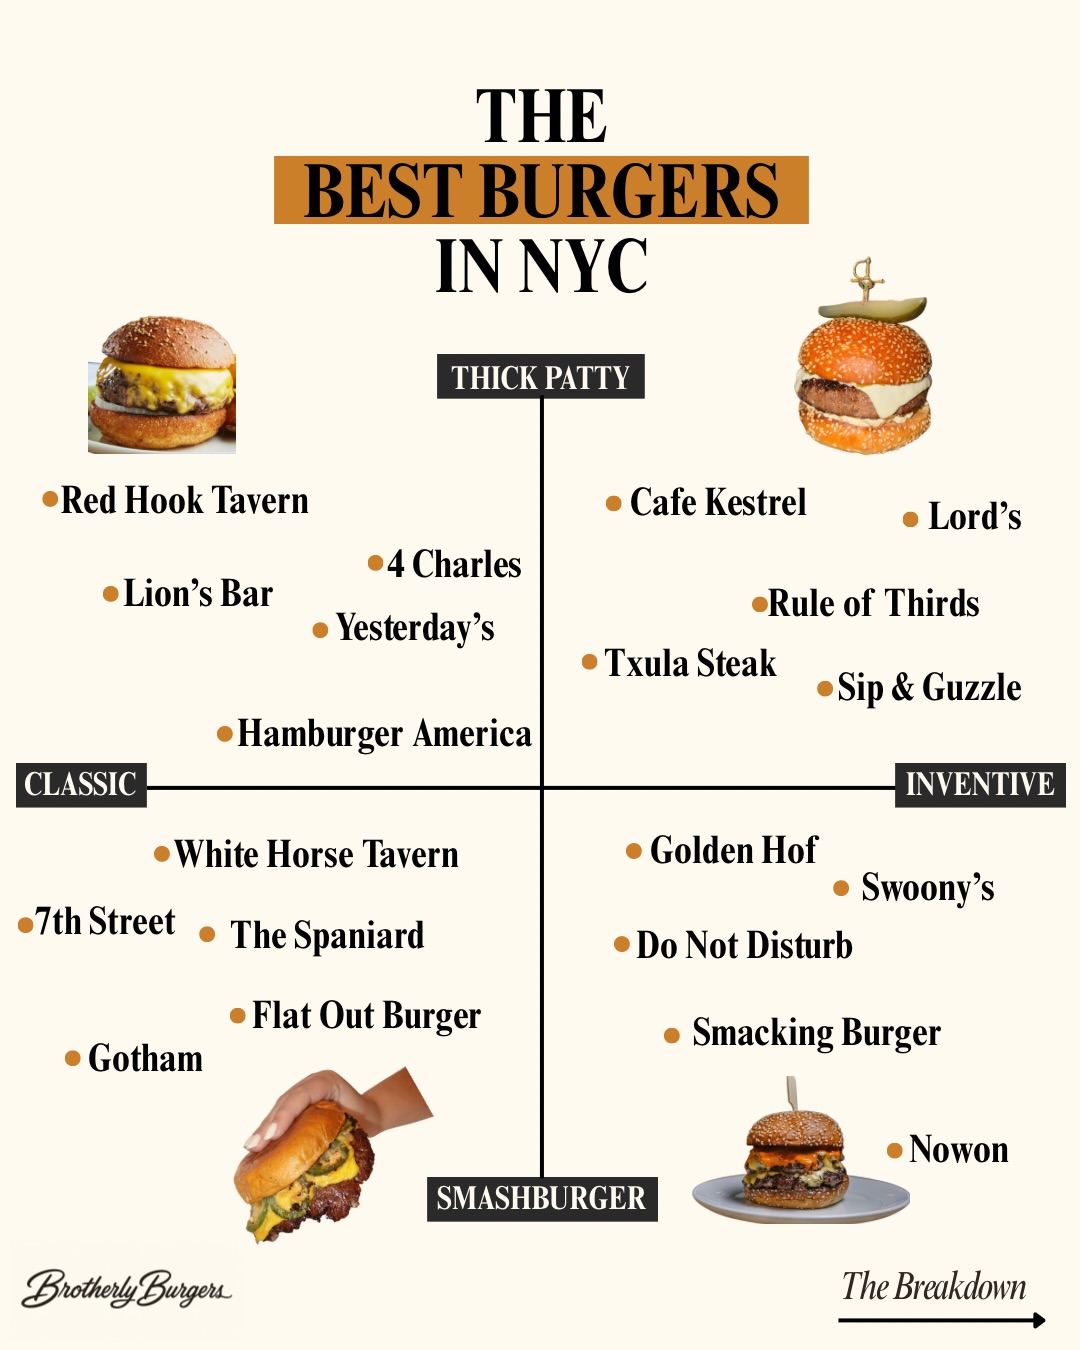 109.7K28.1×NYC best burgers infographic guide@brotherlyburgers · Breakdown
 1.9M168×Aesthetic travel showcase of New York@alexanewyorkcity · Location Showcase
 1.7M355.3×Creator presents three useful websites@ediepeffley · Rapid Fire Listicle
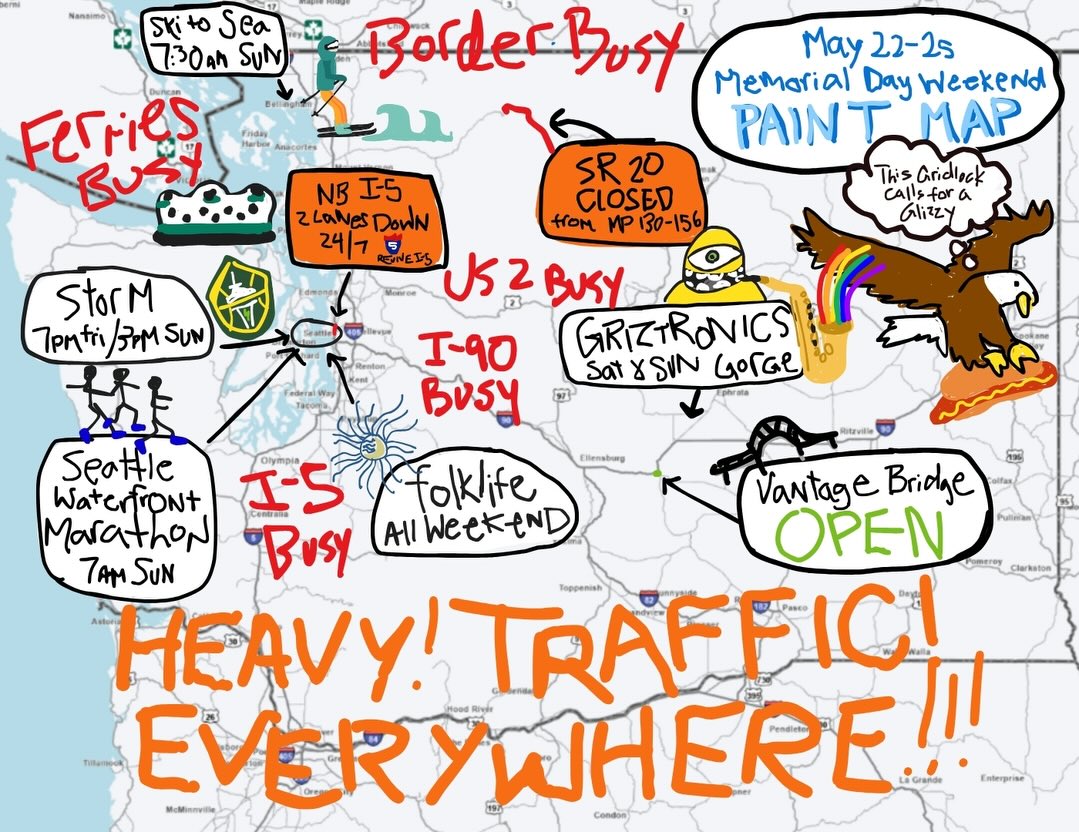 240.4K3.8×Hand-drawn Washington state traffic map.@wsdot · Public Service Announcement
 299.4KFast-paced guide to Newport, RI@thenitrobar · Rapid Fire Listicle
[04]
[05]
What stops the scroll in the first 3 seconds
Title hook · 25%
# OF DUNKIN'S BY STATE
Verbal hook · 25%
# OF DUNKIN'S BY STATE
Visual hook · 50%
A bold, orange map of the United States with large, high-contrast numbers showing a dramatic concentration of locations in the Northeast (e.g., 1,454), creating a strong visual pattern and immediate curiosity about the data.
[07]
The promise the opener makes, and how the video pays it back
Hook
A bold, declarative title that frames the entire dataset as a single, digestible idea, immediately answering the 'what is this about?' question.
Payoff
The entire image serves as its own payoff, delivering an immediate 'aha' moment as the user grasps the surprising geographic pattern, which encourages comments and shares based on regional pride or surprise.
[08]
The structural pattern this video runs on
Framework
The Data Snapshot
Presents a comprehensive dataset on a single, visually scannable map or graphic. The narrative is created by the stark contrast between high-density 'epicenters' and low-density 'voids,' prompting immediate user reaction and self-identification.
The Epicenter
Visually guides the user to the area of highest data concentration (e.g., the Northeast), establishing the story's primary focal point and delivering the initial 'wow' factor with large numbers.
The Void
Presents a stark counter-narrative by highlighting areas with zero or minimal data, creating surprise and intrigue through dramatic contrast.
The Broader Landscape
Fills in the remaining data points, providing context and allowing a wider audience to find their own specific data point, fostering personal connection and exploration within the single frame.
me posting this at the corner of dunkin’ and dunkin’
title · photo_0
# OF DUNKIN'S BY STATE
informational · photo_0
1,454
informational · photo_0
1,034
informational · photo_0
936
informational · photo_0
0