@public_citizen
Instagram · Carousel
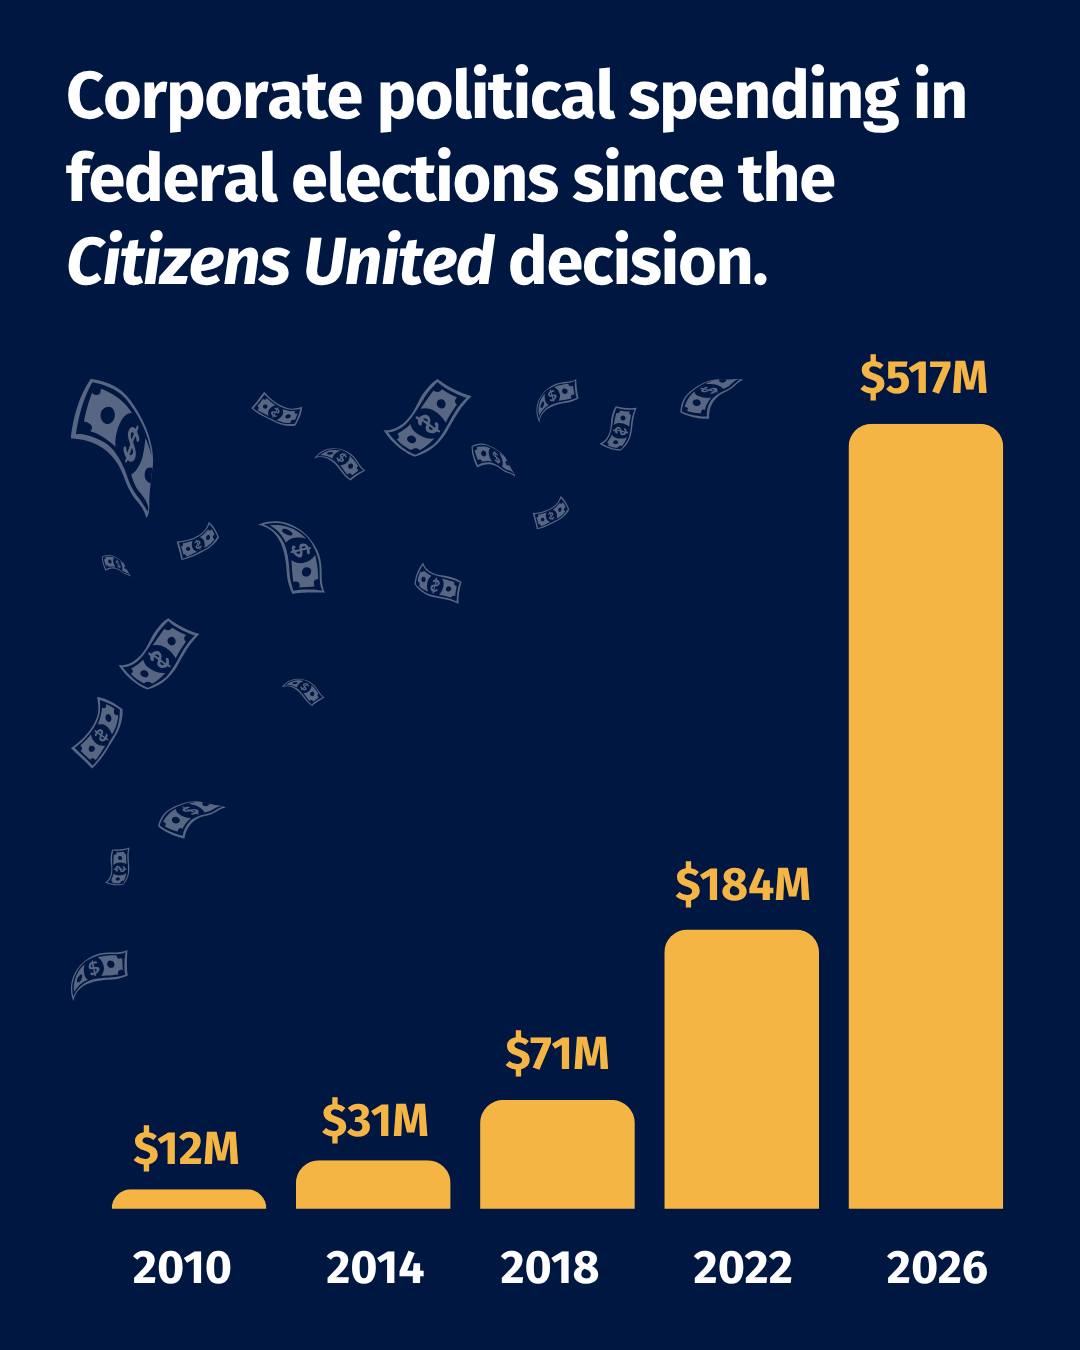
@public_citizen A decade and a half after Citizens United, corporations are starting to spend on politics like never before. This is a disaster for our democracy.

@public_citizen
Instagram · Carousel
@public_citizen A decade and a half after Citizens United, corporations are starting to spend on politics like never before. This is a disaster for our democracy.
Performance
Video #35640 · Carousel
[01]
This is a graphic that uses a bar chart to visualize the significant increase in corporate political spending in federal elections over several election cycles, starting from 2010. The chart shows actual figures for 2010, 2014, 2018, and 2022, and a projected figure for 2026, highlighting a dramatic upward trend since the Citizens United decision.
[02]
[03]
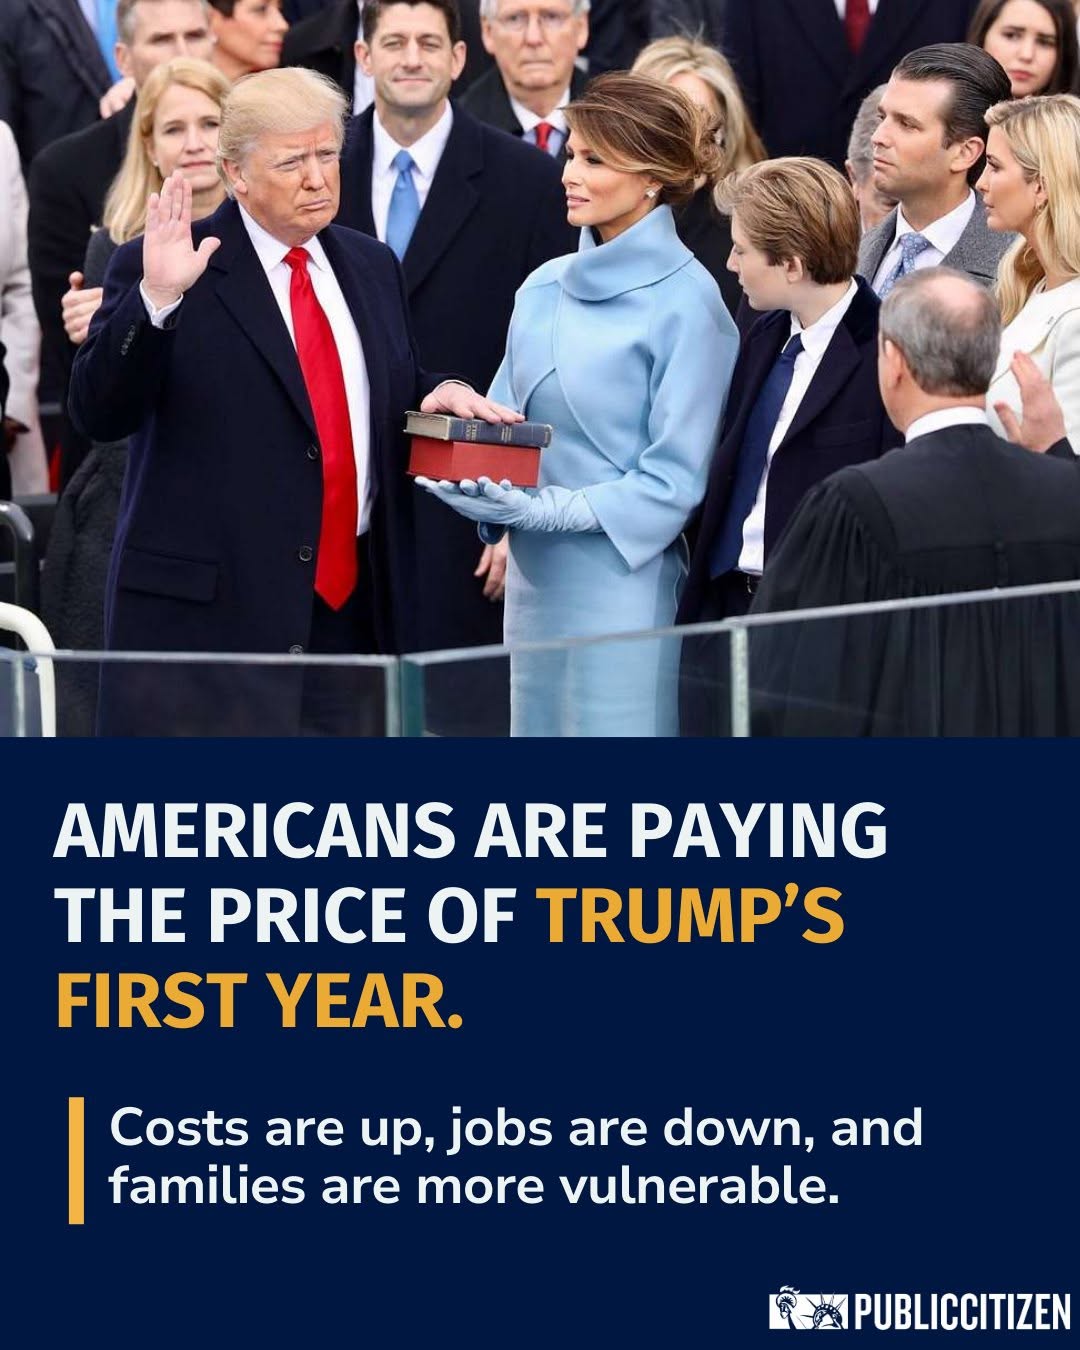 133.5K36.3×Political critique of Trump's presidency@public_citizen · Statement Carousel
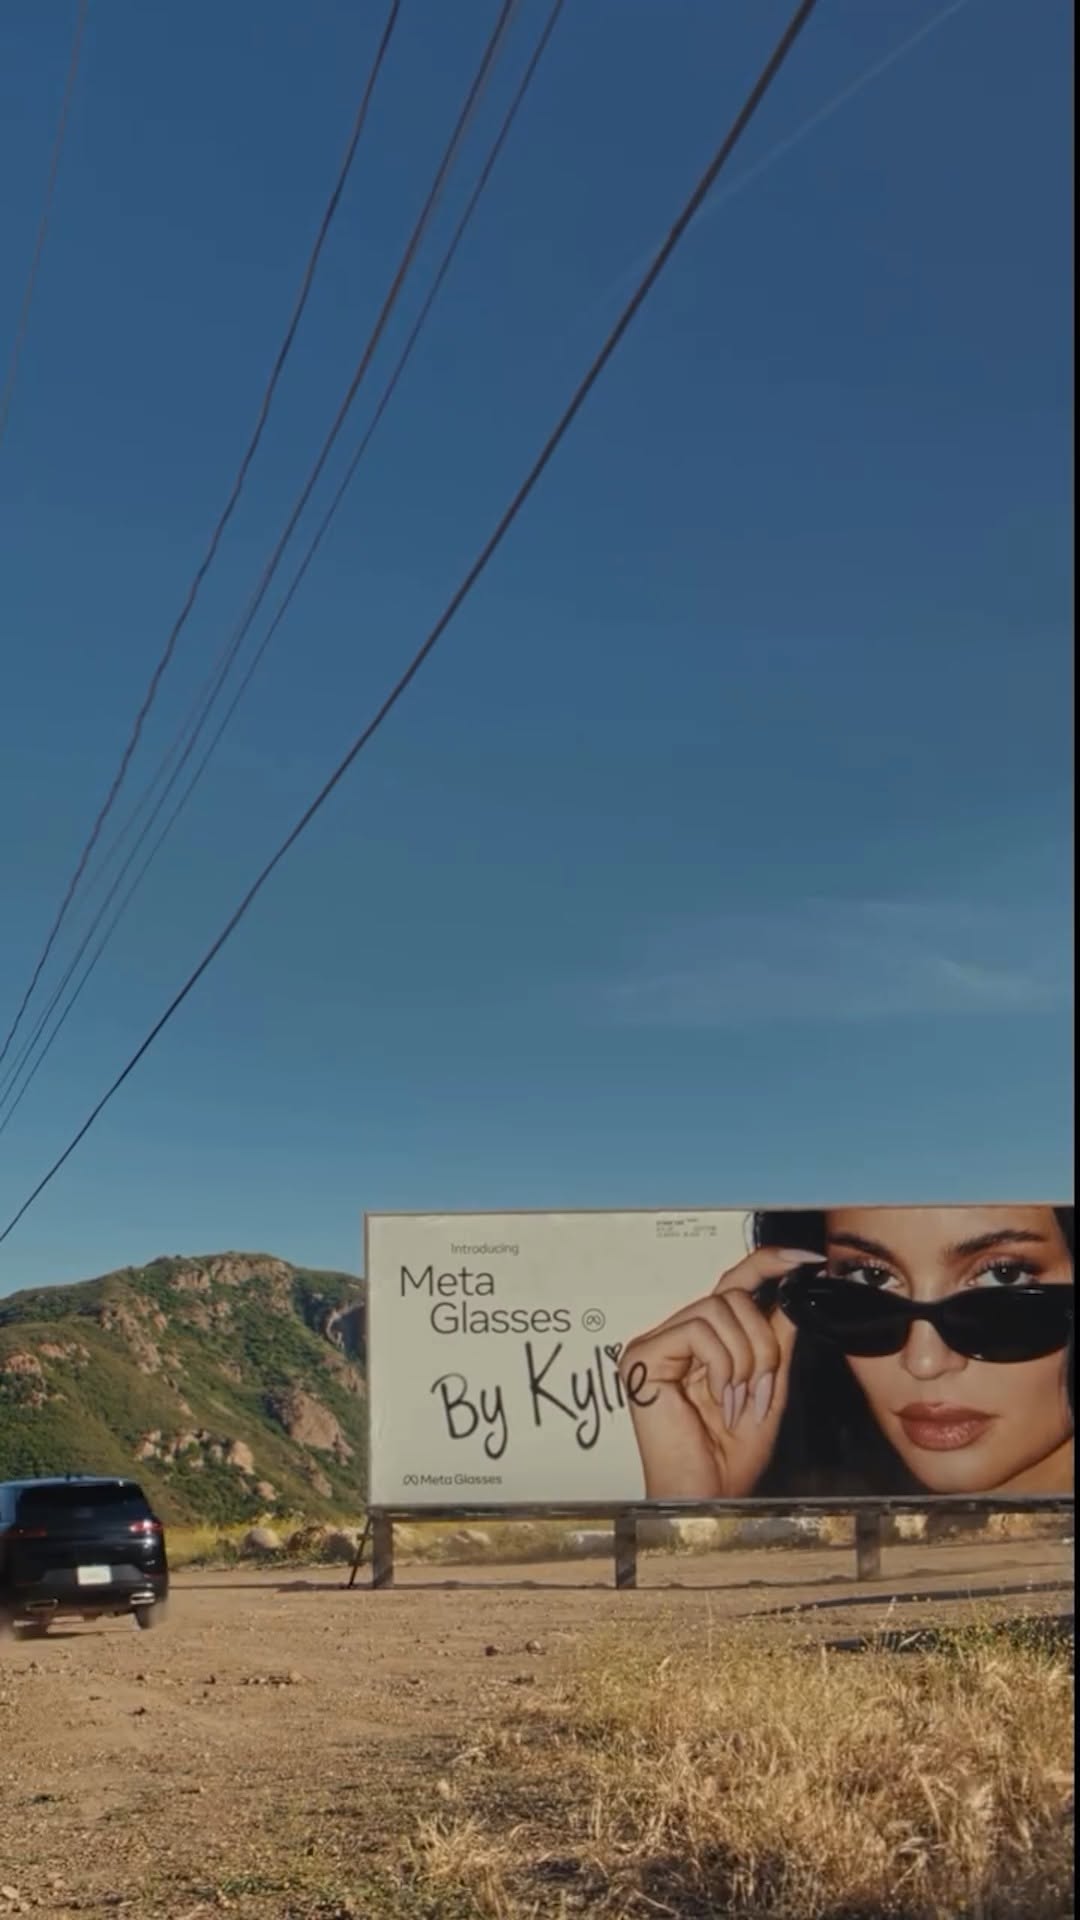 214.8K82.1×Pop culture hook for political explainer@repjayapal · Trendjacking
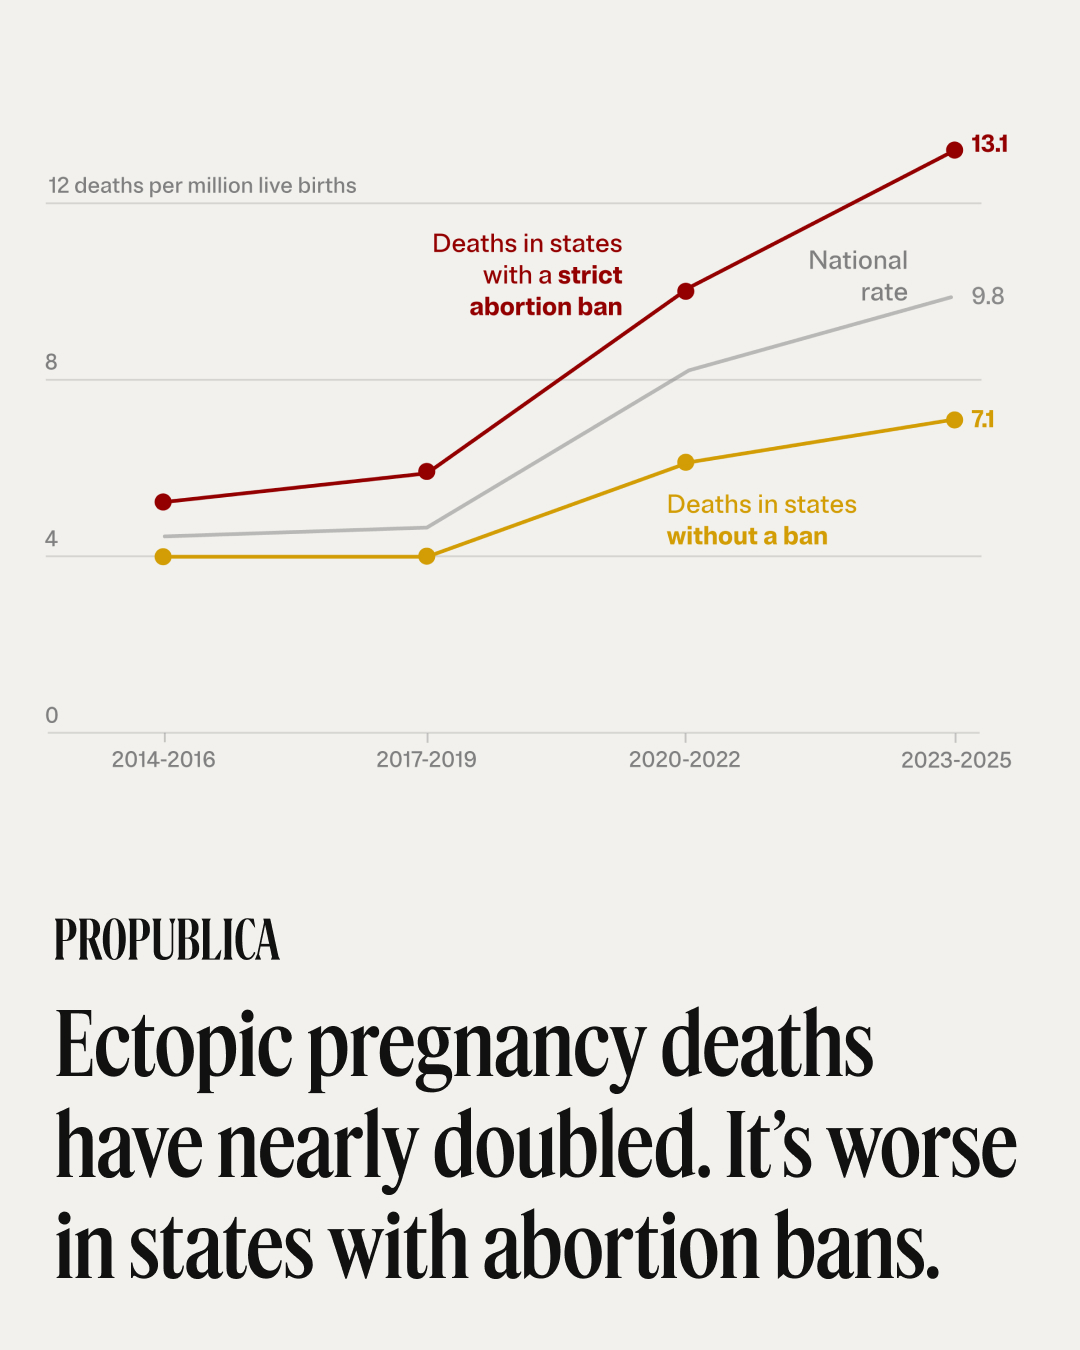 553.4K20.7×Graph showing rising ectopic pregnancy deaths@propublica · News Carousel
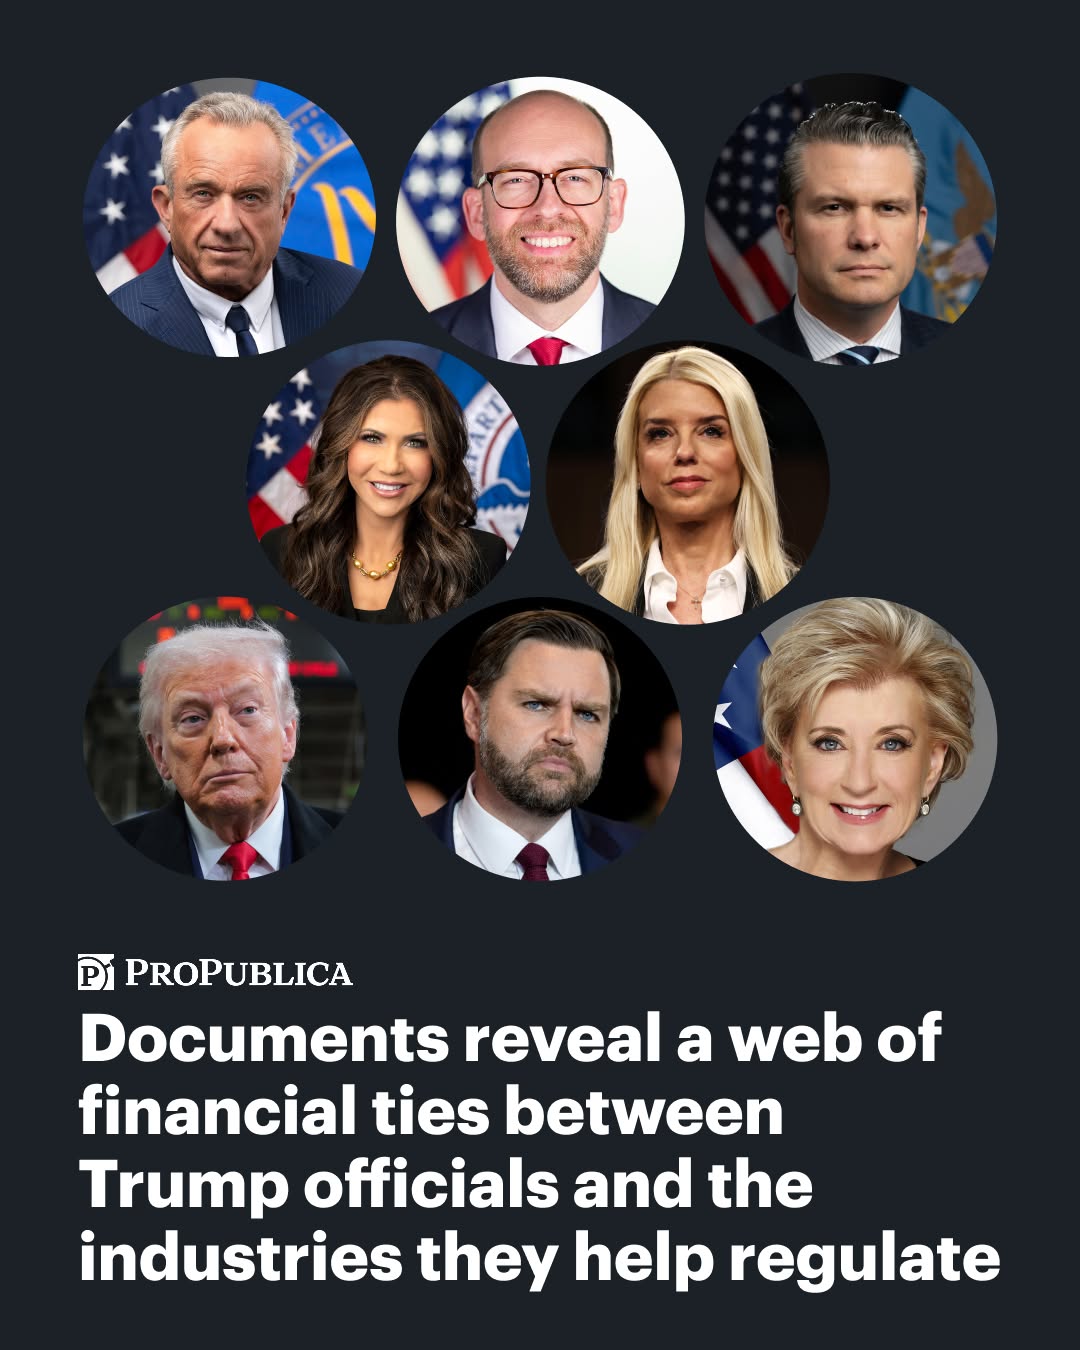 1.3M68.9×Political investigative news headline graphic@propublica · Investigative Breakdown
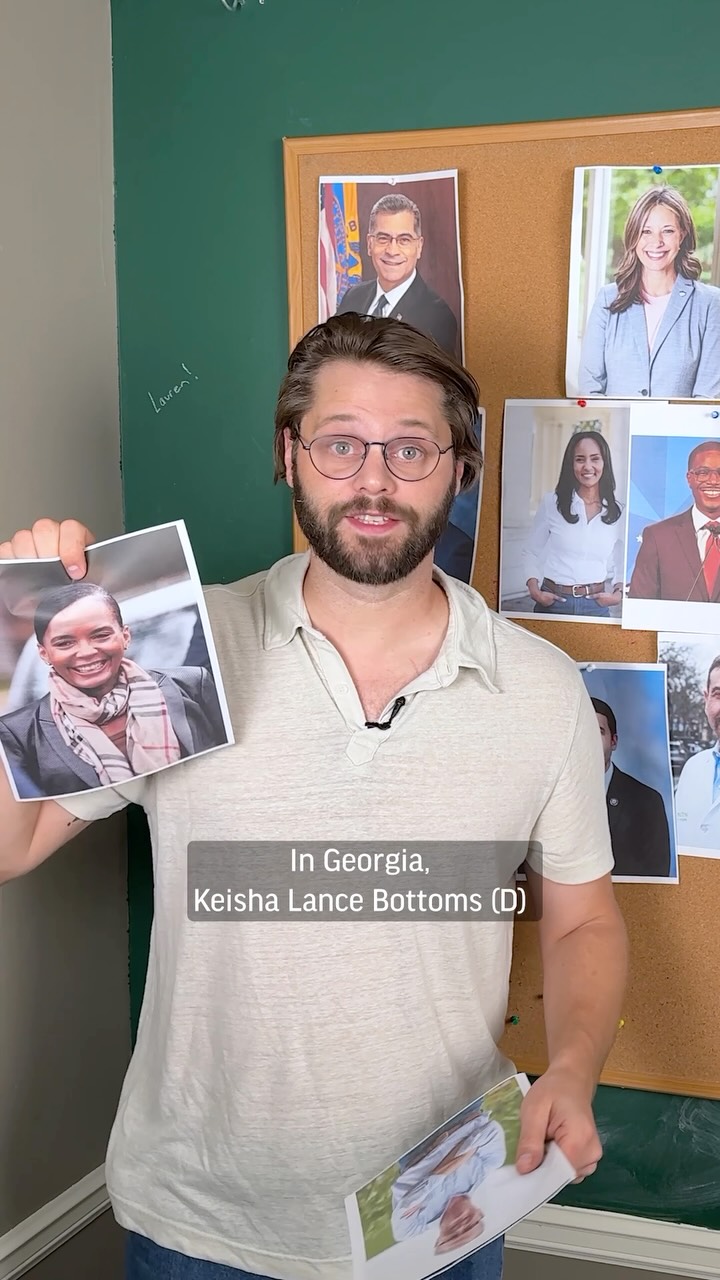 261.4K11.9×Listing political firsts on board@davejorgenson1 · Rapid Fire Listicle
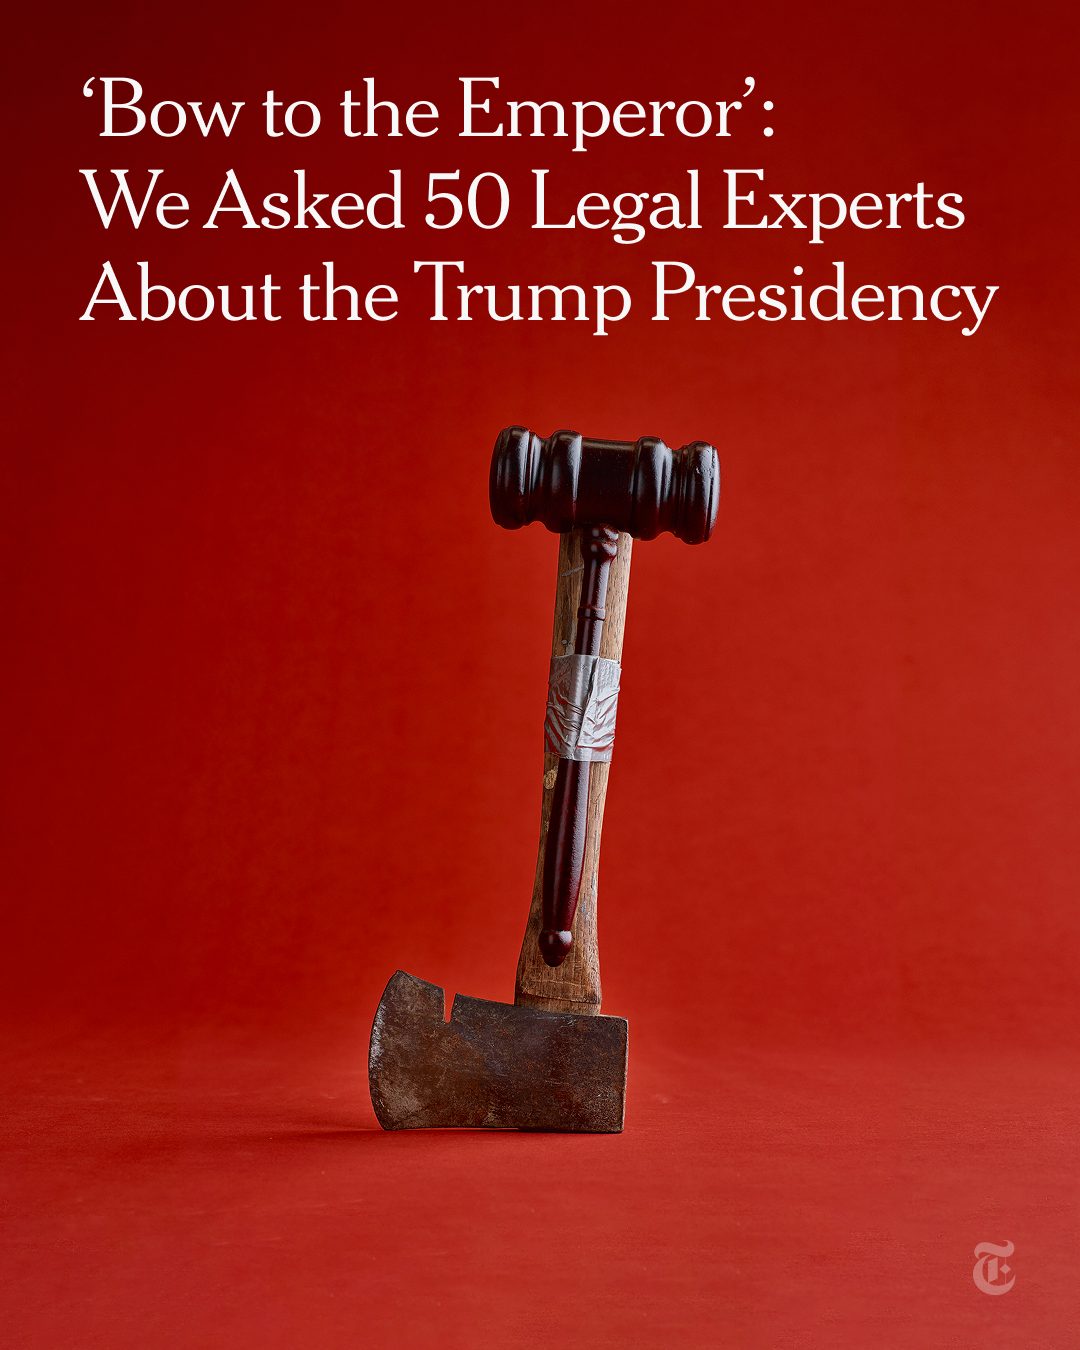 409.7KPolitical survey results on Trump's presidency.@nytmag · Editorial Carousel
 220.3K97.7×Political warning text graphic@freedcproject · Public Service Announcement
 53.6K2.5×On-the-ground political news update@garyspamsue · Headlines
 1.9MExplaining political conspiracy with overlays@marcotrunzo · Conspiracy Breakdown
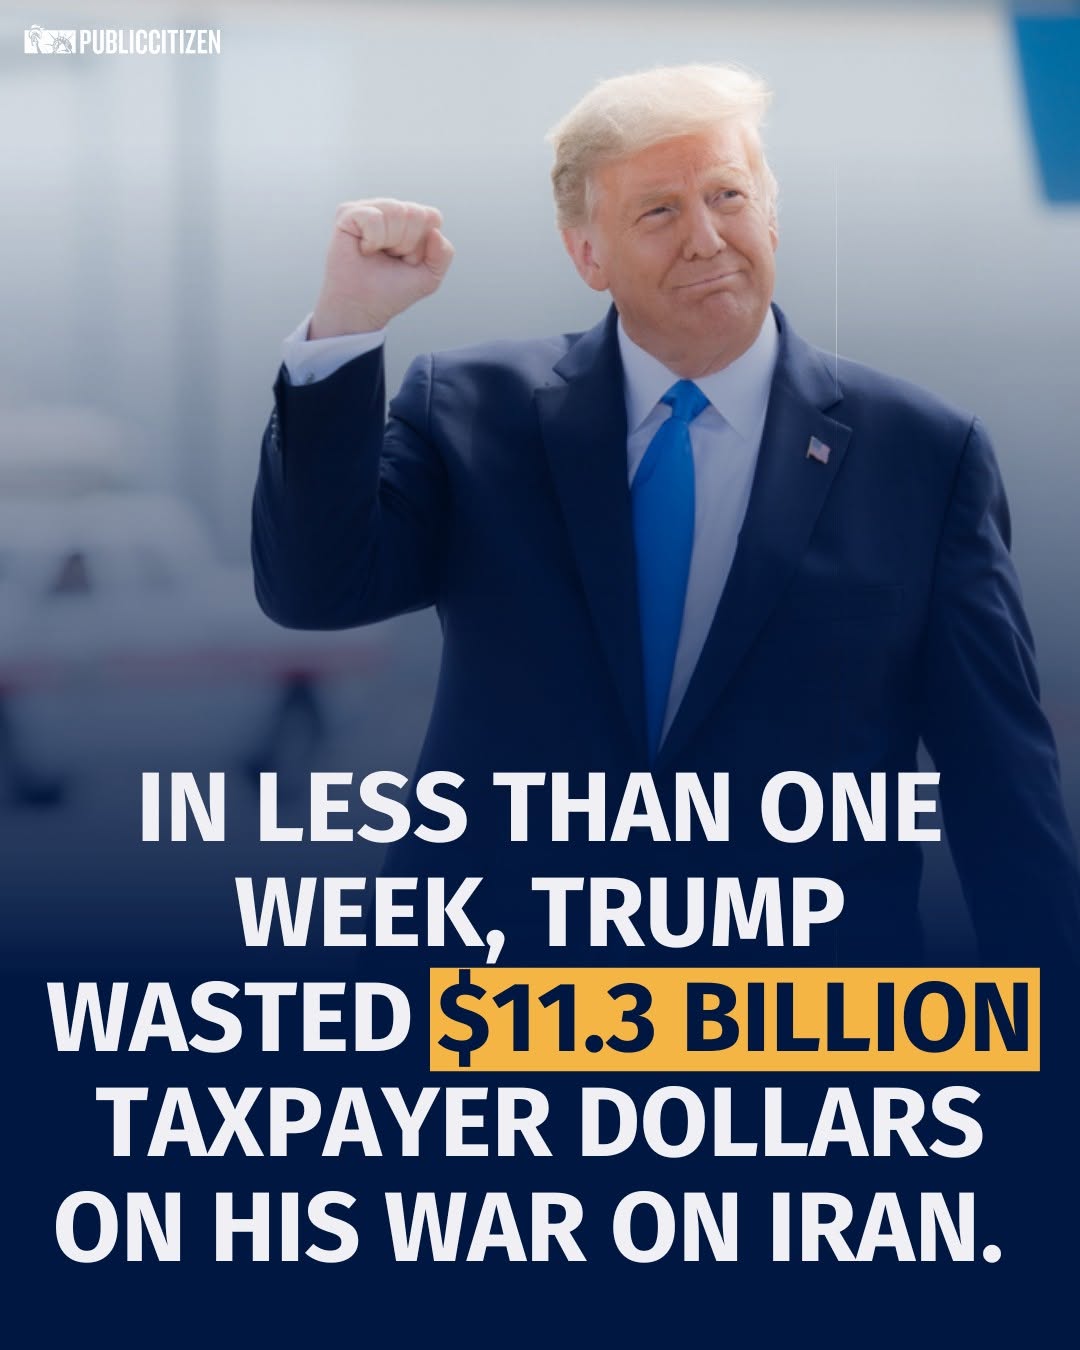 187.1K65.3×Political graphic criticizing Trump's spending@public_citizen · Public Service Announcement
 662K4.3×Passionate political commentary with B-roll@rony · Cultural Rant
 322.9KCreator warns viewers to question who benefits from government spending transparency@bradley.thor · Hot Take
[04]
[05]
What stops the scroll in the first 3 seconds
Title hook · 30%
Corporate political spending in federal elections since the Citizens United decision.
Verbal hook · 50%
A decade and a half after Citizens United, corporations are starting to spend on politics like never before. This is a disaster for our democracy.
Visual hook · 20%
The dramatic exponential growth of the bars in the chart creates a powerful visual hook, immediately conveying a message of a massive increase in spending. The stark contrast between the smallest and largest bars tells a compelling story at a glance.
[06]
Steal this for your own video
A decade and a half after , are doing like never before — and it's a disaster for .
[07]
The promise the opener makes, and how the video pays it back
Hook
A clear, declarative headline that establishes the topic and the stakes of the data being presented, immediately framing the context for the viewer.
Payoff
The final, towering data point acts as a visual punchline. Its purpose is to leave the viewer with a single, powerful impression of an alarming future, implying the urgency of the issue without an explicit call to action on the image itself.
[08]
The structural pattern this video runs on
Framework
The Projected Future Shock
To tell a story of dramatic escalation by presenting a data timeline that starts with a stable baseline, shows a sudden acceleration, and culminates in a shocking future projection. The entire narrative is compressed into a single, visually arresting graphic.
The Baseline Establishment
Presents the initial data points in a timeline (2010-2018). These points establish a 'normal' or starting condition with steady, predictable growth, grounding the viewer and setting up the later contrast.
The Inflection Point
Introduces a data point (2022) that shows a significant and dramatic acceleration, visually and numerically breaking the established pattern. This creates narrative tension and signals a major shift.
The Projected Climax
Reveals a future-facing, projected data point (2026) that is exponentially larger than all previous points. This serves as the narrative's shocking conclusion and emotional payoff, designed to provoke alarm.
A decade and a half after Citizens United, corporations are starting to spend on politics like never before. This is a disaster for our democracy.
title · photo_0
Corporate political spending in federal elections since the Citizens United decision.
informational · photo_0
$12M
contextual · photo_0
2010
informational · photo_0
$31M
contextual · photo_0
2014
informational · photo_0
$71M
contextual · photo_0
2018
informational · photo_0
$184M
contextual · photo_0
2022
informational · photo_0
$517M
contextual · photo_0
2026