Viral Hooks
Trending short videosGraph showing rising ectopic pregnancy deaths
P

@propublica

Instagram · Carousel
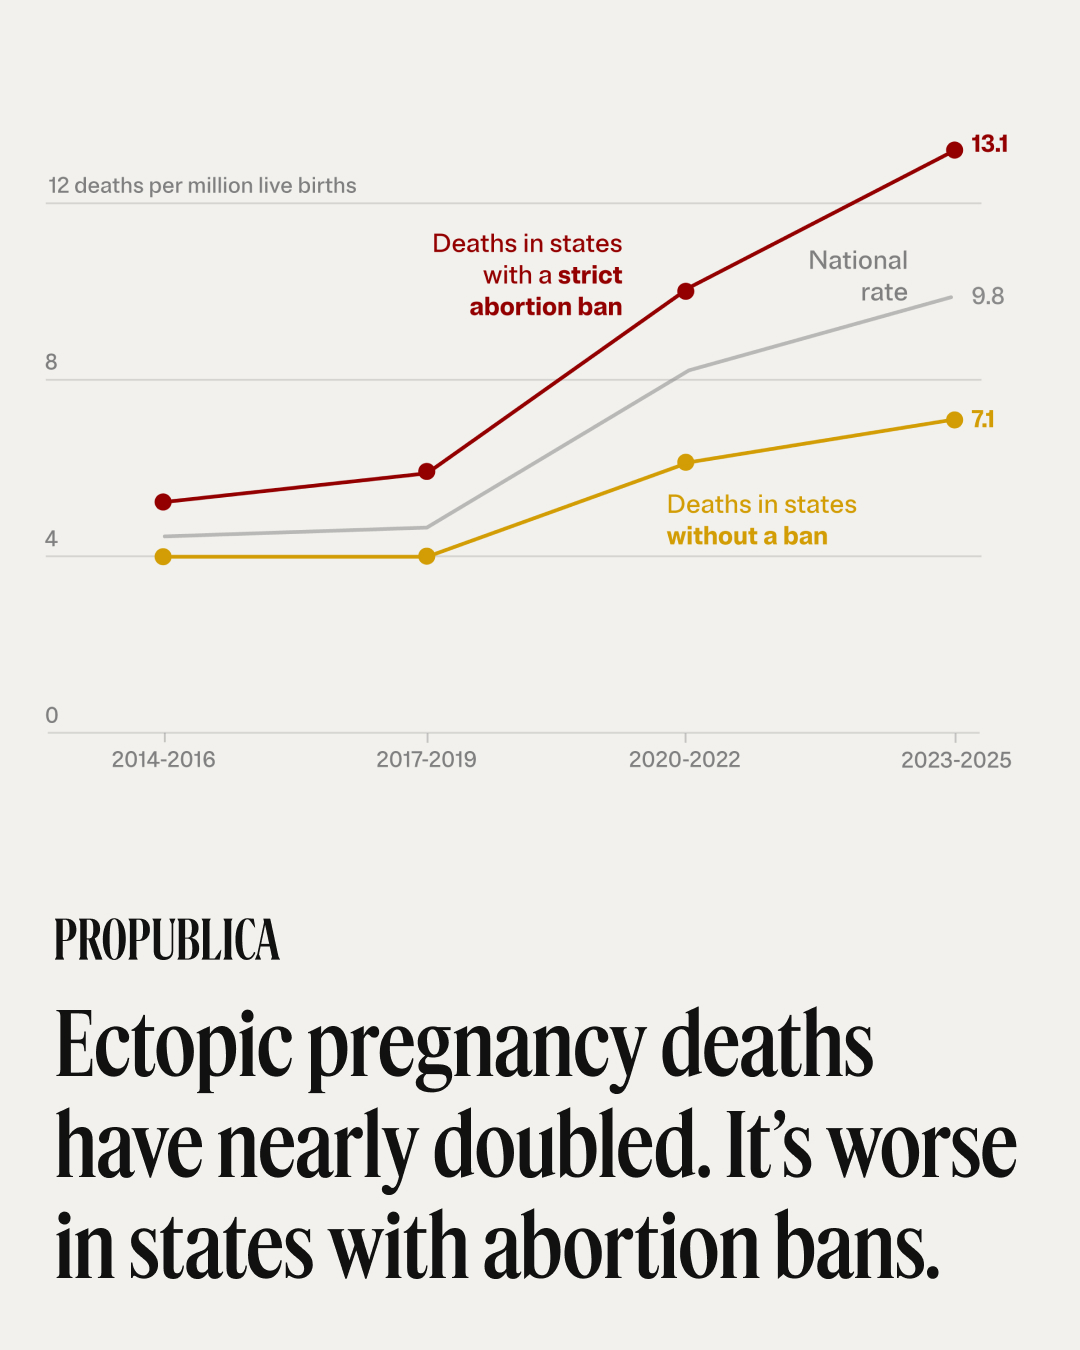
@propublica With prompt and appropriate medical care, experts say, women shouldn’t die of an ectopic pregnancy. Yet ProPublica’s analysis found a stark and baffling increase: Almost 200 women with ectopic pregnancies died from 2020 to 2025, compared with about 100 in the previous six years. “A death related to ectopic pregnancy should really be a never event,” one OB-GYN said. While the uptick in ectopic deaths occurred nationwide, the climb has been much steeper in states that banned abortion after Roe v. Wade was overturned in 2022. Experts said more research is needed to determine the role of the abortion bans in the rise. But our analysis — along with stories about delays in ectopic care — underscores the need to find out what is driving the deaths, they said. Tap the link in our bio to read the full story. (Graphics by Lucas Waldron/ProPublica)

View original on Instagram

The edit1 shot · 9 text
Shots Text

Performance

Views
553.4K
Likes
36.9K
Comments
683
Engagement
6.8%
Outlier
20.7×

Video #41789 · Carousel

Graph showing rising ectopic pregnancy deathsfrom @propublica

[01]

Overview

This is an informational graphic from ProPublica presenting a line chart that visualizes the rise in ectopic pregnancy deaths per million live births from 2014 to 2025. The chart compares the death rates in states with strict abortion bans, states without bans, and the national average, highlighting a significantly steeper increase in states with bans. A bold headline at the bottom summarizes the key finding.

[02]

Simple outline

  1. 1State alarming two-part thesis
  2. 2Visualize the core conflict
  3. 3Quantify the dramatic conclusion

[03]

Related videos

[04]

Classification

Format
Concepts
News CarouselStatement Carousel
Elements
Data Visualization GraphicText OverlayTemplated Graphic Layout
Account

[05]

Hook analysis

What stops the scroll in the first 3 seconds

Title hook · 55%

Ectopic pregnancy deaths have nearly doubled. It's worse in states with abortion bans.

Verbal hook · 25%

With prompt and appropriate medical care, experts say, women shouldn’t die of an ectopic pregnancy. Yet ProPublica’s analysis found a stark and baffling increase...

Visual hook · 20%

A stark line graph with sharply rising lines, particularly a bold red line representing 'Deaths in states with a strict abortion ban', visually communicates a dramatic and concerning trend.

[06]

Hook template

Steal this for your own video

[Concerning outcome] has nearly doubled. It's worse in [higher-risk group].

  • — Ectopic pregnancy deaths have nearly doubled. It's worse in states with abortion bans.
  • — Missed deliveries have nearly doubled. It's worse in rural areas.
  • — Phishing reports have nearly doubled. It's worse in small businesses.

[07]

Hook and payoff

The promise the opener makes, and how the video pays it back

Hook

A self-contained argument combining a shocking headline with immediate graphical proof to stop the scroll and establish a strong narrative premise.

Payoff

The user experiences a moment of cognitive closure by connecting the headline's claim to the visual evidence, validating the thesis and creating intrigue for the deeper context in the caption or subsequent slides.

[08]

Narrative framework

The structural pattern this video runs on

Framework

The Visual Proof Framework

Present a provocative thesis and immediately validate it with a single, powerful data visualization on the opening slide, compelling the user to stop and absorb the core argument before reading the caption or swiping.

  1. 1

    The Authority Stamp

    Places a brand or source name prominently to establish credibility before the main claim is made.

  2. 2

    The Provocative Thesis

    Presents the core argument as a bold, two-part headline that states a general alarming trend and a specific, more controversial correlation.

  3. 3

    The Comparative Visualization

    Uses a central data graphic (e.g., line chart) to visually represent the conflict or comparison asserted in the thesis, showing a clear divergence or contrast.

  4. 4

    The Explanatory Legend

    Provides clear, concise labels for the different data sets in the visualization, allowing the user to correctly interpret the comparison.

  5. 5

    The Quantitative Punchline

    Highlights the most impactful final data points to provide a concrete, memorable, and shocking conclusion to the visual story.

Themes

  • Public Health
  • Healthcare Policy
  • Social Activism
  • Data Journalism

Techniques

  • Data Visualization
  • Graphic Design
  • Typography

Trends

  • Infographic Content
  • Data-Driven Storytelling

Post caption

With prompt and appropriate medical care, experts say, women shouldn’t die of an ectopic pregnancy. Yet ProPublica’s analysis found a stark and baffling increase: Almost 200 women with ectopic pregnancies died from 2020 to 2025, compared with about 100 in the previous six years. “A death related to ectopic pregnancy should really be a never event,” one OB-GYN said. While the uptick in ectopic deaths occurred nationwide, the climb has been much steeper in states that banned abortion after Roe v. Wade was overturned in 2022. Experts said more research is needed to determine the role of the abortion bans in the rise. But our analysis — along with stories about delays in ectopic care — underscores the need to find out what is driving the deaths, they said. Tap the link in our bio to read the full story. (Graphics by Lucas Waldron/ProPublica)

Text overlays

  • branding · photo_0

    PROPUBLICA

  • title · photo_0

    Ectopic pregnancy deaths have nearly doubled. It's worse in states with abortion bans.

  • contextual · photo_0

    12 deaths per million live births

  • informational · photo_0

    Deaths in states with a strict abortion ban

  • informational · photo_0

    National rate

  • informational · photo_0

    Deaths in states without a ban

  • informational · photo_0

    13.1

  • informational · photo_0

    9.8

  • informational · photo_0

    7.1