@chiosse
Instagram · Speaker address
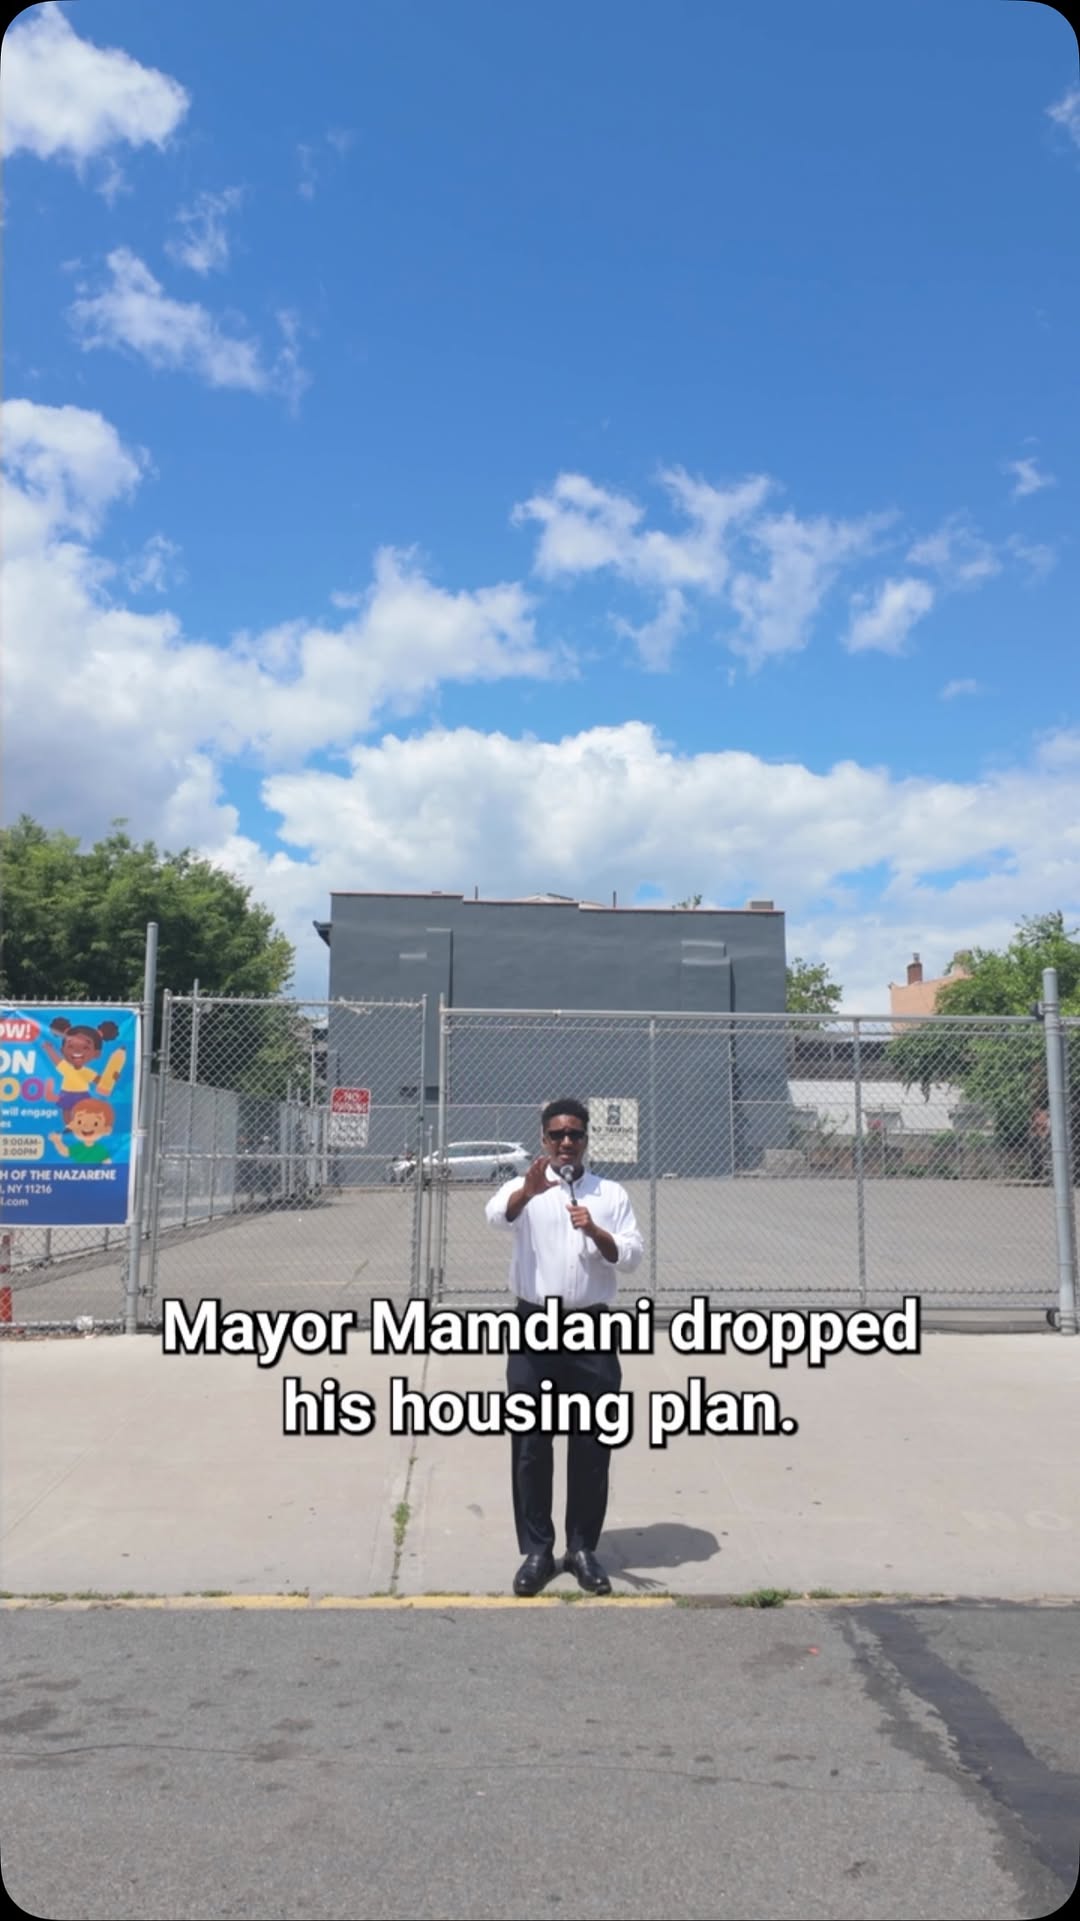
@chiosse How we measure housing affordability in NYC is broken. AMI is partly to blame. Let’s talk about it.

@chiosse
Instagram · Speaker address
@chiosse How we measure housing affordability in NYC is broken. AMI is partly to blame. Let’s talk about it.
Performance
Video #35778 · Speaker address
[01]
The creator explains the concept of Area Median Income (AMI) in New York City, revealing how it is flawed by including data from wealthy suburbs. He uses on-location reporting and data overlays to demonstrate how this inflated metric makes "affordable" housing unaffordable for actual residents of neighborhoods like Bed-Stuy and Crown Heights.
[02]
[03]
 134.1KWalking talking head comedic punchline@zesstysauce
 304.9K49.1×Couple breaks down monthly NYC expenses@alliedition · Rapid Fire Listicle
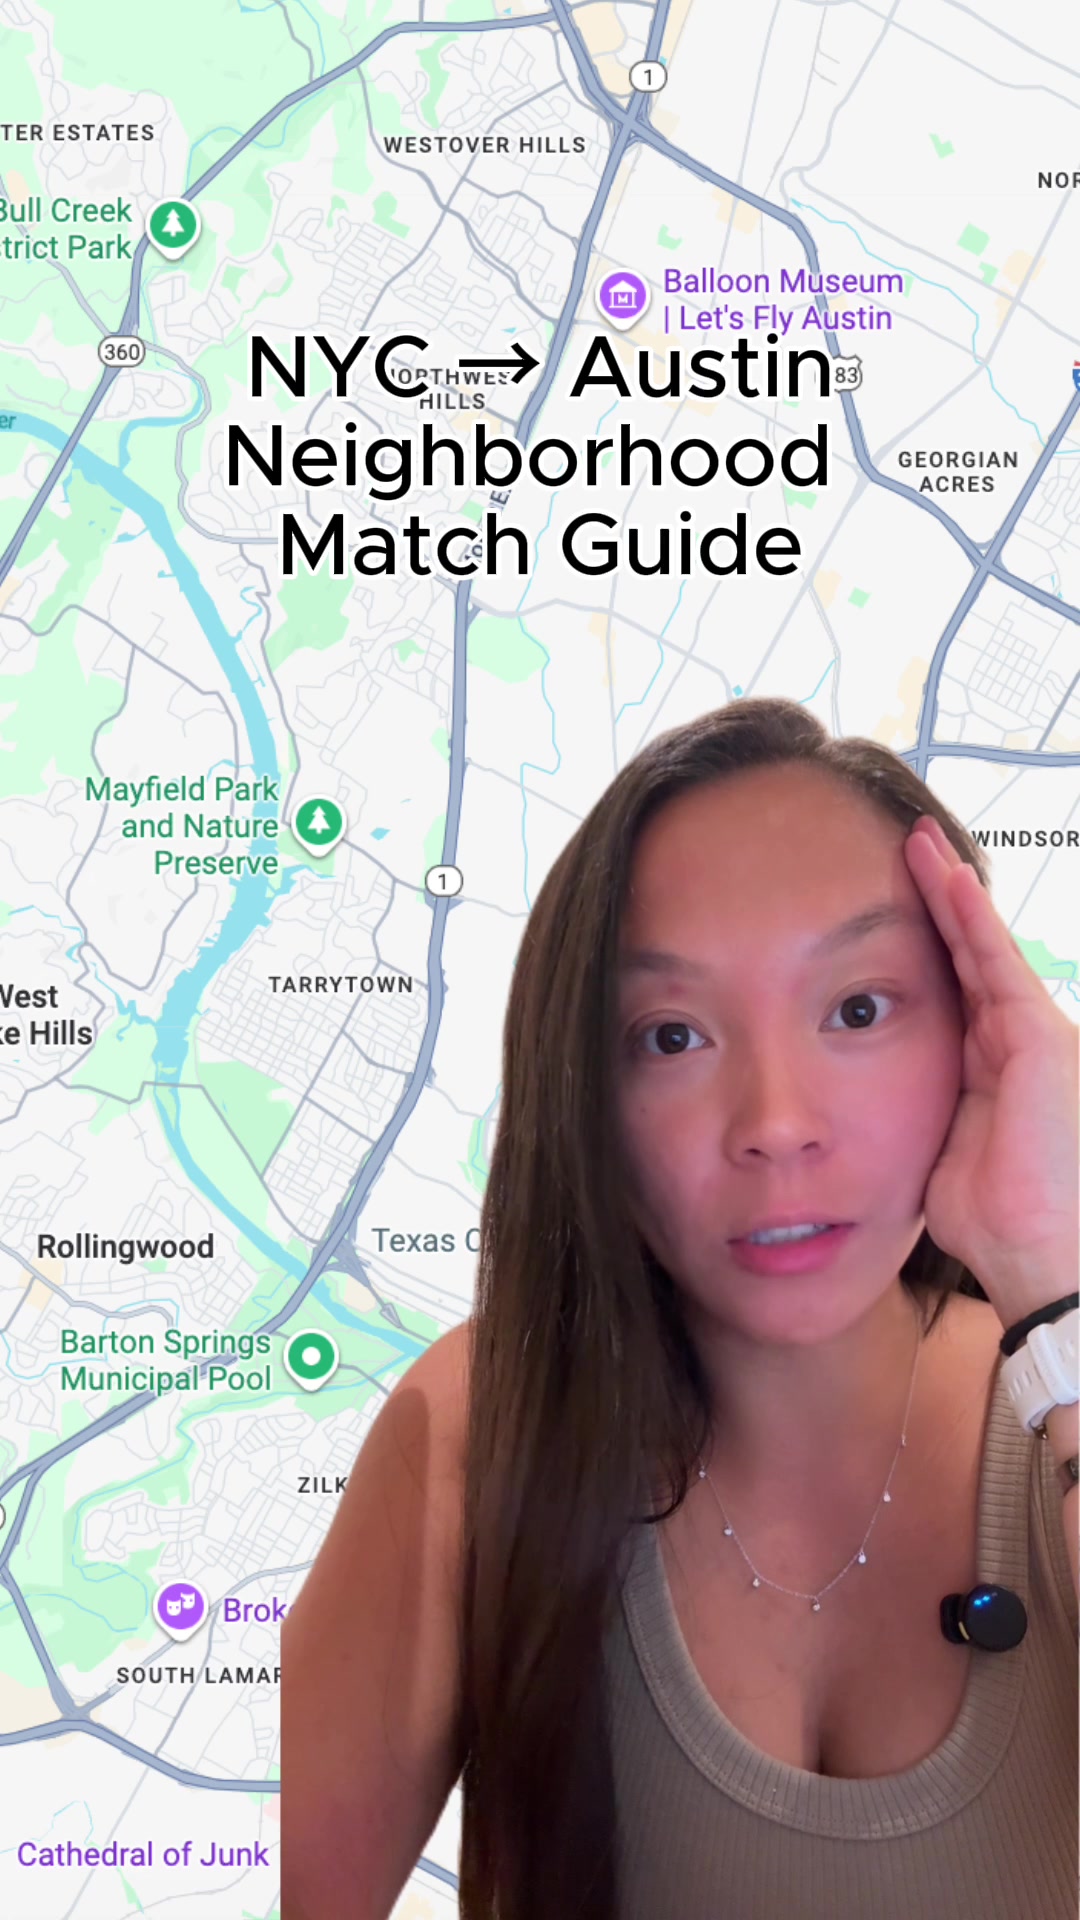 74.1KNYC to Austin neighborhood guide@cosette.eliason · Location Showcase
 644K180.3×Creator lists lessons from NYC.@madwelllness · Rapid Fire Listicle
 507.1K2.3×Aesthetic NYC travel lifestyle montage@rexchexng · Vibe Showcase
 207.9K10.6×Creator shares NYC travel tip@thekatieromero · Value Vlog
 132.3K25.1×NYC Marathon origin story explainer@janfeterman · Origin Story
 1.1M617.8×Aesthetic city architecture showcase@alexanewyorkcity · Location Showcase
 275.5K11.9×NYC Mayor announces new bus plan@nyc_dot · Public Service Announcement
 1.8M2×Rapid fire list of NYC activities@katyatheexplorer · Rapid Fire Listicle
 1.5MContradicting stereotypes with visuals@joshvargas508 · Stereotype Satire
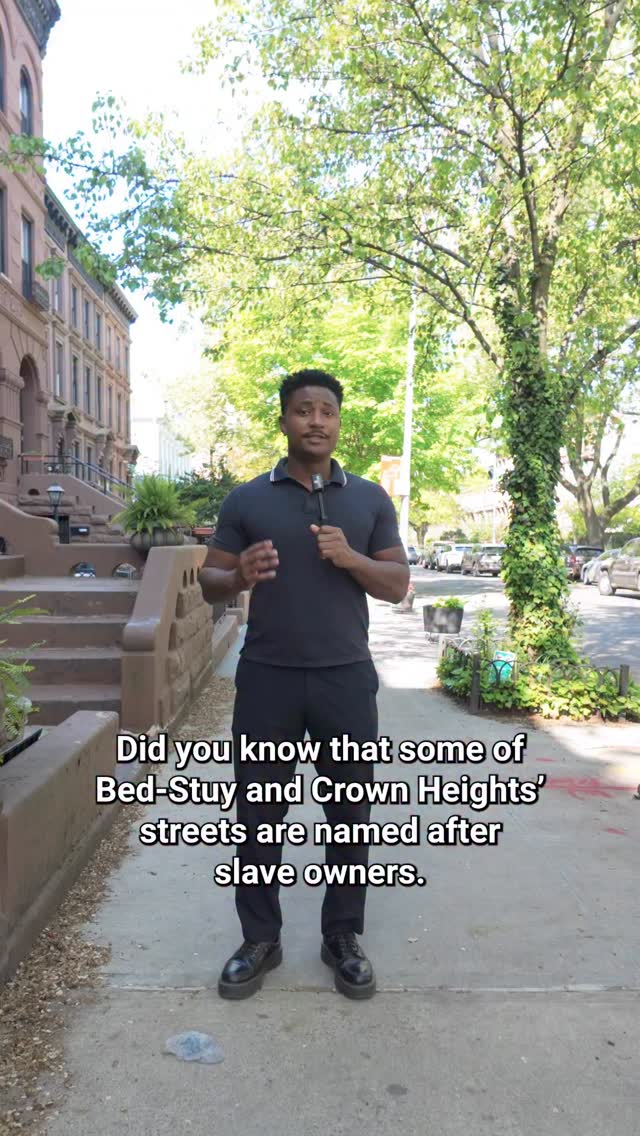 241.8K6.3×Reclaiming Brooklyn's street names@chiosse · Journey Documentation
[04]
[05]
What stops the scroll in the first 3 seconds
Title hook · 50%
Mayor Mamdani dropped his housing plan.
Verbal hook · 50%
Mayor Mamdani dropped his housing plan.
Visual hook
A wide shot of the speaker standing alone in front of a large, empty, fenced-in lot under a vast, cloud-filled sky, establishing a sense of place and scale.
[06]
Steal this for your own video
just dropped . Here's the part aren't being told.
[07]
The promise the opener makes, and how the video pays it back
Hook
Juxtapose a positive, high-level announcement with a negative, tangible reality to create immediate intrigue and establish a problem to be solved.
Payoff
The viewer achieves a moment of clarity, understanding the root cause of a common frustration or paradox. The resolution is intellectual satisfaction and a new, critical perspective on a familiar topic.
[08]
The structural pattern this video runs on
Framework
The Systemic Flaw Exposé
To deconstruct a commonly accepted concept by revealing a fundamental, data-backed flaw in its definition, and then demonstrating the negative real-world consequences of that flaw.
The Invisible Force
Introduce the idea that a hidden, abstract rule or number pre-determines the outcome before any physical action is taken, creating a sense of mystery.
The Official Definition
Clearly and simply define the key term or concept at the heart of the system, educating the viewer on the 'official story'.
The Foundational Flaw
Reveal a critical, counter-intuitive error in the official definition of the concept, often by exposing a flawed assumption or incorrect boundary.
The Absurd Equivalence
Make the flaw concrete by creating a direct, unfair comparison between two vastly different entities that the flawed system treats as equal.
The Official Metric
Present the official data point or benchmark that the flawed system produces, establishing the 'inflated' number.
The Ground-Truth Metric
Contrast the official metric with the actual, real-world data for the affected group, creating a stark and shocking disparity.
The Paradoxical Outcome
Explain how the flawed system leads to a final outcome that is the opposite of its intended purpose, using the data disparity as definitive proof.
How we measure housing affordability in NYC is broken. AMI is partly to blame. Let’s talk about it.
contextual · beginning
Block by Block Mayor Zohran Kwame Mamdani Deputy Mayor for Housing and Planning May 2026
title · beginning
AREA MEDIAN INCOME
informational · middle
New York City's AMI is inflated by the inclusion of income data from affluent suburbs, meaning what the city may designate as affordable housing may not be affordable for many city residents -- and especially not for the residents of the neighborhood itself.
informational · middle
The region's AMI includes the median income from Westchester, Rockland and Putnam counties, which all have higher median incomes than the five boroughs.
informational · middle
Interestingly, both Westchester and Rockland do not include New York City's income in determining their AMI because of legislation passed in Congress in the 1990s.
informational · middle
The AMI for all cities across the country is defined each year by U.S. Department of Housing and Urban Development (HUD). The 2026 AMI for the New York City region is $152,700 for a three-person family (100% AMI).
informational · middle
Median household income in 2023 was $78,040, about 2% less than citywide median household income ($79,480). The poverty rate in Bedford Stuyvesant was 25.5% in 2023 compared to 18.2% citywide.
informational · end
FY 2026 Income Limit Area New York, NY HUD Metro FMR Area Median Family Income $104,300 Low (80%) Income Limits ($) 95,000 108,600 122,150 135,700
Mayor Mamdani dropped his housing plan. It's comprehensive and what this city needs. But stand in rank empty lot like this one, and before a single brick lays down, there's already a number deciding who this housing is for. And most New Yorkers don't know about it. AMI, area median income. It's when the government decides which apartments are affordable and to whom. But the AMI for New York City isn't actually for New York City. It's New York City plus Westchester, Rockland, and Putnam. So Crown Heights gets measured against the same number as Scarsdale. Here's what that does. Official AMI, the benchmark every affordable apartment is based off of, says a family of three earns around a $130,000. The typical household in Bad Stuy actually makes around 78 k. The number the entire system runs on is nearly double what your neighbor basically earns. So when a building goes up and calls its units affordable at 80% AMI, that's a household of three earning up to about 120 tier. More than the