Viral Hooks
Trending short videosFact-checking a politician's data use
N

@nytimes

Instagram · Talking Head Edit

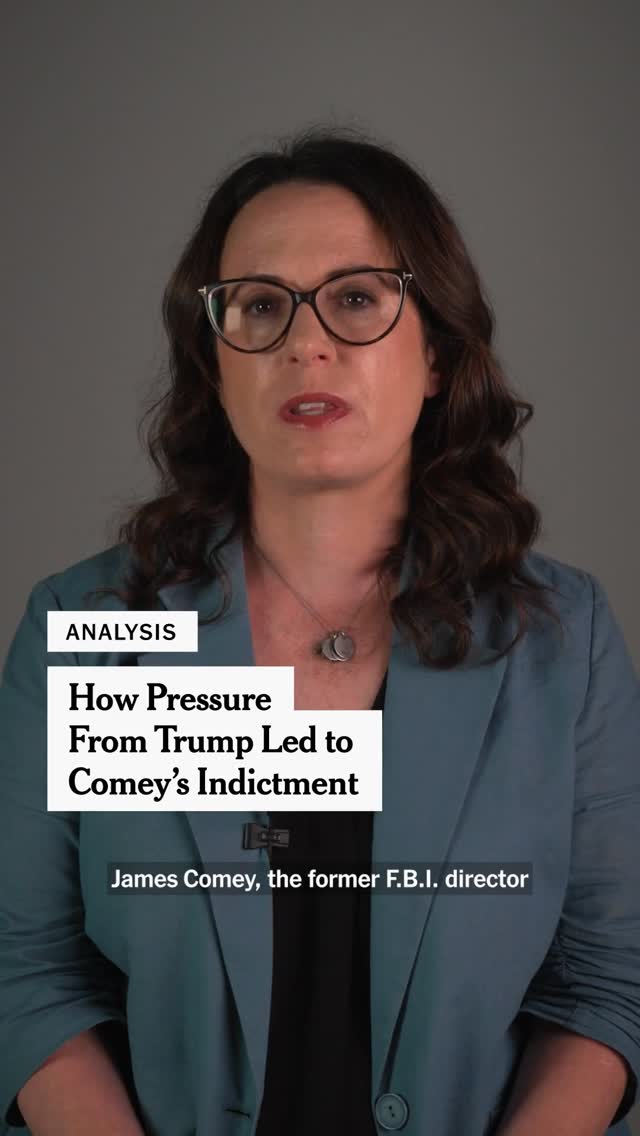
@nytimes To President Trump, the accuracy of statistics and scorekeepers can turn on a dime. Linda Qiu, a New York Times reporter, explains Trump’s selective approach to government data. At the link in our bio, we examine how this plays into his pressure tactics and threatens trust in public data. Video by Linda Qiu, Karen Hanley and Stephanie Swart

View original on Instagram

The edit1 shot · 7 text
Shots Text

Performance

Views
303.9K
Likes
6.3K
Comments
312
Engagement
2.2%

Video #4158 · Talking Head Edit

Fact-checking a politician's data usefrom @nytimes

[01]

Overview

A New York Times reporter analyzes and fact-checks former President Donald Trump's pattern of using government data, explaining how he selectively embraces favorable statistics while dismissing unfavorable ones as "phony." She provides specific examples concerning jobs reports from the Bureau of Labor Statistics, budget forecasts from the Congressional Budget Office, and crime data for Washington D.C., contrasting Trump's claims with the factual context and evidence.

[02]

Simple outline

  1. 1State a behavioral thesis.
  2. 2Show favorable data and positive reaction.
  3. 3Show unfavorable data and negative reaction.
  4. 4Deliver an objective verdict.
  5. 5Explain the broader stakes.

[03]

Related videos

[04]

Classification

Concepts
Breakdown
Elements
B-Roll CutawayText OverlayMotion GraphicsImage Overlay
Account
Topics

[05]

Hook analysis

What stops the scroll in the first 3 seconds

Title hook

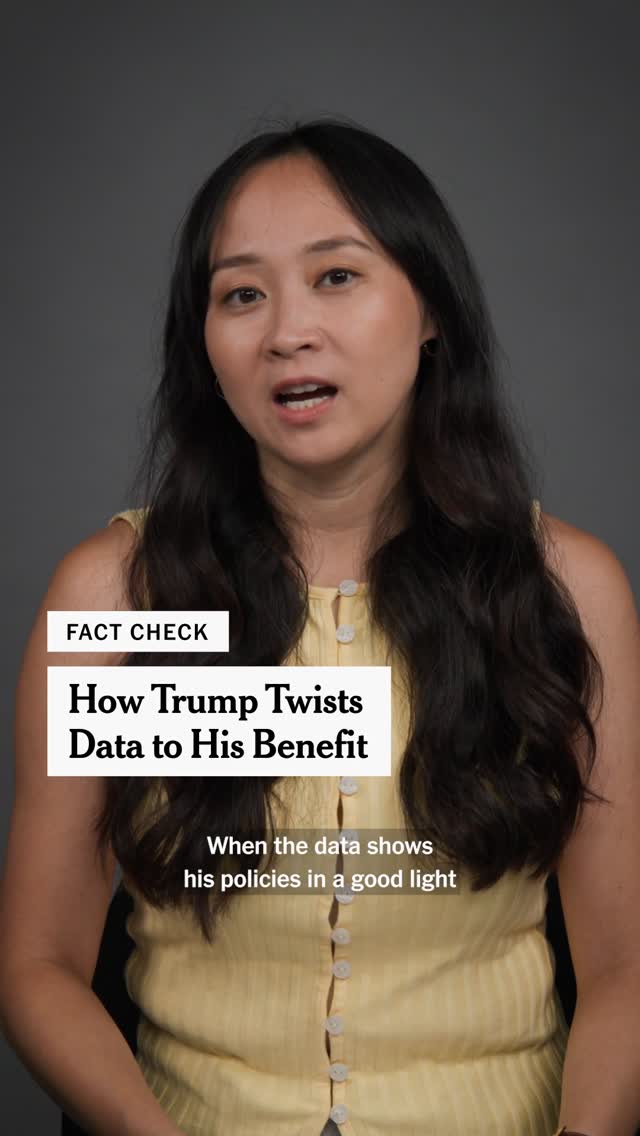
FACT CHECK How Trump Twists Data to His Benef

Verbal hook

President Trump uses data to benefit himself.

Visual hook

A medium shot of a reporter speaking directly to the camera, establishing authority, combined with a large, bold title text overlay that clearly states the video's premise as a fact-check.

[07]

Hook and payoff

The promise the opener makes, and how the video pays it back

Hook

A direct, accusatory thesis is stated, establishing the central argument and the subject of the investigation immediately.

Payoff

The payoff is the validation of the initial thesis through accumulated evidence, culminating in a final statement on the broader societal impact of the subject's behavior.

[08]

Narrative framework

The structural pattern this video runs on

Framework

The Dichotomy Proof

To prove a subject's hypocritical or selective behavior by systematically presenting contrasting scenarios and their corresponding reactions. The narrative establishes a binary rule (e.g., 'If X, then A; If Y, then B') and then validates it through a series of case studies.

  1. 1

    The Governing Rule

    Explicitly define the subject's binary behavior pattern. This beat presents the two opposing conditions and the subject's predictable, contrasting reaction to each, setting the viewer's expectations for the evidence to follow.

  2. 2

    The Gauntlet of Proof

    Introduce the series of case studies that will be used to prove the thesis. This acts as a table of contents, signaling a structured, evidence-based argument.

  3. 3

    The Case Study Loop

    A repeating micro-pattern is applied to multiple distinct topics (e.g., Jobs, Budget, Crime). Each loop serves as an independent piece of evidence that reinforces the initial thesis, creating a powerful sense of confirmation through repetition.

  4. 4

    The Concluding Stake

    Elevate the argument from specific examples to a broader, more significant conclusion. This beat explains why the demonstrated behavior matters and what its real-world implications are, providing a sense of purpose and finality.

Themes

  • Political communication
  • Misinformation
  • Media literacy
  • Government transparency

Techniques

  • Fact-checking
  • Data visualization
  • Archival footage integration

Post caption

To President Trump, the accuracy of statistics and scorekeepers can turn on a dime. Linda Qiu, a New York Times reporter, explains Trump’s selective approach to government data. At the link in our bio, we examine how this plays into his pressure tactics and threatens trust in public data. Video by Linda Qiu, Karen Hanley and Stephanie Swart

Text overlays

  • title · beginning

    FACT CHECK How Trump Twists Data to His Benef

  • contextual · beginning

    Jobs Data Budget Data Crime Data

  • informational · beginning

    This was true in what the B.L.S. reported.

  • informational · middle

    This lacks evidence

  • informational · middle

    This is true and Trump is using the data to his benefit.

  • informational · end

    This needs more context

  • branding · end

    The New York Times

Transcript

President Trump uses data to benefit himself. When the data shows his policies in a good light, he cites them eagerly and willingly. But when they are bad for his political narratives, the data to him is undoubtedly fake or fraudulent or phony. Phony false numbers. Phony numbers. We fact check some of Donald Trump's claims on the data. In April, Trump celebrated reports from the Bureau of Labor Statistics. In three months, we have created 350,000 jobs. This was true in what the BLS reported, but just a few months later, employment numbers for previous months were revised down significantly by 258,000 jobs. That was a significant revision, but it was a pretty normal step of the process. In response to this, Trump was displeased, and he fired the commissioner of the BLS. I believe the numbers were phony best like they were before the election. So you know what I did? I fired her. This lacks evidence. Trump and his advisers have produced no proof that the BLS is purposefully manipulating the data, and experts say that its data is still reliable. Trump has used data from the congressional budget office to his favorite as well. In May, as he prepared to launch his domestic policy agenda, the CBO forecast showed slow economic growth. Low economic growth makes his policies seem more costly. So Trump said that this data was purposefully manipulated to make him look bad. This lacks evidence. And for what it's worth, the head of the CBO is a Republican who worked in the Bush administration. In August, the CBO showed that Trump's tariffs would generate about $4,000,000,000,000 in revenue. Trump celebrated this report and cited it. When the CBO came out on Friday and said, we just found 11 we just found $4,000,000,000,000, and that goes to reduce our deficit. This is true, and Trump is using the data to his benefit. Violent crime in US cities has been on the decline for several decades. In May, at a swearing in ceremony, he cited justice department figures about crime in Washington DC. Crime is down in Washington DC. Street crime, violent crime best 25%. This was true according to yearly data released by the Washington DC Police Department. But in August, Trump started a federal takeover of Washington DC and cited the city's crime as justification. When local officials cited the decline in the city's crime, Trump instead said They gave phony numbers and then they fired the man who didn't wanna write the phony numbers. This needs more context. Trump was citing local news reports that a police commander had been put on leave for manipulating the data. Experts have said that while it's possible the city under counts its numbers, the overall numbers are still pretty reliable and do show a decline in the city's violent crime. These nonpartisan statistical agencies help inform policy makers across the federal government, local governments, as well as economists and researchers around the world. Trust in them is paramount to policymaking, and eroding that trust could have great implications.

Fact-checking a politician's data use | Viral Hooks