Viral Hooks
Trending short videosAnimated graph shows body aging
R

@rehealth.my

Instagram · Faceless
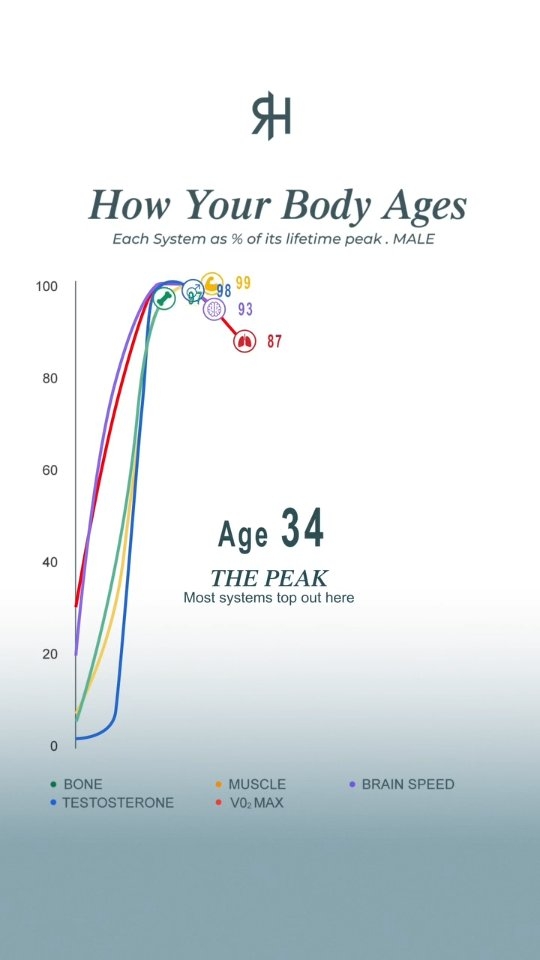
@rehealth.my You spend ~25 years building your body to its peak—then every system ages at a different speed. ⏳ Here’s what’s left at age 90 (% of peak) 👇 🦴 Bone Density —— 68% 💪 Muscle Mass —— 46% 🧠 Brain Speed —— 45% 🧬 Testosterone —— 37% 🫁 VO₂ Max —— 34% (declines fastest) ⚡ Key Takeaways: • Peak hits at ~30; VO₂ Max drops ~10% per decade. • Muscle loss speeds up after 60 (sarcopenia). 🔴 The Good News: Red Light Therapy, HBOT, and Targeted IV Drips boost mitochondrial energy, drive tissue repair, and protect your cellular vitality to slow down the biological clock. 🧬⚡ (Data based on population averages relative to peak values. For reference only.)

View original on Instagram

The edit1 shot · 9 text
Shots Text0:21

Performance

Views
1.6M
Likes
10K
Comments
254
Engagement
0.6%
Length · 29 Aug 2026
0:21

Video #46635 · Faceless

Animated graph shows body agingfrom @rehealth.my

[01]

Overview

The video presents an animated line graph visualizing how five different biological systems in the male body (bone, testosterone, muscle, VO2 max, brain speed) change over a lifetime. It progresses chronologically from age 2 to 90, showing each system's value as a percentage of its lifetime peak, and uses text overlays to highlight key phases like puberty, the peak around age 30, and the subsequent decline.

[02]

Simple outline

  1. 1Establish initial state
  2. 2Visualize rapid growth
  3. 3Identify the peak moment
  4. 4Visualize accelerating decline
  5. 5Reveal the final state

[03]

Related videos

[04]

Classification

Format
Concepts
Evolution Showcase
Elements
Motion GraphicsData Visualization GraphicText OverlayTitle Text Hook

[05]

Hook analysis

What stops the scroll in the first 3 seconds

Title hook · 70%

How Your Body Ages

Visual hook · 30%

The video opens with an animated line graph in motion. The immediate movement of the colorful lines and updating numerical data points creates a dynamic and engaging visual that draws the viewer in to see the progression.

[06]

Hook template

Steal this for your own video

How Your [thing that changes over time] [changes/peaks/declines]

  • — How Your Money Grows (and Shrinks)
  • — How Your Attention Span Decays
  • — How Your Skin Changes

[07]

Hook and payoff

The promise the opener makes, and how the video pays it back

Hook

Immediately present a relatable, high-stakes topic (e.g., 'How Your Body Ages') and show the starting point of a data journey, creating instant curiosity about the progression and final outcome.

Payoff

A static final frame that clearly displays the end-state of all tracked variables, providing a conclusive and memorable summary of the entire lifecycle journey.

[08]

Narrative framework

The structural pattern this video runs on

Framework

The Lifecycle Data Story

Visualizing the complete lifecycle of multiple related metrics over a single variable (like time or age). The narrative follows a classic arc: a rapid rise, a defined peak, and a subsequent decline, culminating in a final, impactful snapshot.

  1. 1

    The Baseline Establishment

    Introduce the visual framework, the variables being tracked, and their values at the very beginning of the timeline (e.g., Age 2).

  2. 2

    The Growth Montage

    Rapidly animate the progression of time, showing all variables climbing towards their maximum potential. This phase builds momentum and anticipation for the peak.

  3. 3

    The Summit Declaration

    The animation slows or pauses as the variables reach their highest point. A prominent text overlay explicitly labels this moment as 'THE PEAK,' serving as the story's climax.

  4. 4

    The Gentle Descent

    Show the initial, slow decline of the variables immediately following the peak, creating a transition from growth to decay.

  5. 5

    The Tipping Point

    Visually and textually signal an acceleration in the decline. A text overlay (e.g., 'DECLINE') marks this new phase, shifting the narrative's emotional tone.

  6. 6

    The Final Snapshot

    The animation concludes at a terminal point in time, holding on a static view of the final values for each variable. This provides a clear, conclusive, and memorable takeaway.

Themes

  • Aging
  • Human Biology
  • Health & Wellness
  • Lifecycle

Techniques

  • Data Visualization
  • Motion Graphics
  • Animation

Post caption

You spend ~25 years building your body to its peak—then every system ages at a different speed. ⏳ Here’s what’s left at age 90 (% of peak) 👇 🦴 Bone Density —— 68% 💪 Muscle Mass —— 46% 🧠 Brain Speed —— 45% 🧬 Testosterone —— 37% 🫁 VO₂ Max —— 34% (declines fastest) ⚡ Key Takeaways: • Peak hits at ~30; VO₂ Max drops ~10% per decade. • Muscle loss speeds up after 60 (sarcopenia). 🔴 The Good News: Red Light Therapy, HBOT, and Targeted IV Drips boost mitochondrial energy, drive tissue repair, and protect your cellular vitality to slow down the biological clock. 🧬⚡ (Data based on population averages relative to peak values. For reference only.)

Text overlays

  • branding · throughout

    RH

  • title · beginning

    How Your Body Ages

  • informational · beginning

    Each System as % of its lifetime peak. MALE

  • contextual · beginning

    Age 2

  • informational · middle

    PUBERTY Systems ramp up fast

  • informational · middle

    THE PEAK Most systems top out here

  • informational · middle

    DECLINE SEPPDDS UP Muscle & fitness fall faster

  • contextual · end

    Age 90

  • informational · throughout

    BONE • TESTOSTERONE • MUSCLE • VO2 MAX • BRAIN SPEED