@everythingplotted
Instagram · Single Photo
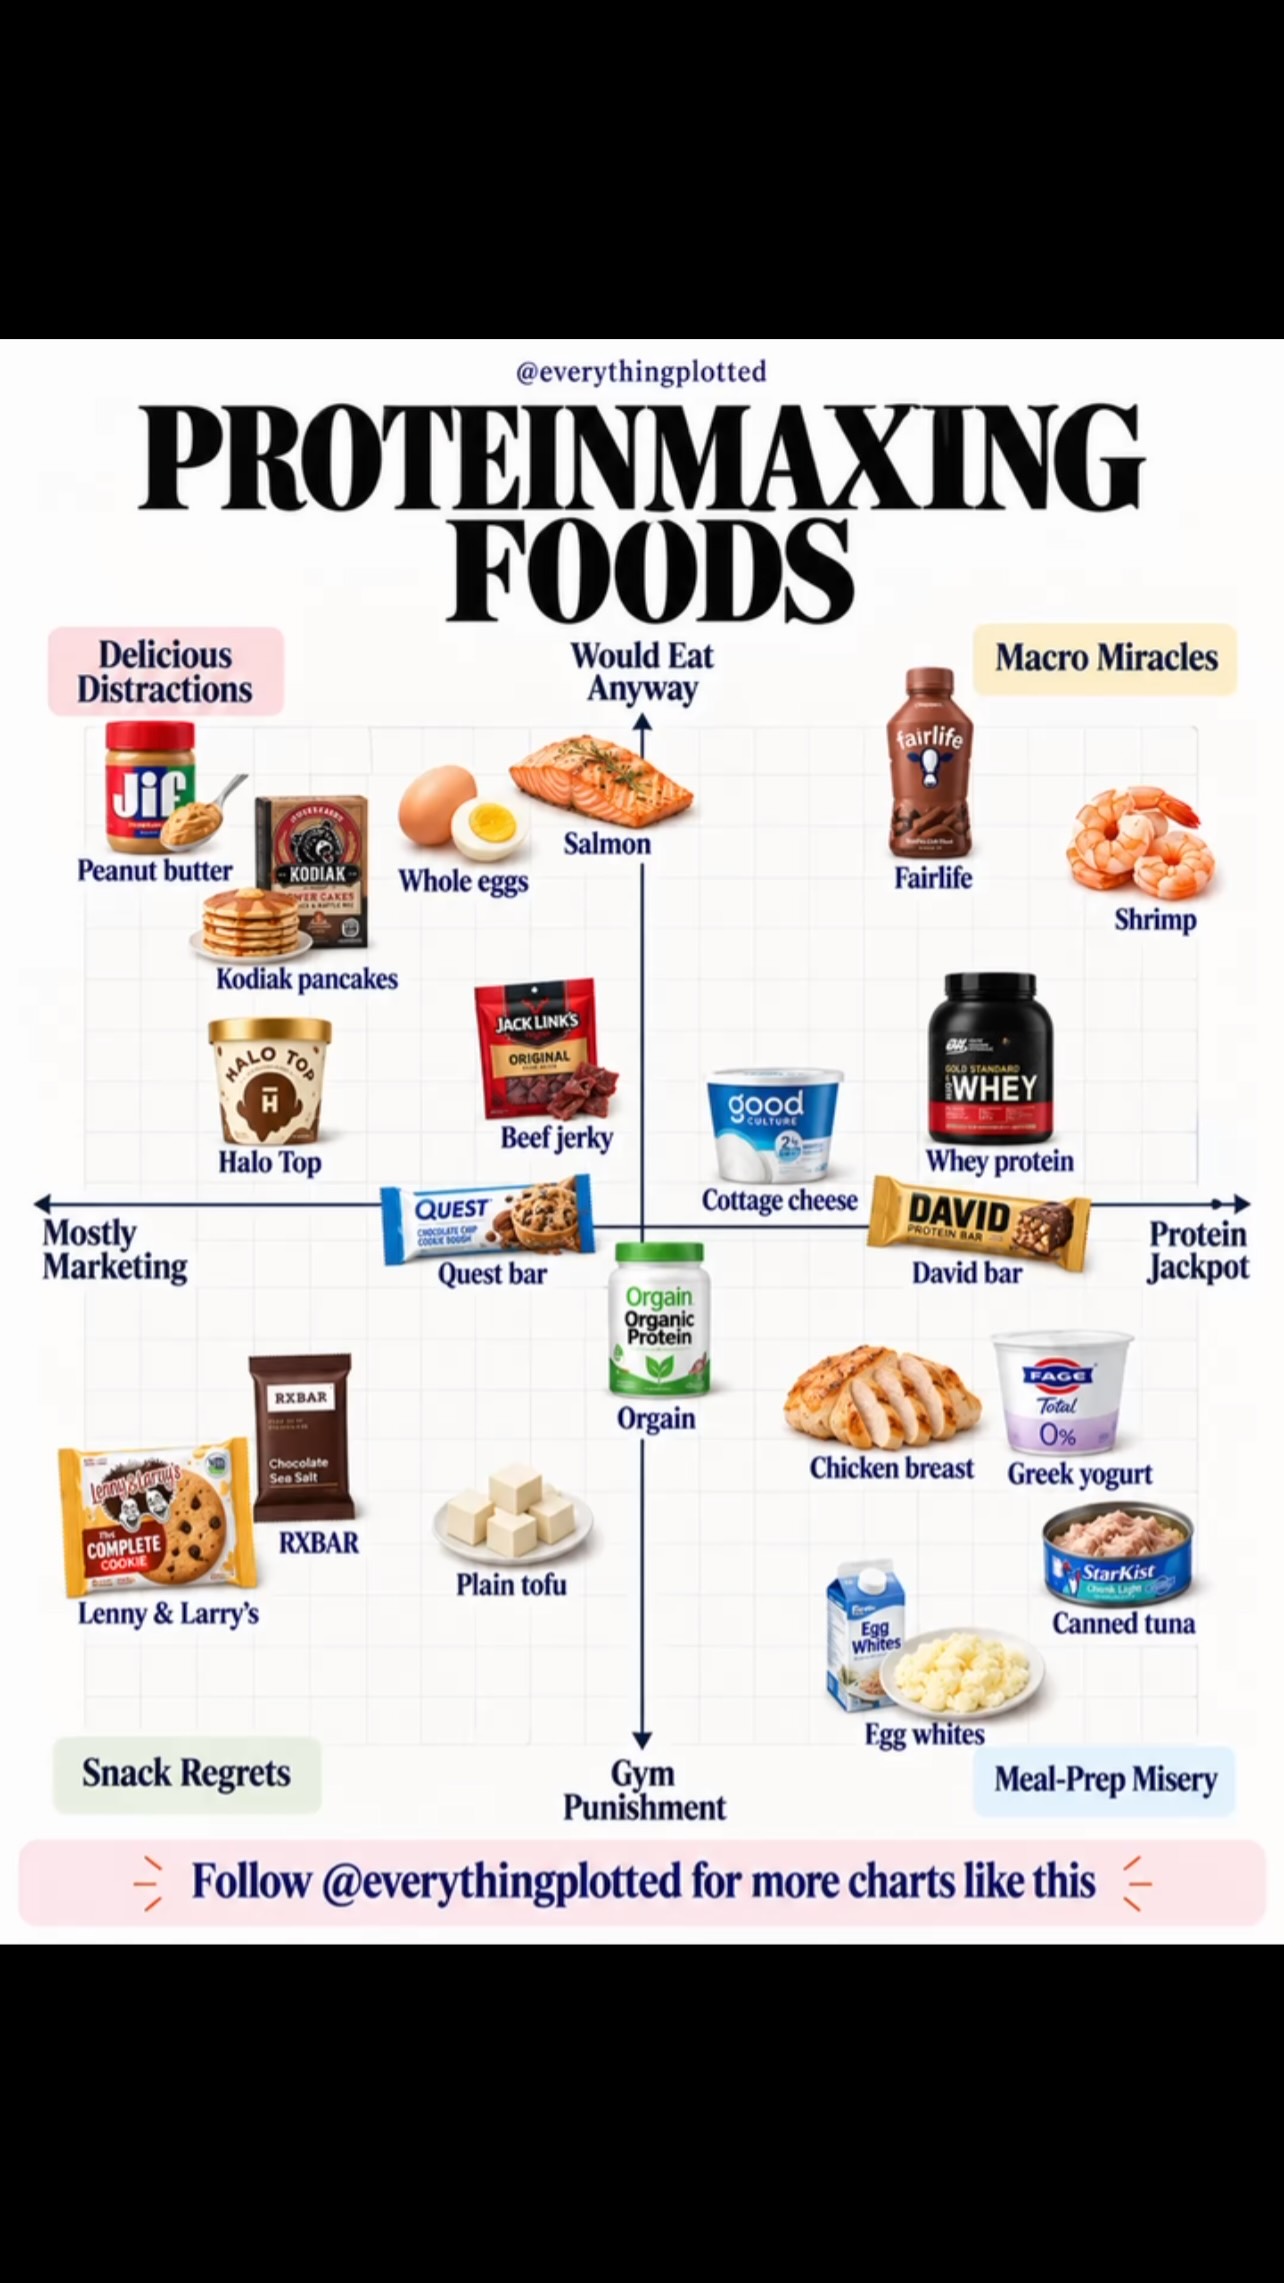
@everythingplotted Which food am I misplacing? Proteinmaxxing foods, plotted by protein per calorie × taste. Follow @everythingplotted for more charts like these. #protein

@everythingplotted
Instagram · Single Photo
@everythingplotted Which food am I misplacing? Proteinmaxxing foods, plotted by protein per calorie × taste. Follow @everythingplotted for more charts like these. #protein
Performance
Video #47466 · Single Photo
[01]
The creator presents a static 2x2 matrix chart titled 'Proteinmaxing Foods'. The chart visually ranks various food products based on two axes: one ranging from 'Mostly Marketing' to 'Protein Jackpot' and the other from 'Gym Punishment' to 'Would Eat Anyway'. The video holds on this single graphic, allowing viewers to analyze the placement of items like chicken breast, whey protein, and protein bars, concluding with a call to follow the account for similar content.
[02]
[03]
 452.2K22.2×Rapid list of weight loss meals@pearse_thealphadad · Rapid Fire Listicle
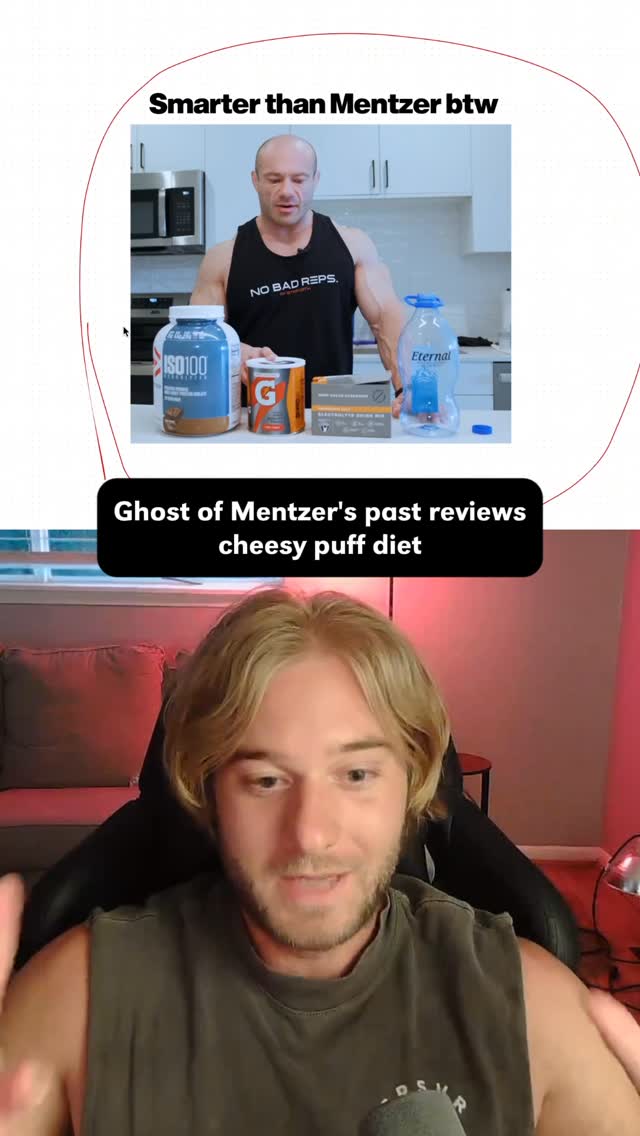 444K31.6×Sarcastic breakdown of influencer's diet@reecebrah · Reaction
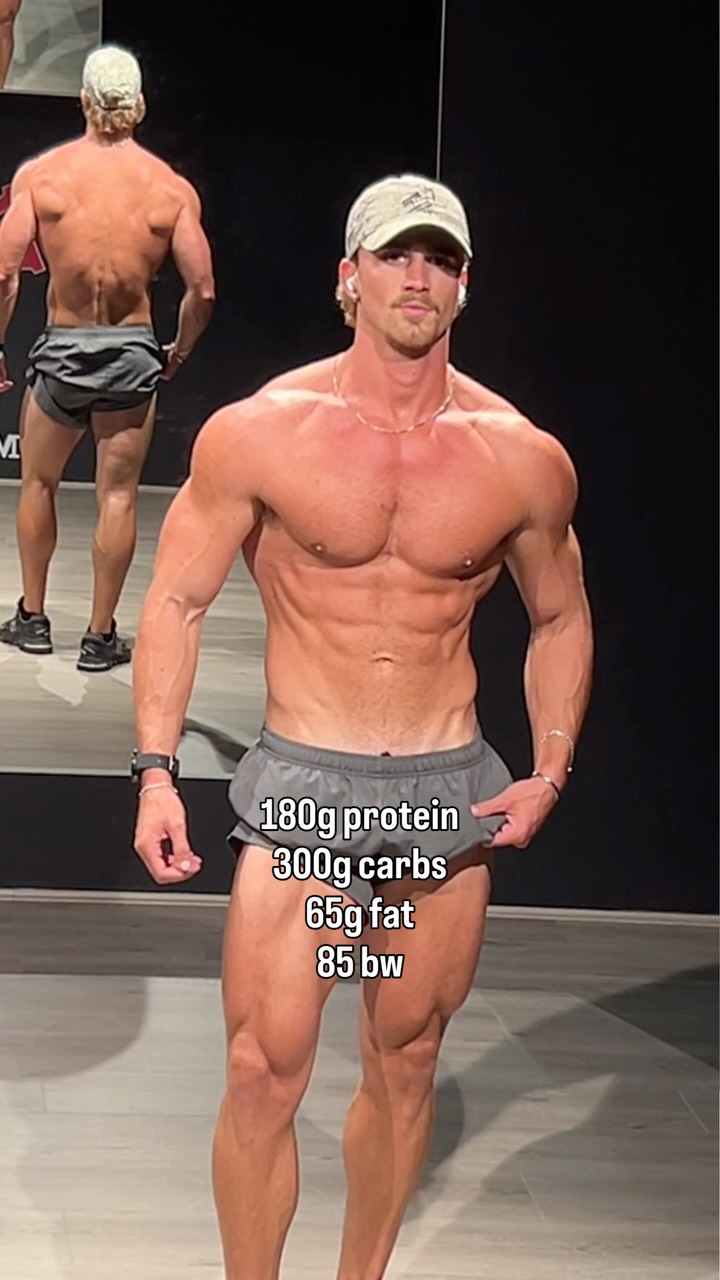 197.4K60.3×Physique change with same weight@lachiecubis · Before/After Transformation
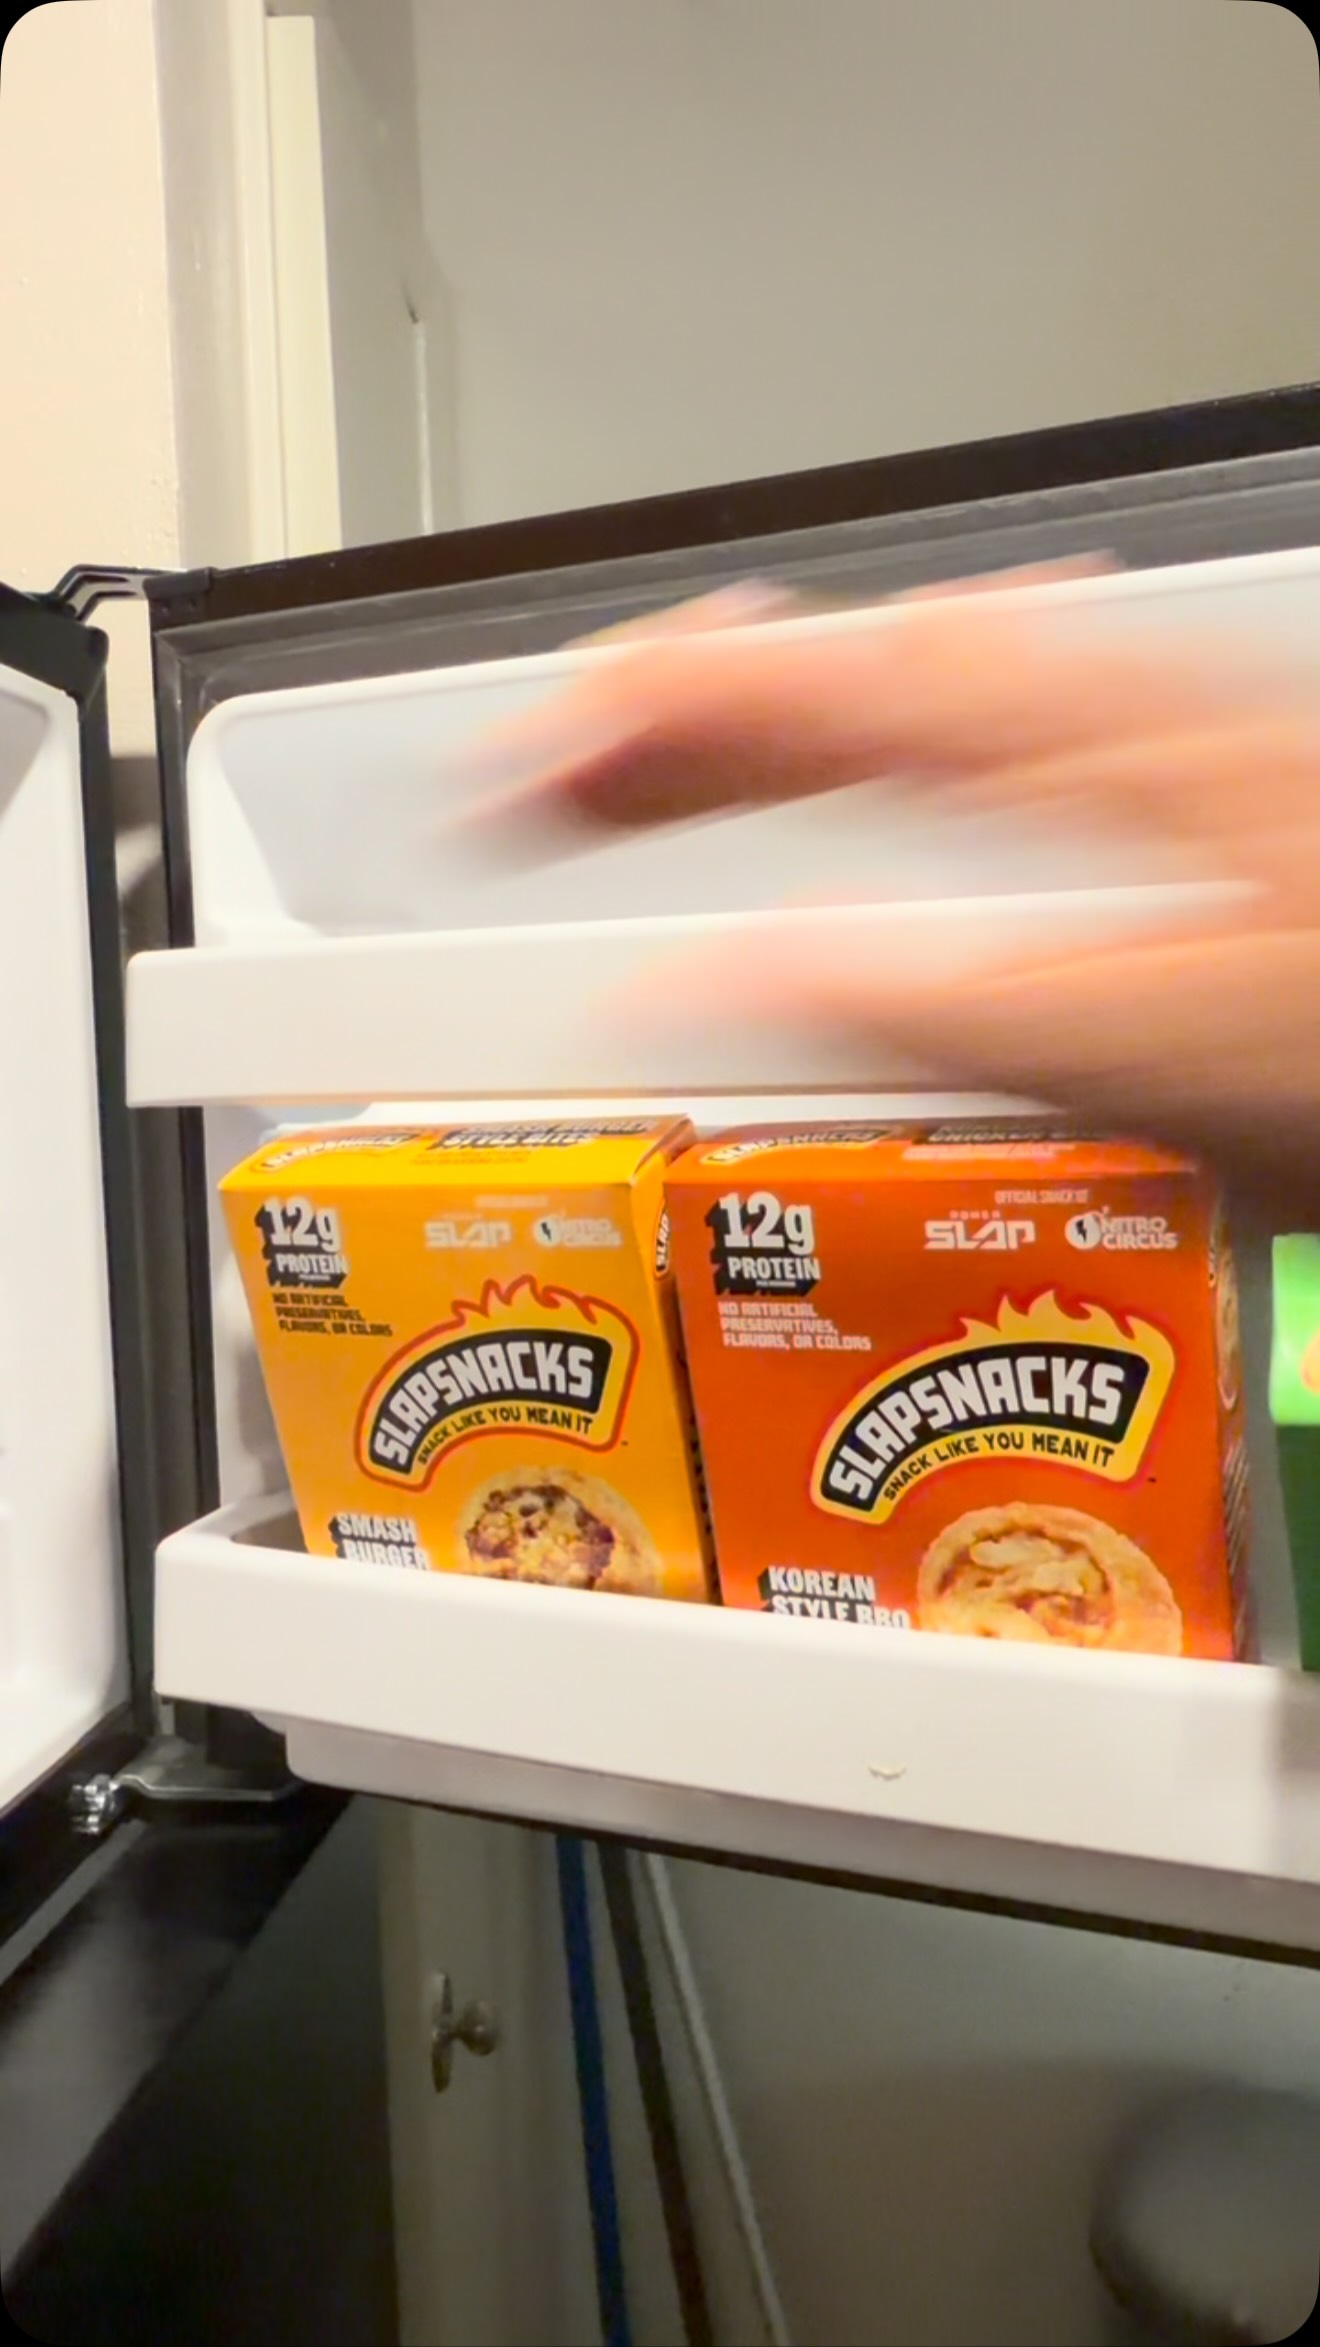 831.6K6.5×Presents fitness problem, offers product solution@_devontewest · Product Promo
 150.1K14.9×Split screen fasted training explainer@reecebrah · Breakdown
 767.2K7.1×Realistic health guide for busy people@coachkyle · Playbook
 702.1K75.5×Ironic self-improvement advice with images@reecebrah · Satirical Expertise
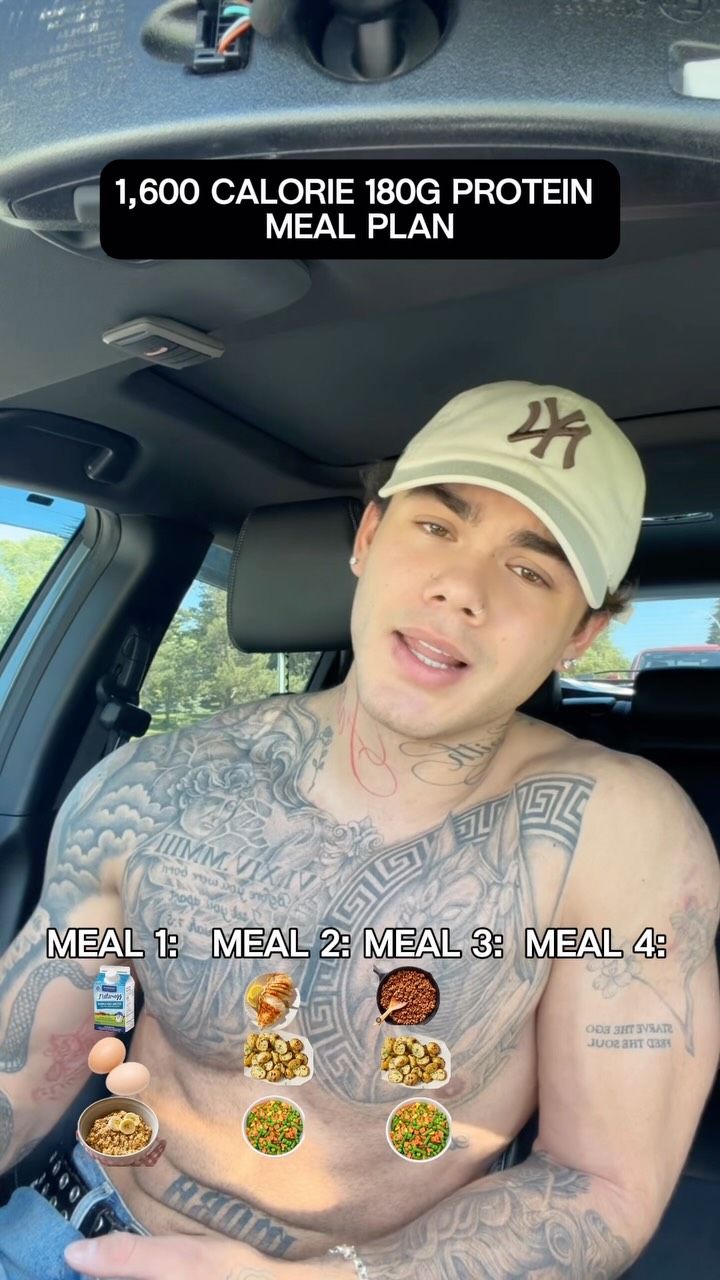 306.6K11.8×Four-meal plan for fat loss@drewsxvision · Tutorial / How To
 207.5KCreator shares four-meal fitness plan@drewsxvision · Playbook
 276.1K10.7×Fitness routine list over montage@drewsxvision
 178K3.5×Rapid fire good vs bad products.@rello_2xx · Rapid Fire Listicle
 2.6M136.6×Rapid fire fitness tips screenshots@thomasmalucelli · Rapid Fire Listicle
[04]
[05]
What stops the scroll in the first 3 seconds
Title hook · 55%
PROTEINMAXING FOODS
Visual hook · 45%
A colorful, data-rich 2x2 matrix chart plotting various familiar food products, which immediately invites viewers to locate items they recognize and analyze their rankings.
[06]
Steal this for your own video
MAXING
[07]
The promise the opener makes, and how the video pays it back
Hook
An immediate presentation of a visually dense, authoritative-looking chart that promises to classify a set of familiar items according to a novel, opinionated framework.
Payoff
The viewer experiences a moment of cognitive satisfaction by understanding the classification system and an emotional reaction (validation or disagreement) to the placement of specific items, which strongly motivates engagement through comments and shares.
[08]
The structural pattern this video runs on
Framework
The 2x2 Judgment Matrix
Classifying a set of familiar items on a two-axis grid where each axis represents a value judgment (e.g., taste, cost, effectiveness). This creates four distinct, opinionated quadrants that categorize the items in a humorous or controversial way, encouraging viewer agreement or debate.
The Governing Thesis
A large, central title immediately establishes the subject matter being categorized, setting the context for the entire visual.
The Axes of Judgment
Two perpendicular axes are presented, each labeled with opposing values (e.g., Good to Bad, Cheap to Expensive), which define the criteria for classification.
The Quadrant Verdicts
The four quadrants created by the axes are given distinct, highly opinionated, and often humorous names that act as summary judgments for any item falling within them.
The Relatability Scatterplot
Numerous recognizable items, products, or concepts are visually plotted across the matrix, inviting the viewer to scan, locate familiar examples, and mentally process their placement within the framework.
Which food am I misplacing? Proteinmaxxing foods, plotted by protein per calorie × taste. Follow @everythingplotted for more charts like these. #protein
title · throughout
PROTEINMAXING FOODS
branding · throughout
@everythingplotted
contextual · throughout
Delicious Distractions
contextual · throughout
Would Eat Anyway
contextual · throughout
Macro Miracles
contextual · throughout
Mostly Marketing
contextual · throughout
Protein Jackpot
contextual · throughout
Snack Regrets
contextual · throughout
Gym Punishment
contextual · throughout
Meal-Prep Misery
call-to-action · throughout
Follow @everythingplotted for more charts like this