@everythingplotted
Instagram · Single Photo
@everythingplotted Who did I get wrong? Follow @everythingplotted for more charts like these.

@everythingplotted
Instagram · Single Photo
@everythingplotted Who did I get wrong? Follow @everythingplotted for more charts like these.
Performance
Video #47568 · Single Photo
[01]
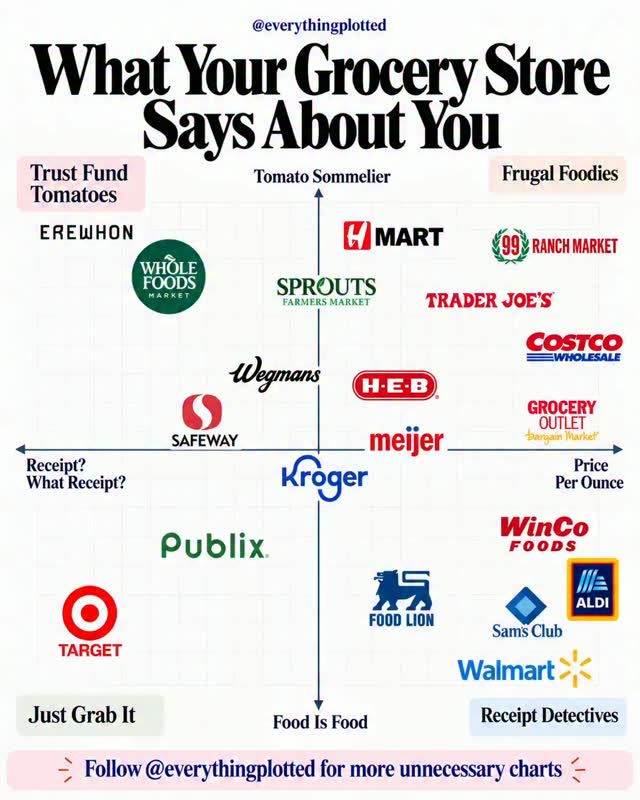
The creator displays a static 2x2 chart titled 'What Your Grocery Store Says About You.' The chart plots various grocery store logos on two axes—price consciousness versus nonchalance, and food connoisseurship versus practicality—to assign humorous stereotypes to shoppers, inviting viewers to find their store and see how they are categorized.
[02]
[03]
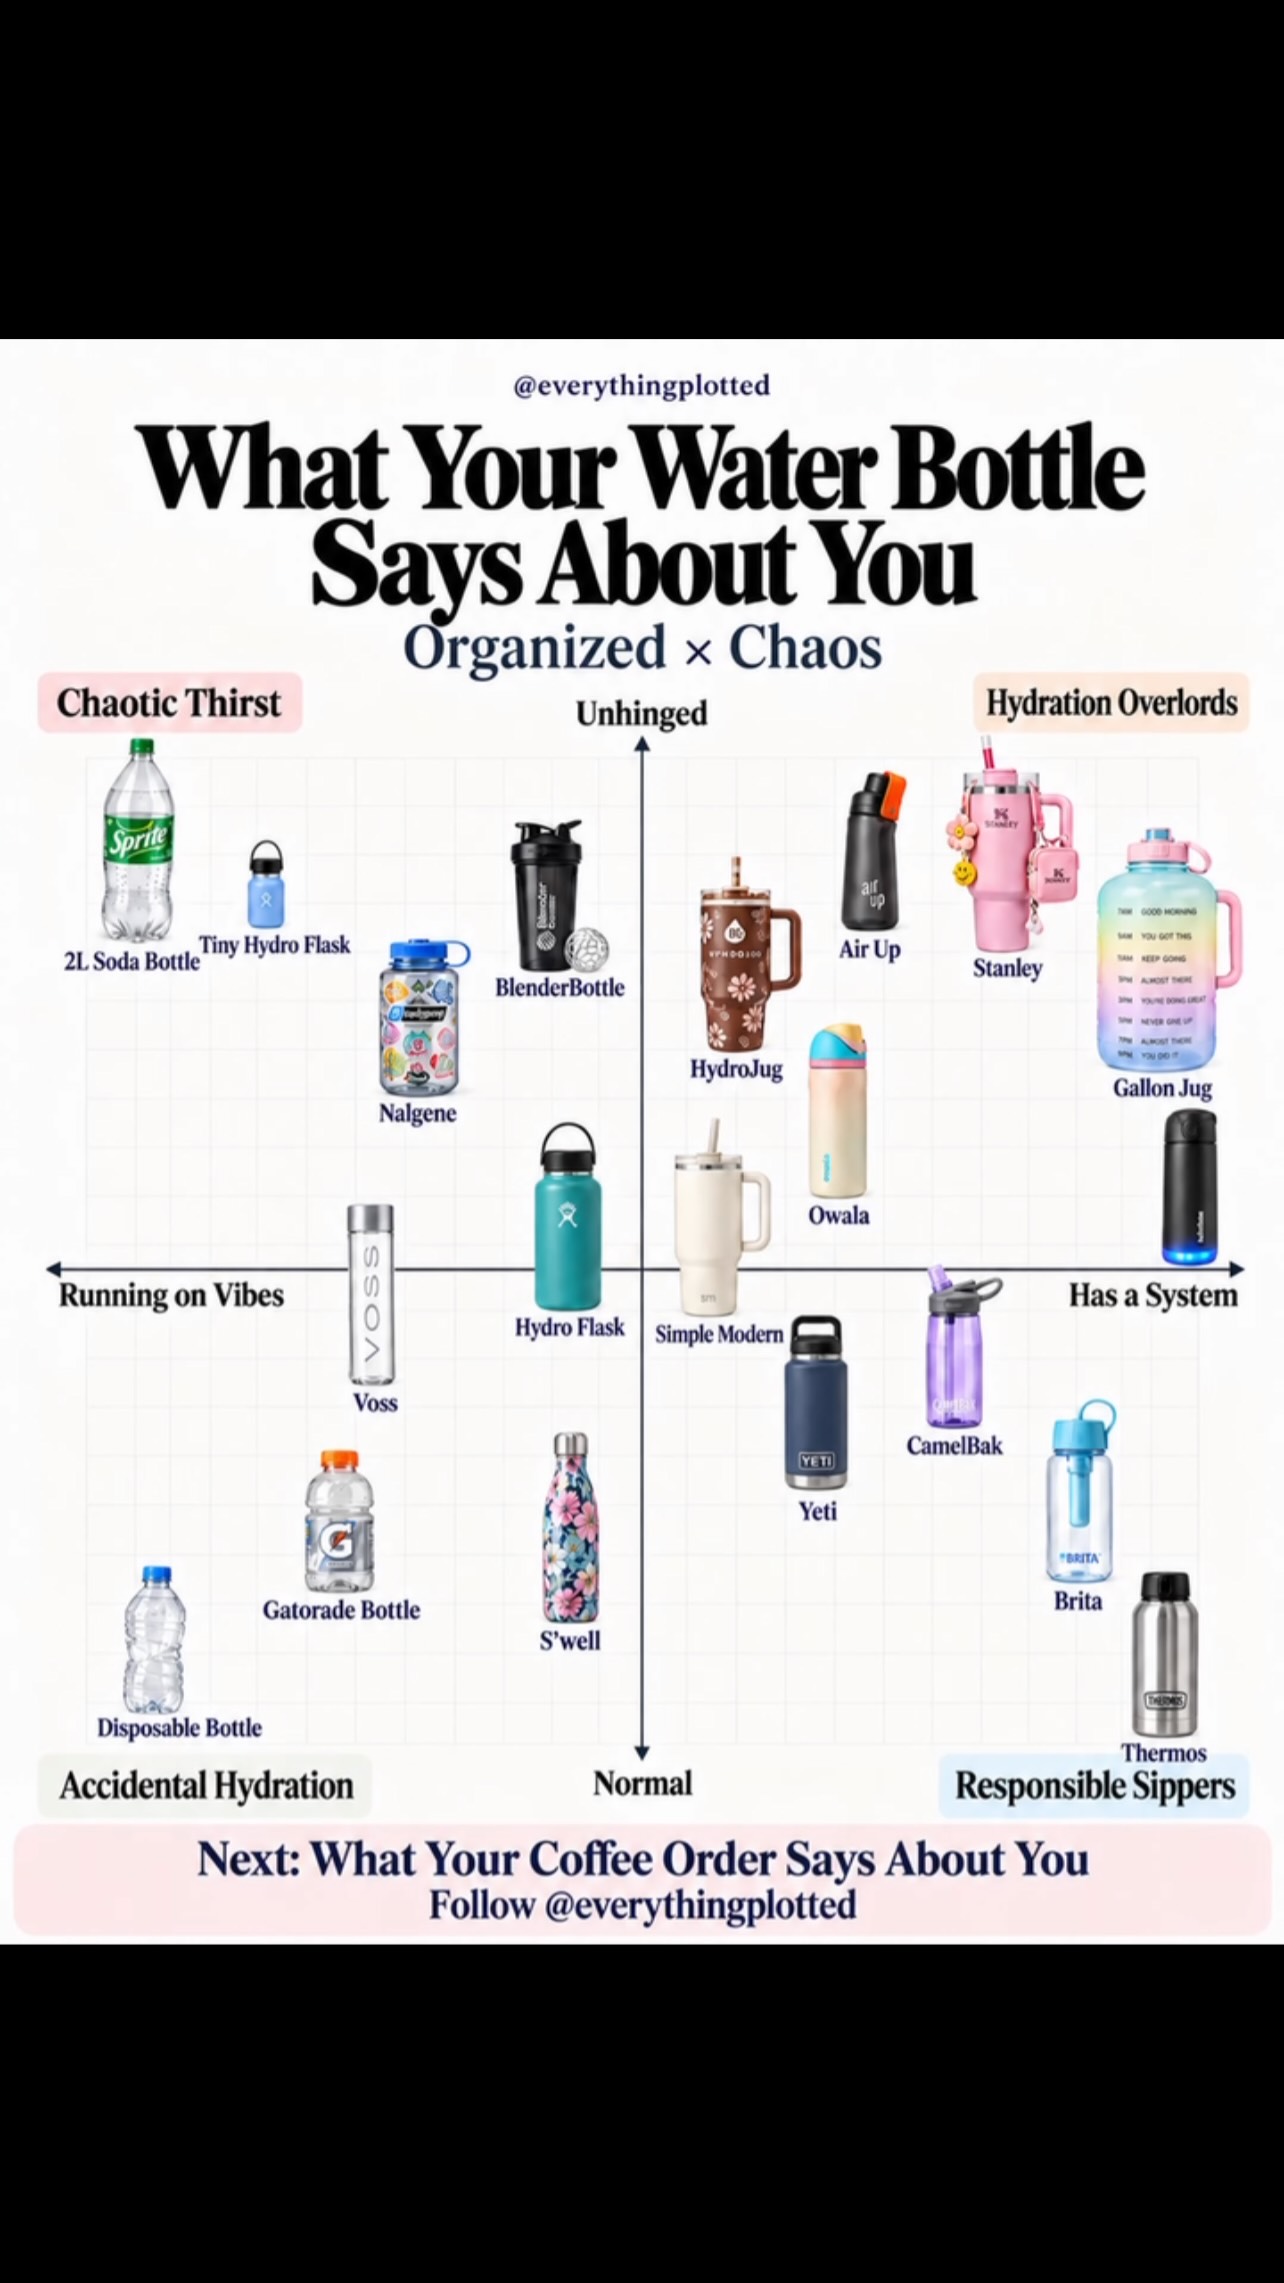 1.8M44.4×Personality chart based on water bottles@everythingplotted · What Your X Says About You
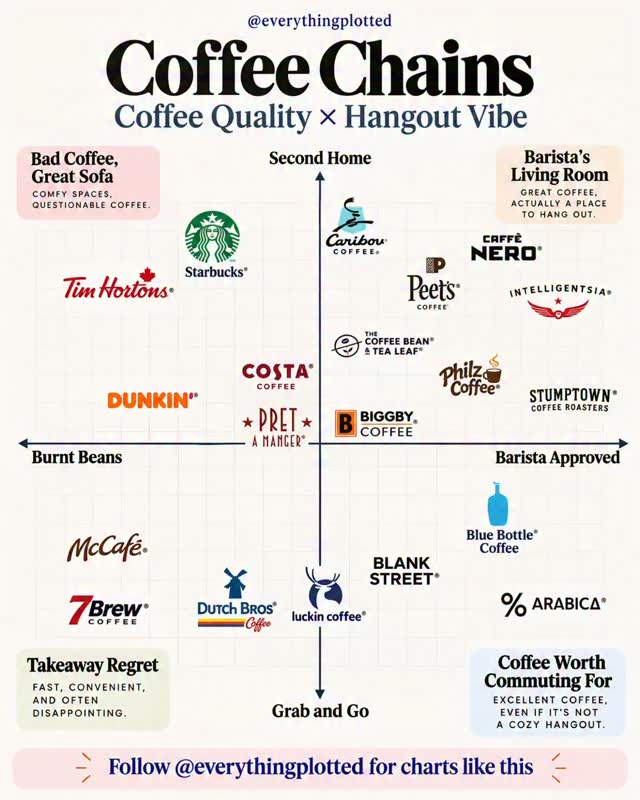 740K29.1×Coffee chain quality matrix chart@everythingplotted · Expert Rate/Rank
 153.4K2.5×Comparing grocery items for abs@rello_2xx · Good vs Bad
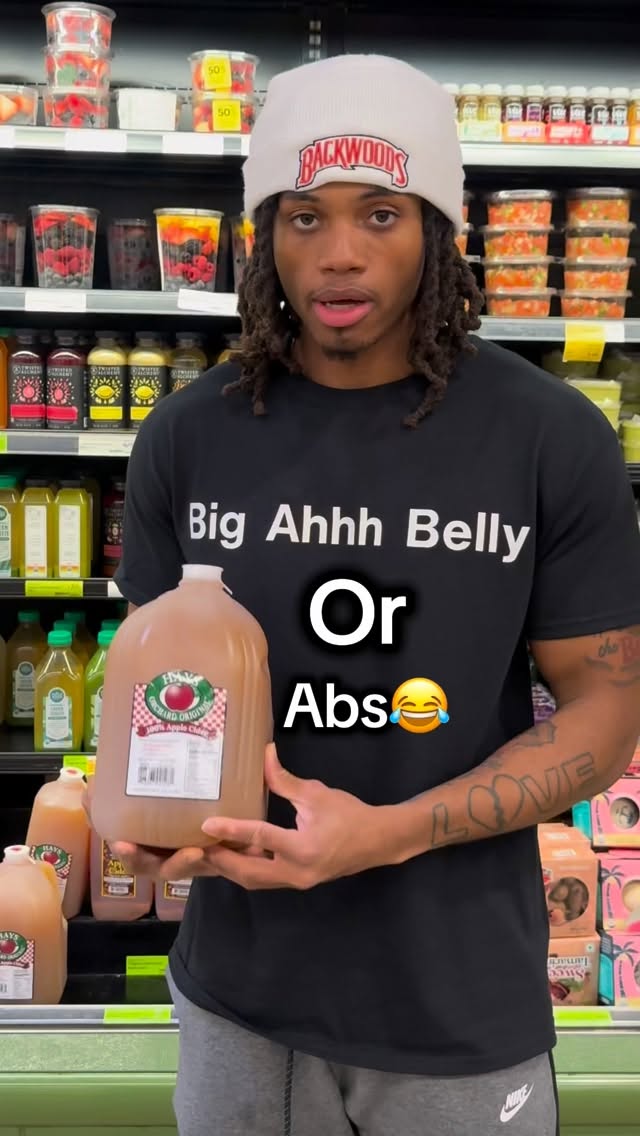 790.1K13×Rapid fire good vs bad foods@rello_2xx · Good vs Bad
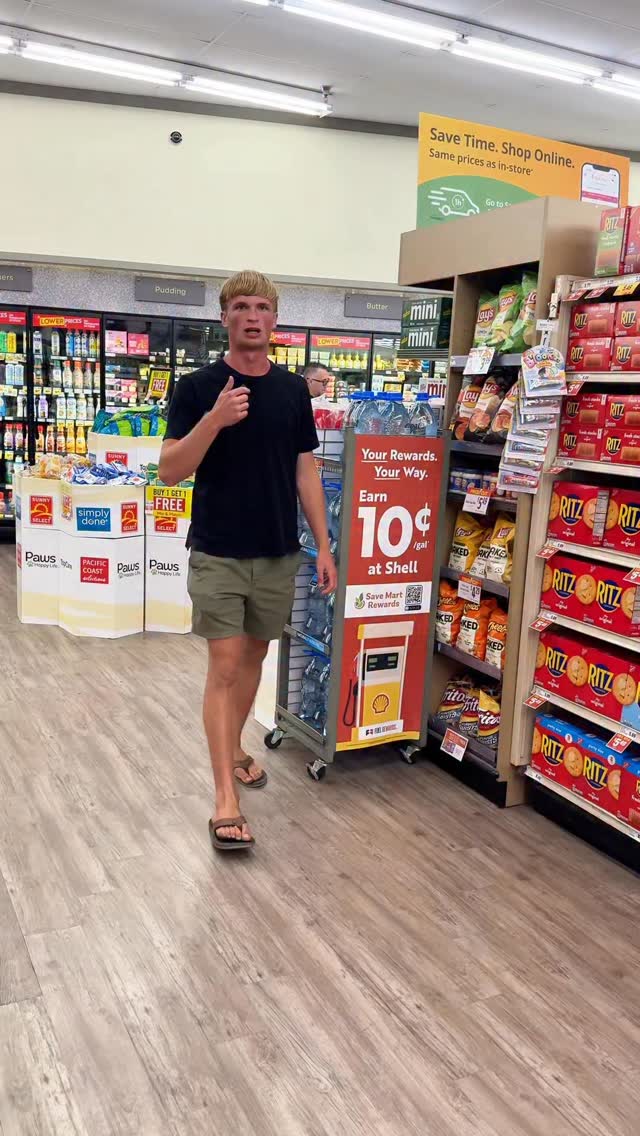 365.3K47.5×Grocery store food ingredient rant@holistic.grenade · Breakdown
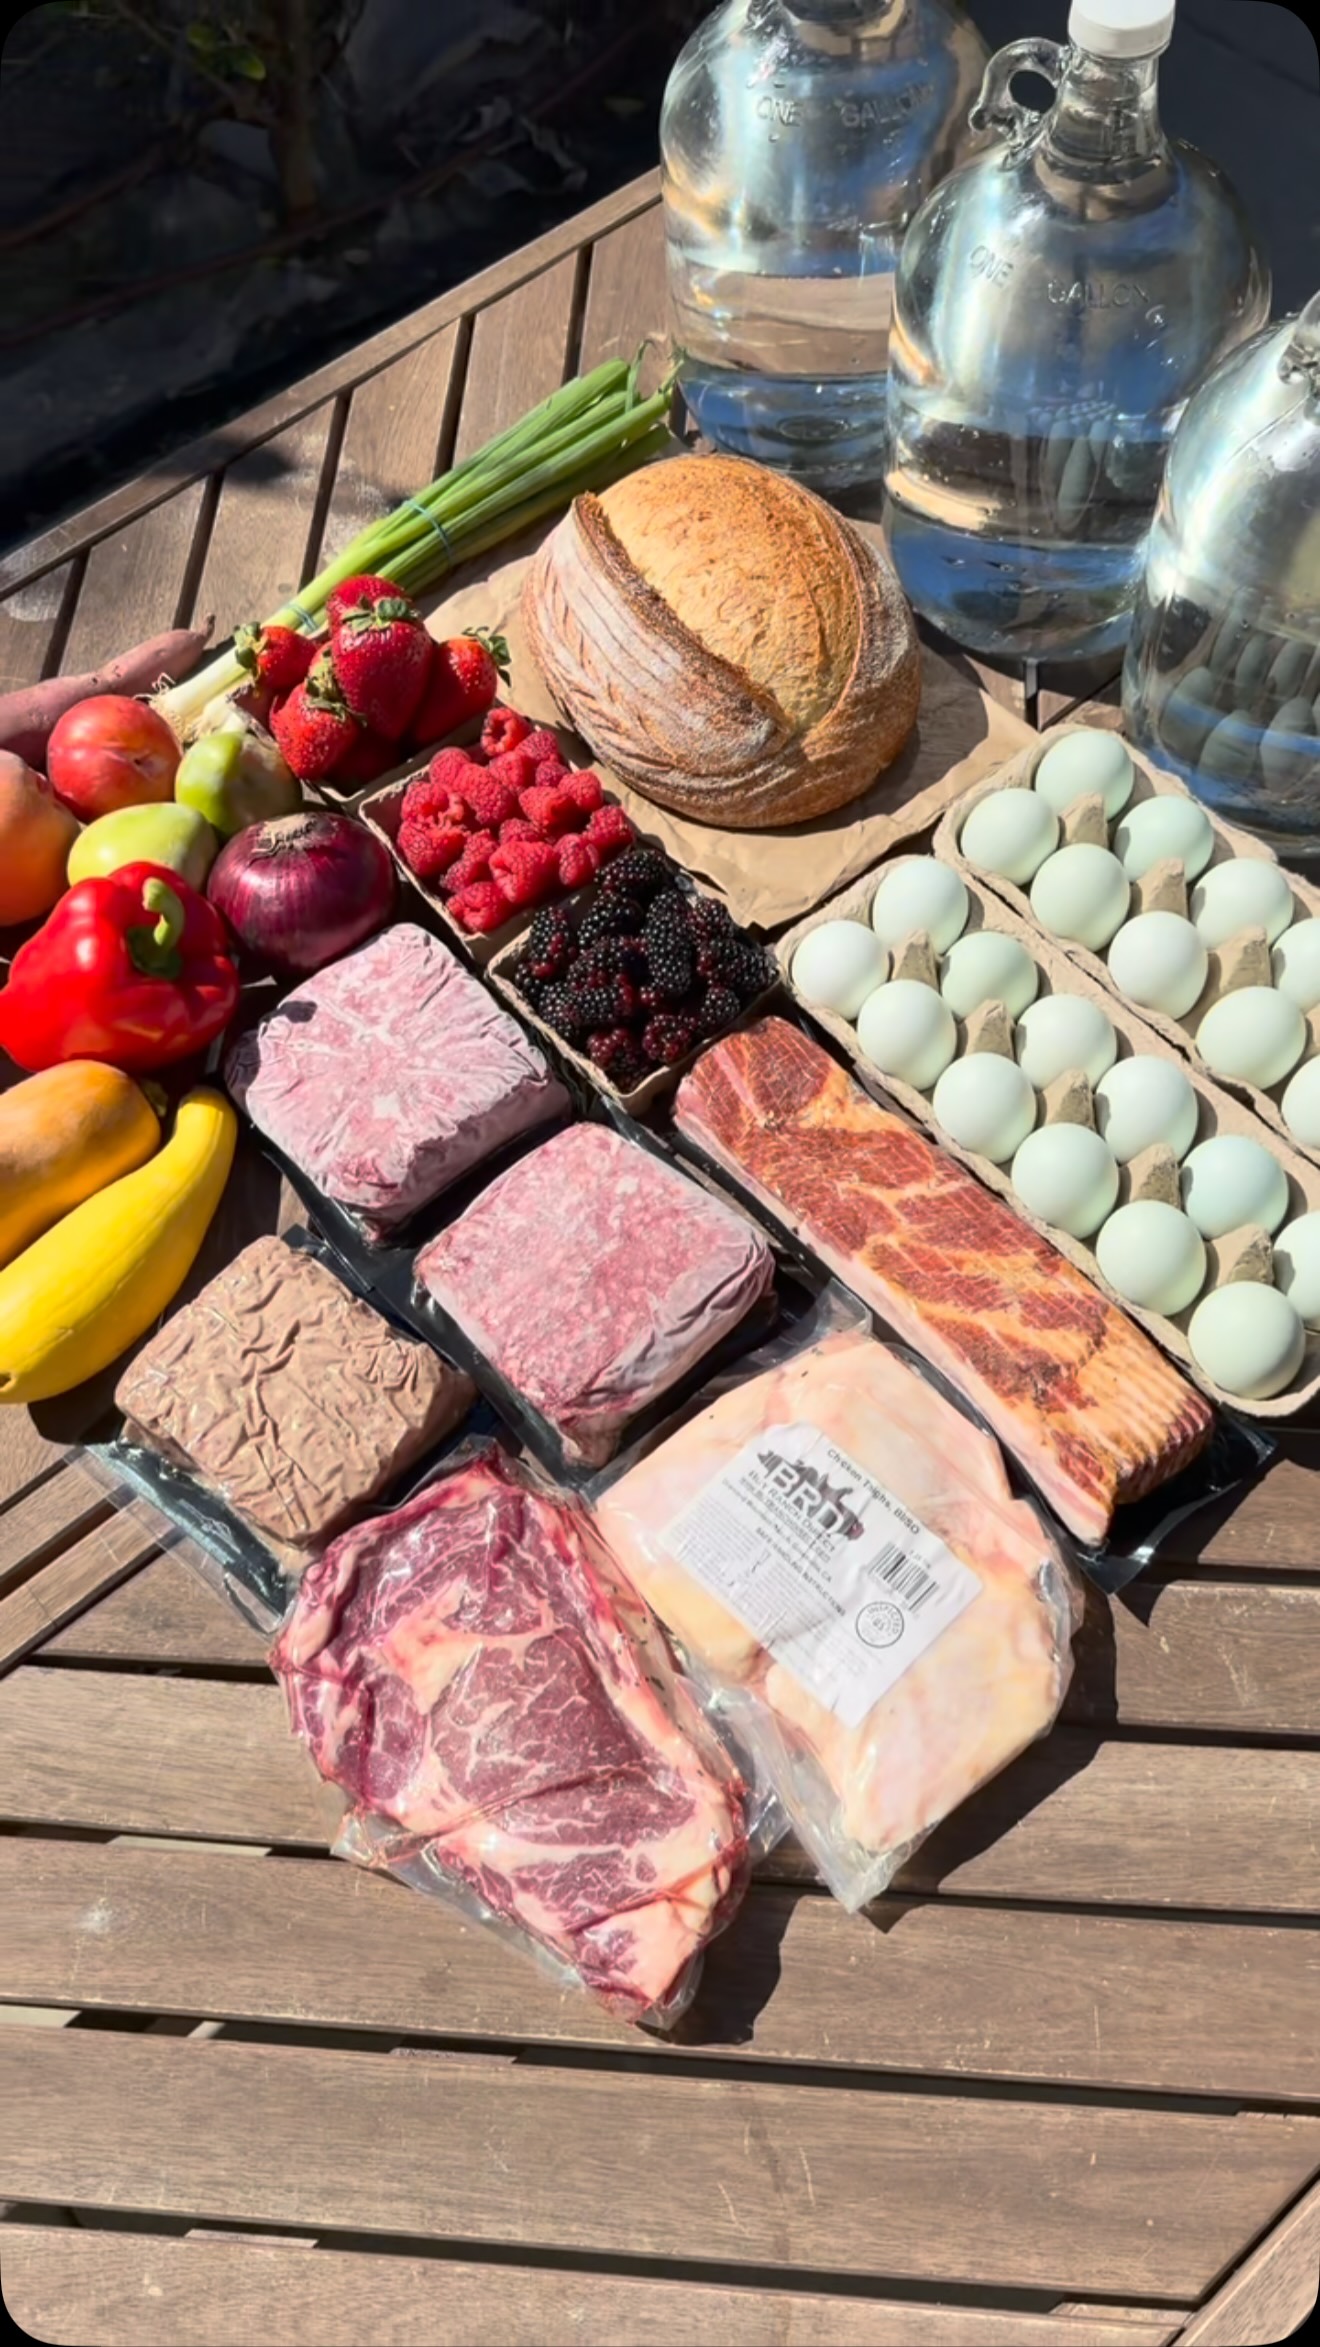 1.8M54.5×Price comparison farmers market grocery@jared1s · This or That
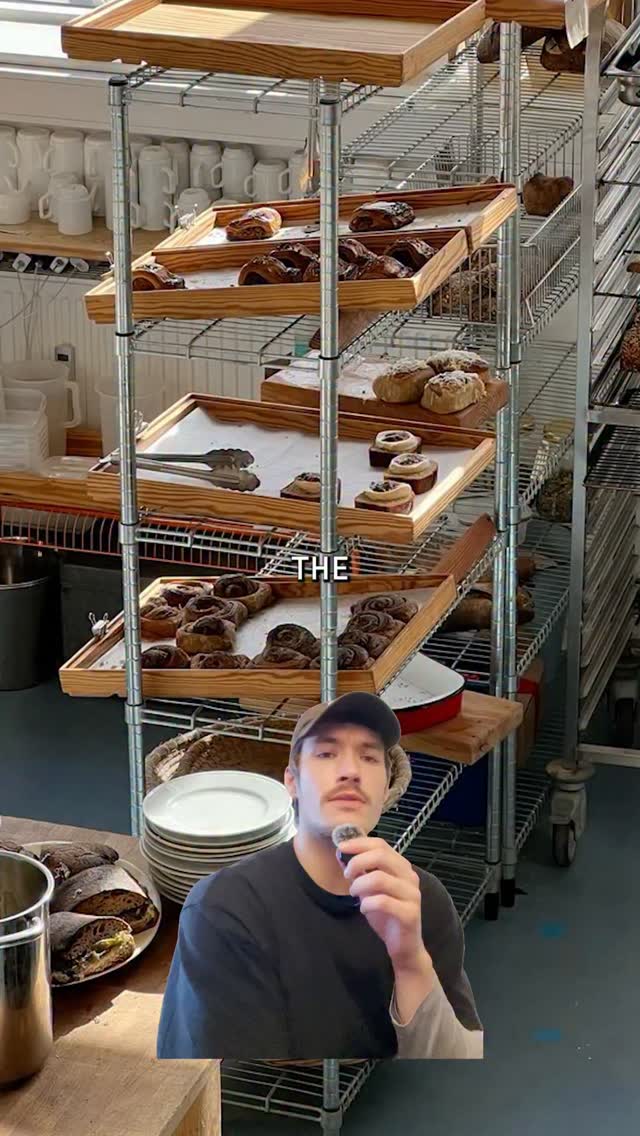 426K12.6×Greenscreen commentary on bakery aesthetics@fakeplasticbrands · Culture Profile
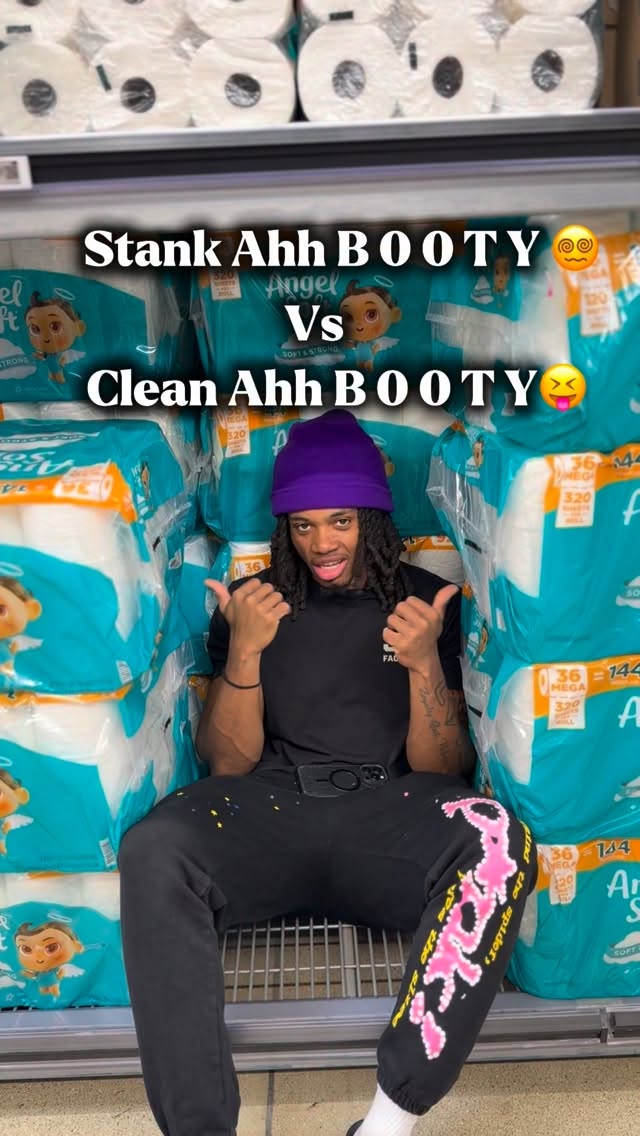 121.8K5.2×Stank vs clean product choices@rello_2xx · Good vs Bad
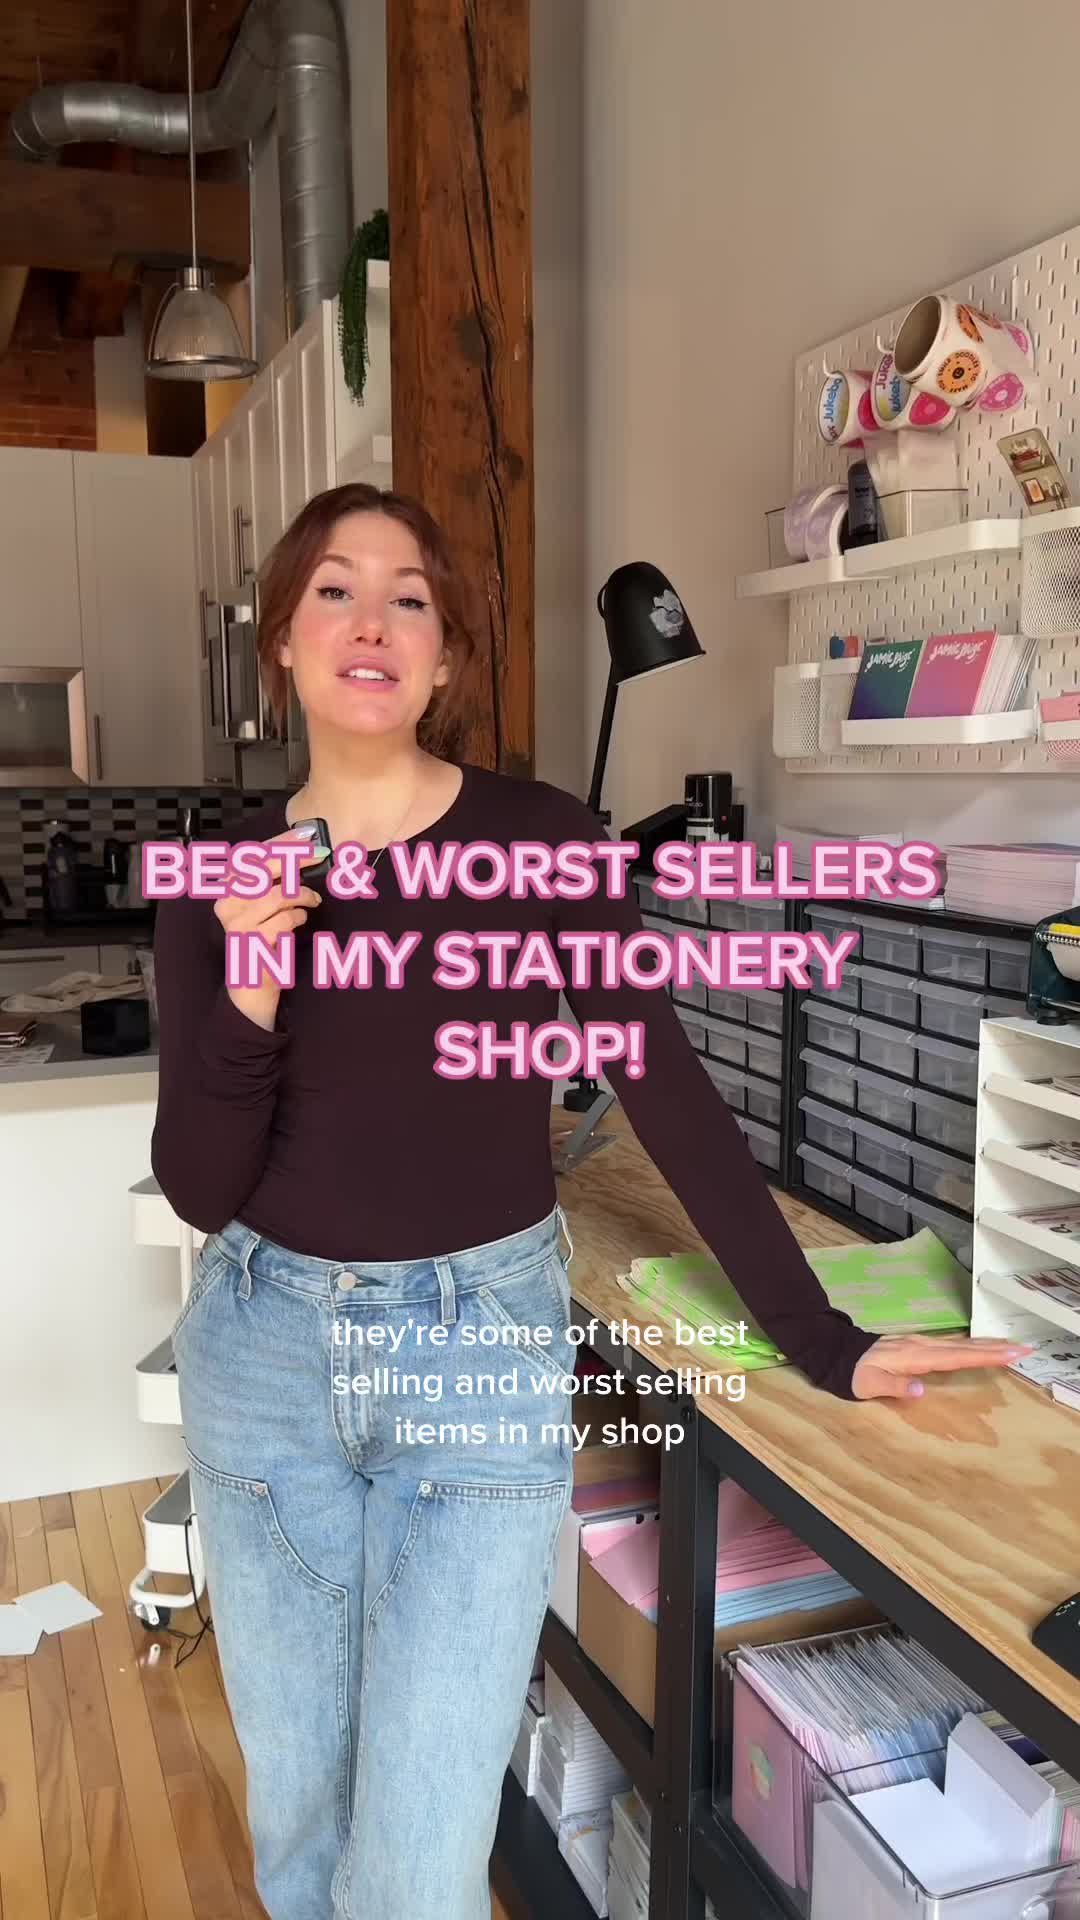 1MComparing best and worst sellers@jamiepaigedoodles · Rapid Fire Listicle
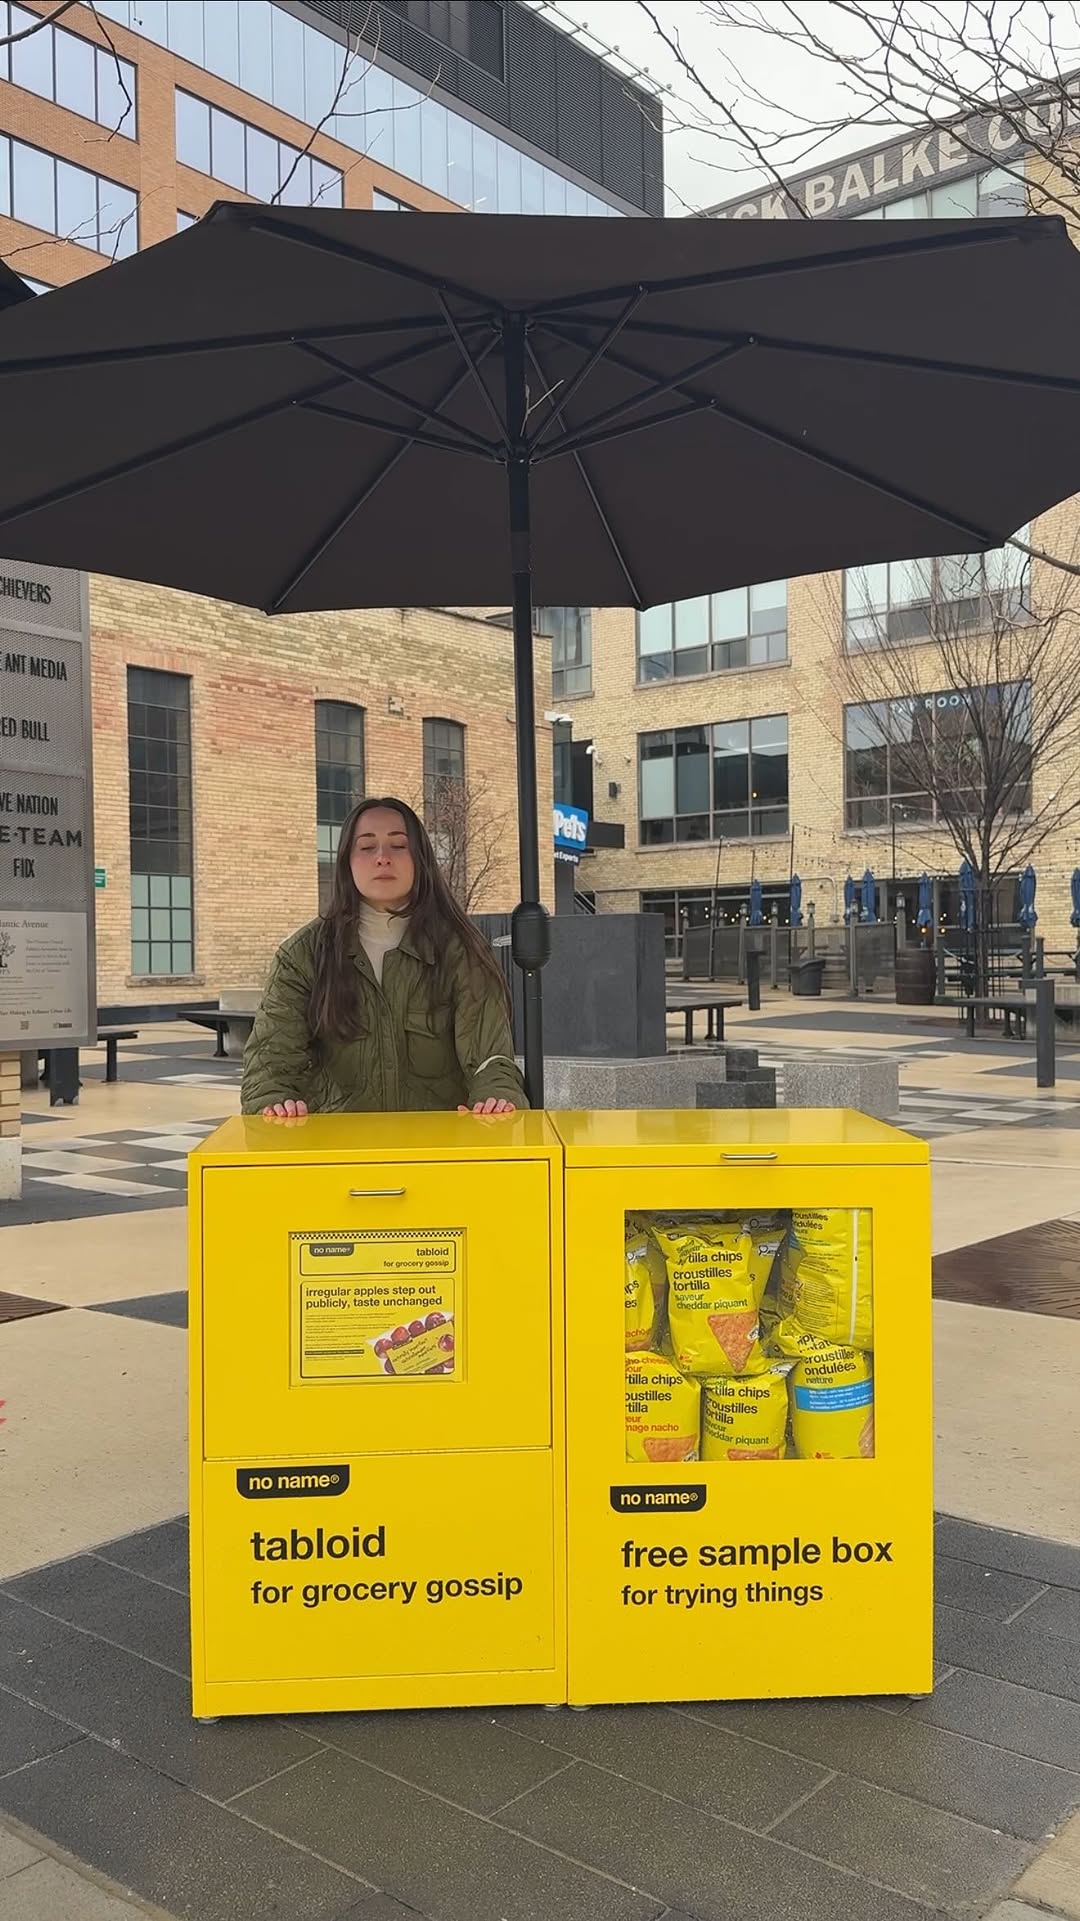 1.3M13.5×Satirical news report for brand@itslittlemich · Satirical Product Pitch
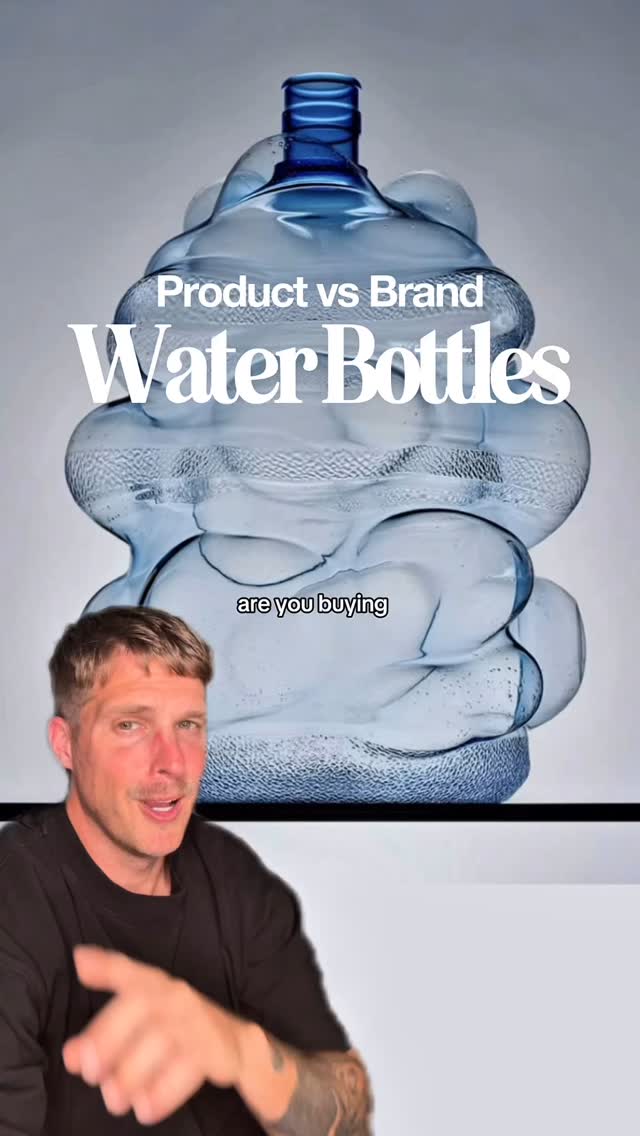 2.1M7×Rating popular water bottle brands as product buys or brand buys@orenmeetsworld · Rapid Fire Listicle
 474.9K1.3×Designer creates hypothetical fast food merch@spaceboycole · Hypothetical Case Study
[04]
[05]
What stops the scroll in the first 3 seconds
Title hook · 80%
What Your Grocery Store Says About You
Visual hook · 20%
The video opens on a colorful and densely populated 2x2 chart featuring numerous recognizable grocery store logos. This grid layout immediately invites viewers to scan the image and find their preferred store, creating instant engagement and curiosity about where it falls on the matrix.
[06]
Steal this for your own video
What Your Says About You
[07]
The promise the opener makes, and how the video pays it back
Hook
A direct, provocative title promising to reveal something about the viewer's personality based on a common choice they make (e.g., 'What Your [X] Says About You').
Payoff
The moment of self-identification, validation, or disagreement when the viewer finds their preferred item on the grid. This triggers an emotional reaction and provides the primary motivation to comment, share, or debate the placement.
[08]
The structural pattern this video runs on
Framework
The Identity Matrix
Classifying a set of common, identity-linked items (e.g., brands, products, places) on a 2x2 grid defined by two humorous or insightful spectra. This plotting creates four distinct, shareable archetypes in the quadrants, prompting viewers to find their own item and react to their assigned 'personality.'
The Spectrum Setup
Visually establish a two-axis grid. The endpoints of each axis are labeled with contrasting, often humorous, descriptors that set the criteria for judgment.
The Archetype Reveal
The four quadrants created by the axes are given catchy, stereotypical names. These names function as shorthand for the personality types associated with each area of the chart.
The Item Gauntlet
Displaying the logos or names of multiple recognizable items from the chosen category, plotted across the grid. This is the core data presentation where viewers search for their own choice.
Who did I get wrong? Follow @everythingplotted for more charts like these.
branding · throughout
@everythingplotted
title · throughout
What Your Grocery Store Says About You
contextual · throughout
Trust Fund Tomatoes
contextual · throughout
Frugal Foodies
contextual · throughout
Just Grab It
contextual · throughout
Receipt Detectives
contextual · throughout
Tomato Sommelier
contextual · throughout
Food Is Food
contextual · throughout
Receipt? What Receipt?
contextual · throughout
Price Per Ounce
call-to-action · throughout
Follow @everythingplotted for more unnecessary charts