@everythingplotted
Instagram · Single Photo
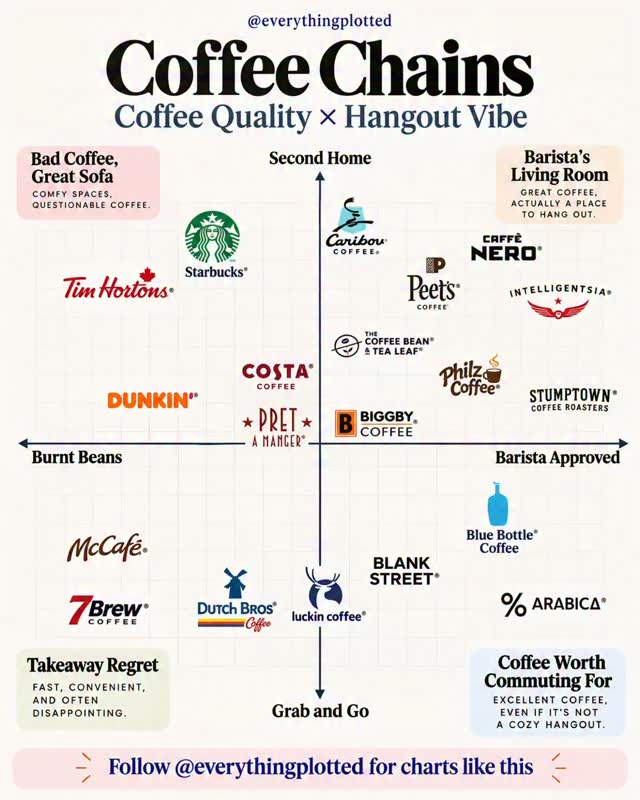
@everythingplotted Which chain did I disrespect? Coffee chains, plotted by coffee quality × hangout vibe. Follow @everythingplotted for more charts like this.

@everythingplotted
Instagram · Single Photo
@everythingplotted Which chain did I disrespect? Coffee chains, plotted by coffee quality × hangout vibe. Follow @everythingplotted for more charts like this.
Performance
Video #50386 · Single Photo
[01]
The creator presents a static 2D matrix chart that ranks popular coffee chains based on two metrics: coffee quality and hangout vibe. The chart categorizes well-known brands into four humorous quadrants, ranging from 'Takeaway Regret' to 'Barista's Living Room', providing a satirical but relatable visual analysis of the coffee industry for viewers to read and debate.
[02]
[03]
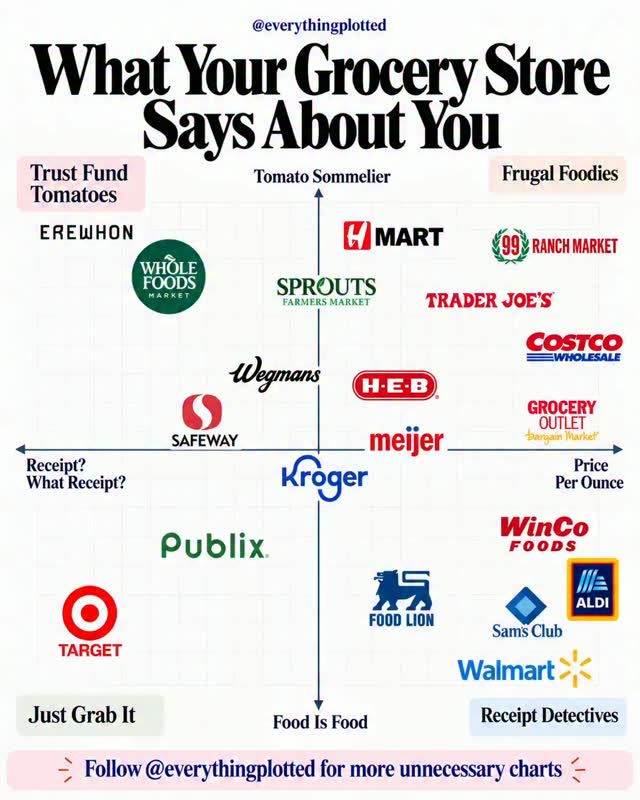 1.1M32.6×Grocery store personality chart graphic@everythingplotted · What Your X Says About You
 1.9M71.2×Analyzing coffee shop design evolution.@orenmeetsworld · Breakdown
 286.4K15.3×Rating designer coffee machine collabs@clayton.chambrs · Rapid Fire Listicle
 529.1K1.9×Analyzing coffee shop design history@orenmeetsworld · Breakdown
 133.7K2.6×Showcasing unique coffee packaging designs@clayton.chambrs · Rapid Fire Listicle
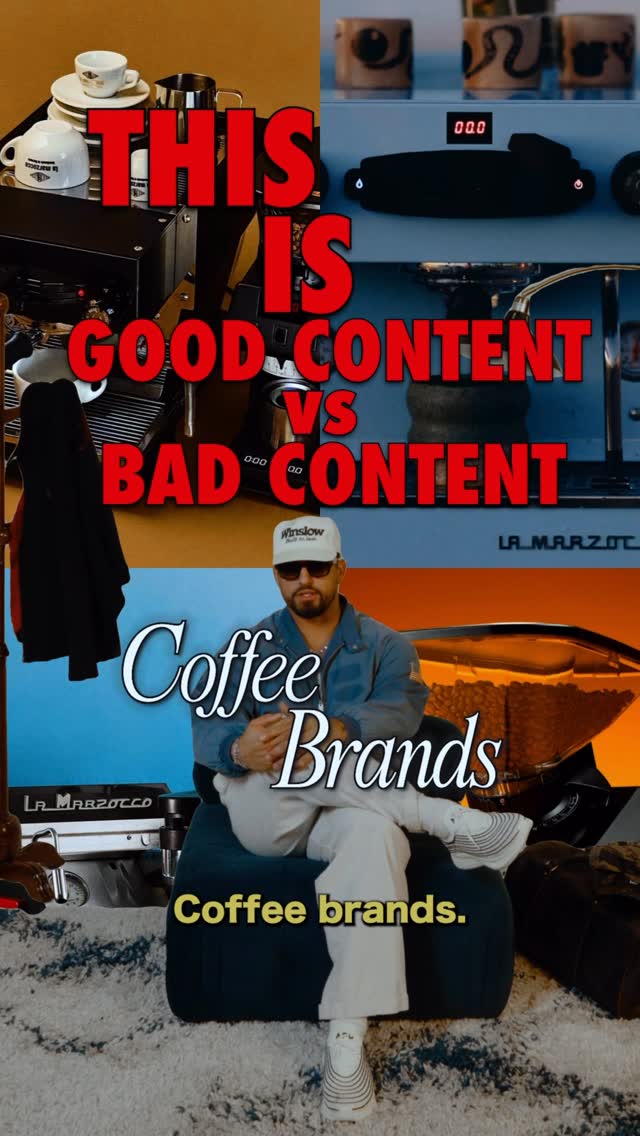 172.4K1.9×Comparing good vs bad content@house.of.ag · Good vs Bad
 2.4M8.1×Espresso machines rated as product vs brand buys@orenmeetsworld · Rapid Fire Listicle
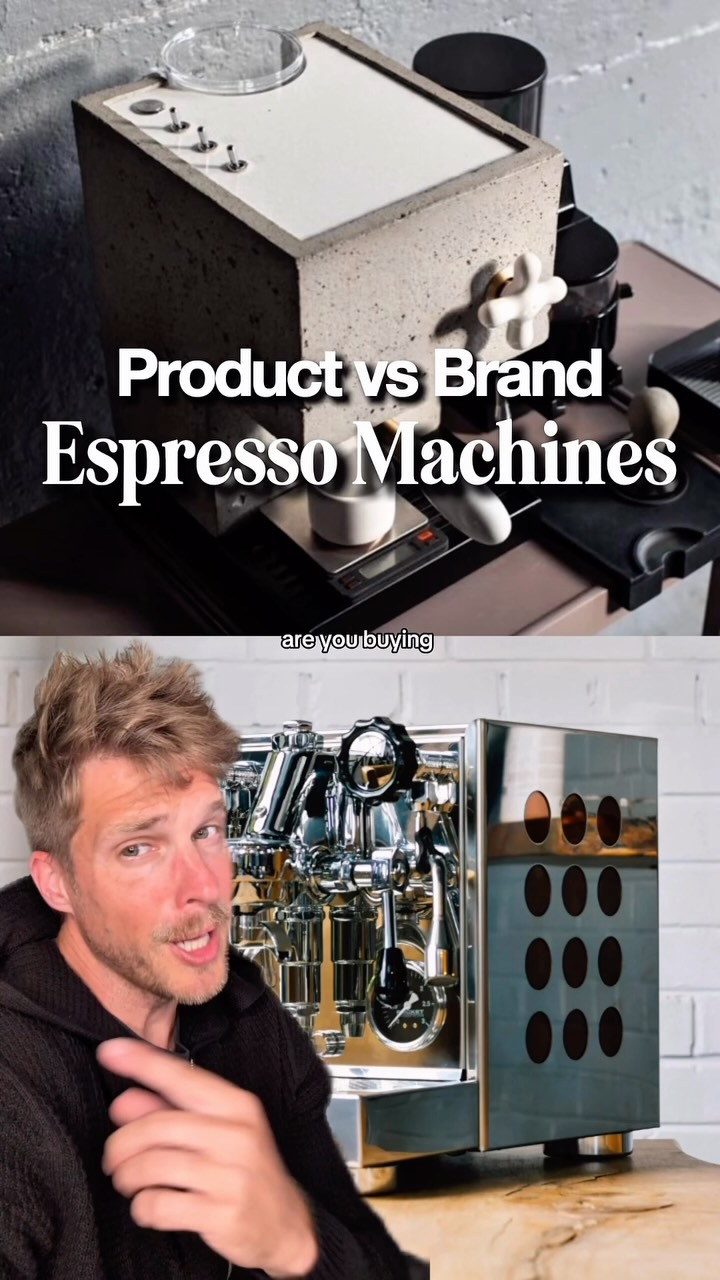 818.2K227.8×Rapid fire product vs brand reviews@orenmeetsworld · Rapid Fire Listicle
 5.8MCreator sorts car brands reliability@mastermoneyco · Rapid Fire Listicle
 2.1M7×Rating popular water bottle brands as product buys or brand buys@orenmeetsworld · Rapid Fire Listicle
 776.6K2.6×Tour of high-end design-focused coffee shops in Guangzhou@orenmeetsworld · Location Showcase
 76.6K1.2×Coffee brand strategy breakdown@shwinnabegobrand · Breakdown
[04]
[05]
What stops the scroll in the first 3 seconds
Title hook
Coffee Chains Coffee Quality x Hangout Vibe
Visual hook
A detailed, visually dense 2D matrix chart plotting recognizable coffee brand logos against humorous axes, immediately inviting the viewer to find their favorite chain.
[07]
The promise the opener makes, and how the video pays it back
Hook
Immediate visual presentation of a structured, highly subjective ranking system featuring instantly recognizable logos, forcing the viewer to stop and analyze.
Payoff
The culmination of the viewer's internal scanning and judgment process, resulting in a strong psychological urge to voice their opinion, validate the chart, or argue the placements in the comments.
[08]
The structural pattern this video runs on
Framework
The Controversial Matrix
Mapping familiar, culturally relevant entities onto a 2D matrix using subjective criteria to instantly generate strong opinions and drive comment section debate.
The Framework Establishment
The viewer absorbs the x and y axes and quadrant labels to understand the specific rules and criteria of the creator's ranking system.
The Entity Scan
The viewer actively searches the matrix for entities they have a personal connection to, looking for their favorites or least favorites.
The Judgment Phase
The viewer evaluates the specific placement of an entity against their own preconceived notions, generating either validation (agreement) or outrage (disagreement).
Which chain did I disrespect? Coffee chains, plotted by coffee quality × hangout vibe. Follow @everythingplotted for more charts like this.
title · throughout
Coffee Chains Coffee Quality x Hangout Vibe
informational · throughout
Bad Coffee, Great Sofa Comfy spaces, questionable coffee.
informational · throughout
Barista's Living Room Great coffee, actually a place to hang out.
informational · throughout
Takeaway Regret Fast, convenient, and often disappointing.
informational · throughout
Coffee Worth Commuting For Excellent coffee, even if it's not a cozy hangout.
call-to-action · throughout
Follow @everythingplotted for charts like this
contextual · throughout
Second Home Grab and Go Burnt Beans Barista Approved