@the_life_professor
Instagram · Greenscreen Talking Head
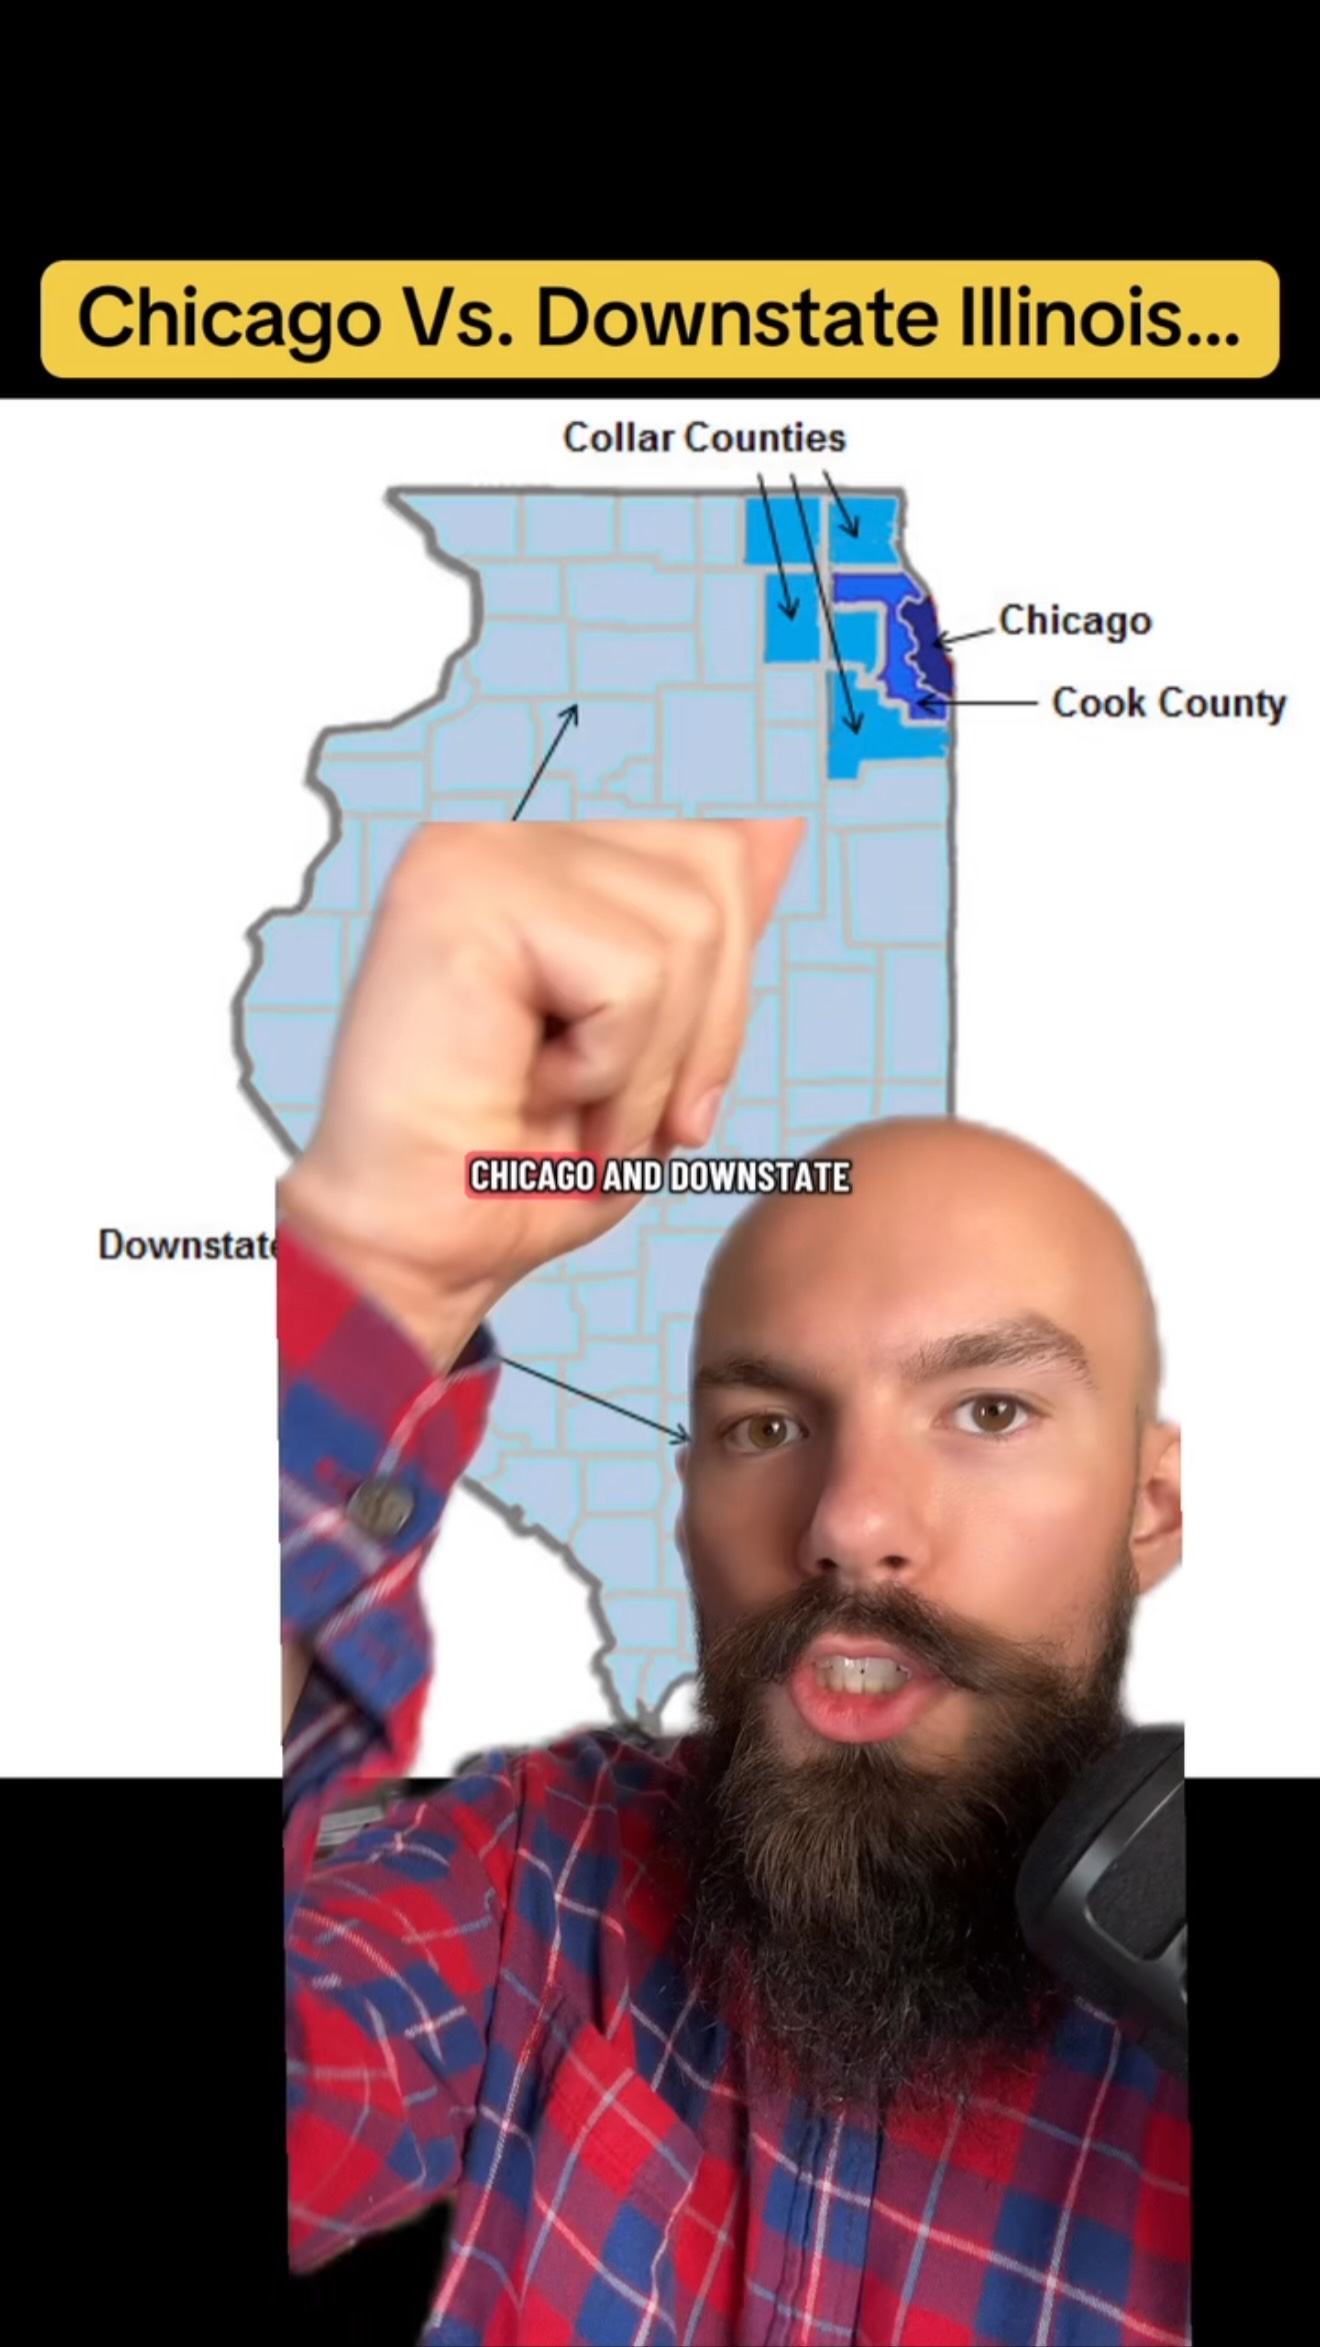
@the_life_professor Chicago Vs. Downstate Illinois…

@the_life_professor
Instagram · Greenscreen Talking Head
@the_life_professor Chicago Vs. Downstate Illinois…
Performance
Video #49741 · Greenscreen Talking Head
[01]
The creator explains the significant cultural, economic, and political divide between the Chicago metropolitan area and the rest of Illinois. He uses a series of maps and data visualizations to illustrate disparities in population density, job growth, and voting patterns, arguing that this power imbalance leads to resentment and a fractured state identity.
[02]
[03]
 454.4K6.5×Commentator argues for pronatalist policies@womp_tomp · Hot Take
 354K5.5×Provocative hypothetical with data overlays@womp_tomp · Hot Take
 187.3K8.5×Prop comedy explains political news@davejorgenson1 · Breakdown
 534.5K41.2×Creator debates himself about immigration economics@npr
 241.3K384.9×Explaining racism through contamination fears@glass__museum · Breakdown
 237.1K7.1×Creator refutes claim with historical argument@womp_tomp · Hot Take
 226.4K22.3×Political speech with counter-evidence visuals@thecanaryuk · Cultural Rant
 273.5K12.3×Explaining a local tech conflict@zephzoid · Headlines
 1.9MExplaining political conspiracy with overlays@marcotrunzo · Conspiracy Breakdown
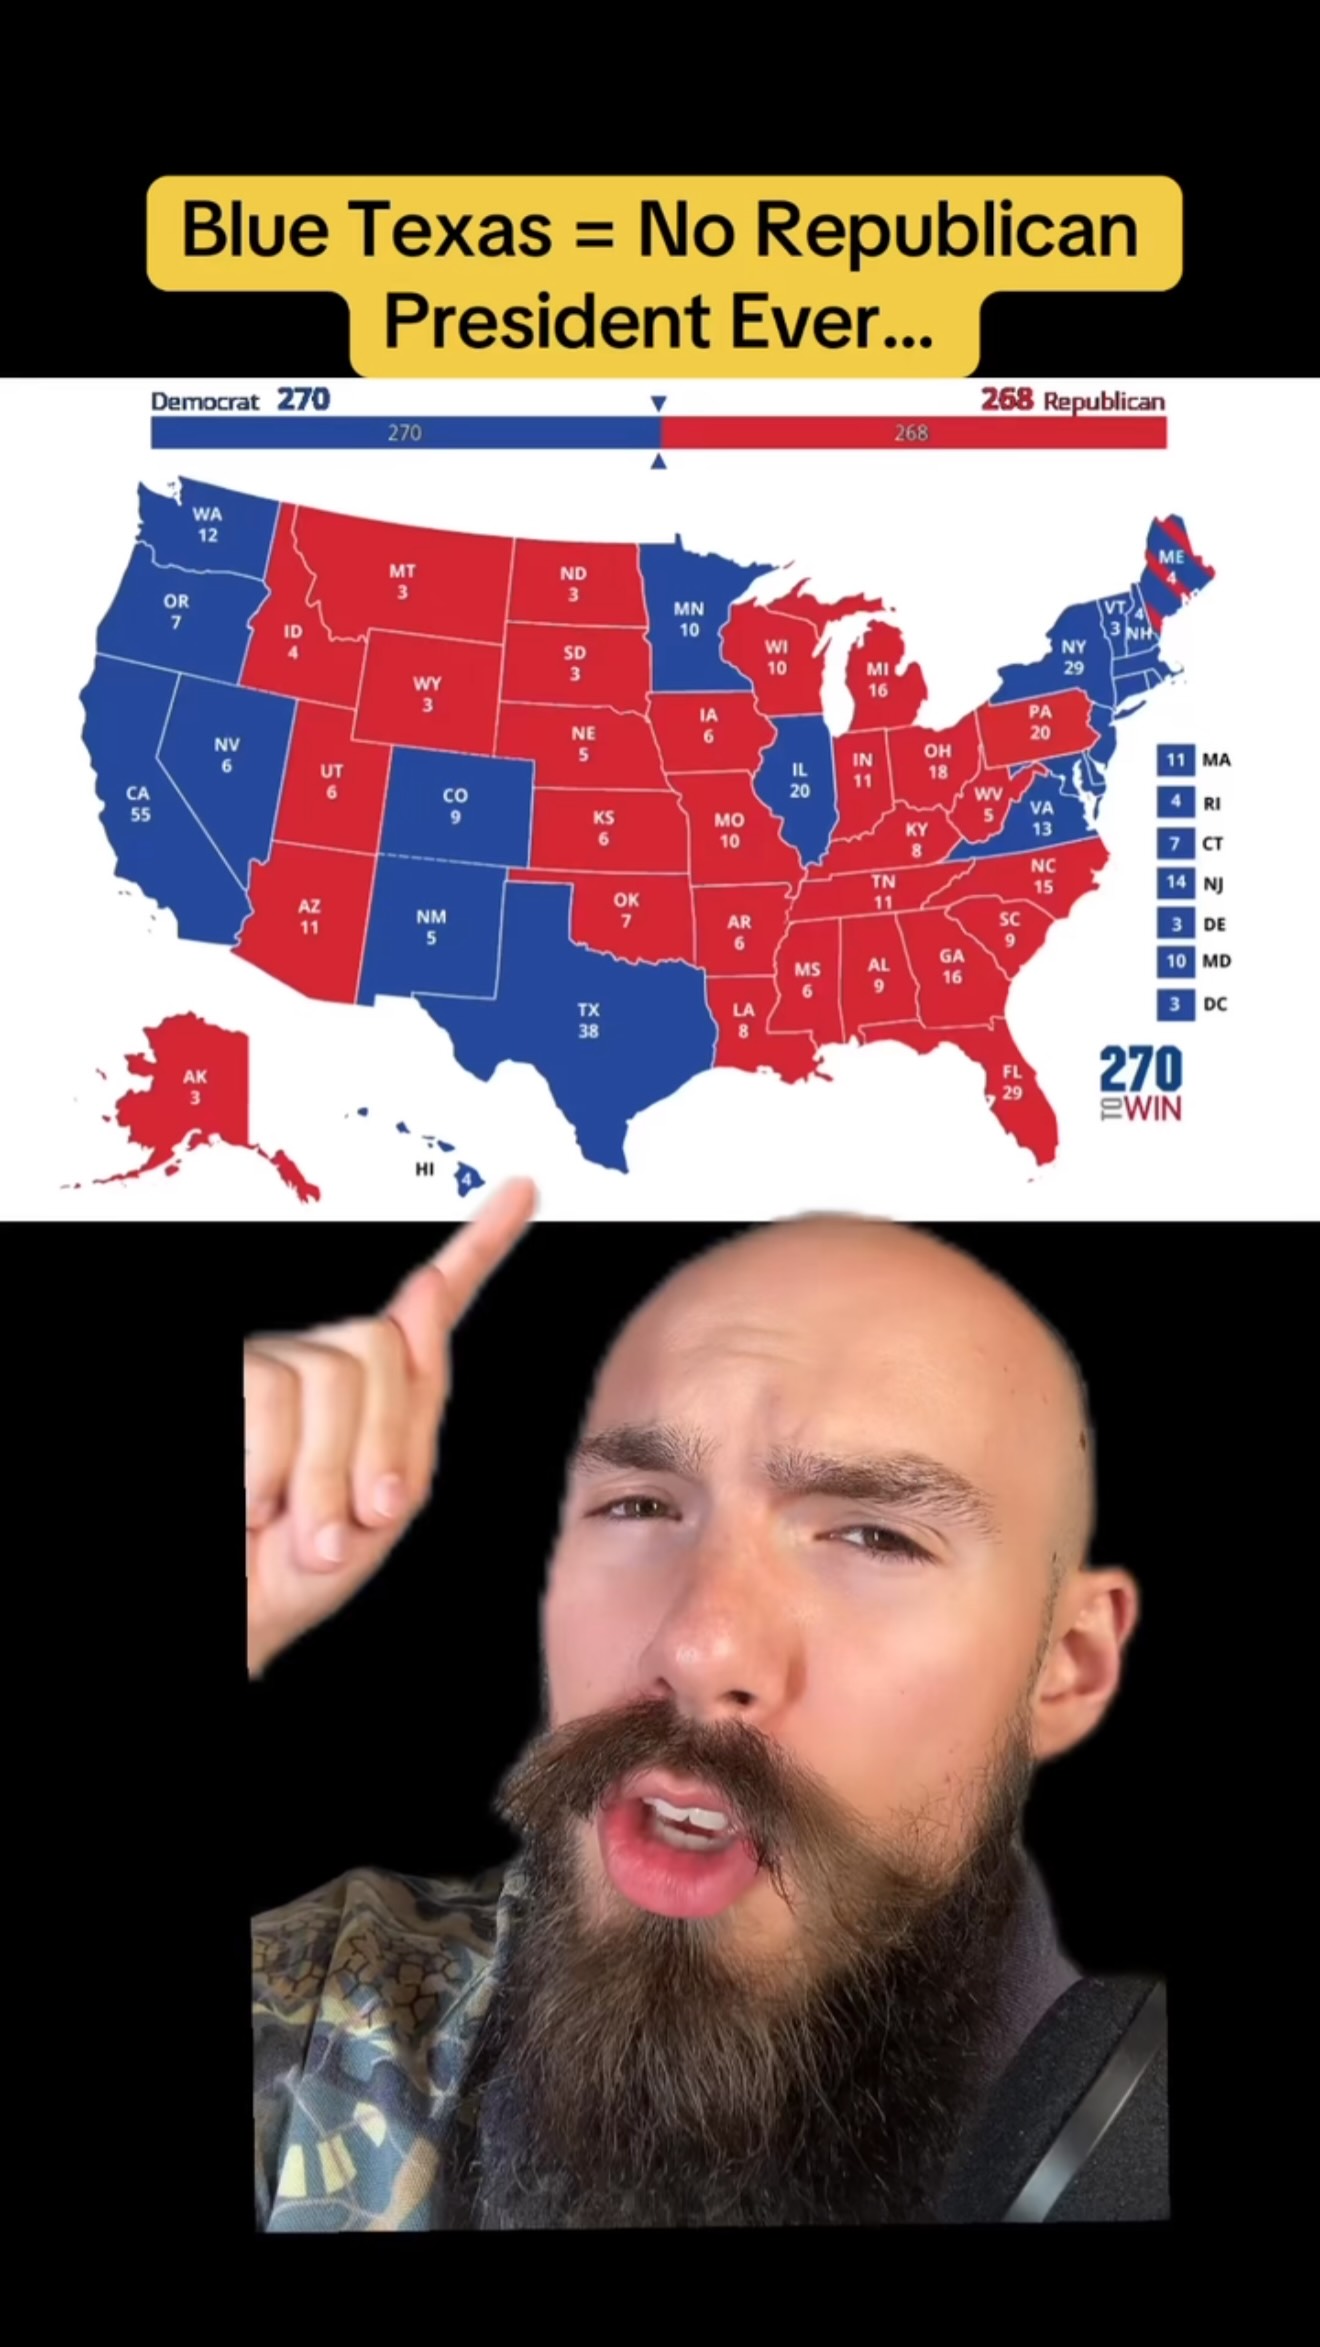 212.2K6.9×Explaining electoral map political scenarios@the_life_professor · Breakdown
 354.4K17.5×Creator refutes stats with data@womp_tomp · Reaction
 147.8K97×Lip sync political reaction joke@wambamdancam · Lip Sync Trend
[04]
[05]
What stops the scroll in the first 3 seconds
Title hook · 45%
Chicago Vs. Downstate Illinois...
Verbal hook · 45%
Chicago and Downstate Illinois might as well be two different states, if not two different countries in terms of how different they are.
Visual hook · 10%
A map of Illinois is prominently displayed with different regions (Chicago, Cook County, Downstate) highlighted in distinct colors, immediately establishing the video's geographical and political topic.
[06]
Steal this for your own video
Vs. ... (they might as well be two different )
[07]
The promise the opener makes, and how the video pays it back
Hook
Make a hyperbolic claim that two parts of a single entity are so different they might as well be separate countries, immediately establishing a strong, debatable thesis.
Payoff
End with a 'Comparative Challenge' that asks the audience to weigh the presented divide against another well-known example, directly prompting debate and engagement in the comments.
[08]
The structural pattern this video runs on
Framework
The 'Two Worlds' Thesis
To prove a stark cultural, political, or economic divide within a single geographic entity by systematically layering multiple forms of evidence, moving from objective data to subjective cultural impact.
The Foundational Proof
Present the most powerful and easily understood piece of evidence (e.g., population density) that visually and numerically establishes the core imbalance between the two regions.
The Evidence Montage
Rapidly present a series of 2-3 additional, distinct data visualizations (e.g., economic growth, demographic shifts) to build a multi-faceted, data-driven case for the divide.
The Political Confirmation
Introduce the most emotionally charged or politically divisive piece of evidence (e.g., an election map) as the climax of the argument, confirming the deep-seated nature of the divide.
The Power Imbalance Rationale
Explain the psychological and political consequences of the data, framing the dynamic in terms of power and showing why the less-populated region feels resentful or ignored.
The Cultural Caricature
Use a humorous or stereotypical visualization to illustrate the cultural perception gap and how the two sides view each other, reinforcing the 'different worlds' theme.
The Anecdotal Confirmation
Provide a common, relatable social trope or interaction that serves as real-world, human-level proof of the divide, making the abstract data feel personal.
Chicago Vs. Downstate Illinois…
title · beginning
Chicago Vs. Downstate Illinois...
informational · beginning
Illinois Population Density (People per square mile)
informational · middle
Tale of two states: Rest of Illinois lags far behind greater Chicago area in jobs growth
informational · middle
Population Change 2010 to 2020
informational · middle
2024 ILLINOIS PRESIDENTIAL ELECTION (Cook County vs Collar Counties vs Downstate)
informational · middle
ILLINOIS AS SEEN BY CHICAGO
informational · end
HOW YOU VIEW ILLINOIS, IF YOU'RE FROM...
Chicago and Downstate Illinois might as well be two different states, if not two different countries in terms of how different they are. Rank this is a difference that you can see on, like, literally every single map of Illinois. The general Chicago land area has around 70% of the entire population of the state. Like, 9,000,000 people live up here out of a state that has 13,000,000. Okay? This is also a difference that can be seen in job growth, population change with most of Chicago and the surrounding suburbs at least staying even if not growing, while most of Downstate shrinks in population. And of course, very famously, in terms of politics. And it's whenever you see this map, you understand why there is a lot of resentment from Downstate Illinois towards the Chicago area. Because it is truly the thing of like, when you have a state where 70% of the population lives in one little corner, you genuinely don't actually have to be concerned about any of these other opinions regardless if they're voting for you or not. Like, it's just one of those things of, like, you are genuinely just not important because, like, this is where all the people are at. Rank this insane power imbalance creates a circumstance where a lot of people downstate feel more culturally connected to, like, Kentucky or other surrounding areas than they do to what, like, a lot of people think Illinois is, which is once again best that dot up there. And this difference is why if you're ever talking to someone from Downstate Illinois, the first thing that they're gonna tell you is like, I'm not from Chicago. Because if they don't specify it, you just automatically default to this is what their life looks like. Whereas for them, this is probably more accurate. So, but tell me, which do you think is the bigger difference? Chicago and Downstate or like Upstate New York and New York Tier? Because it's gotta be one of those two in terms of how different it is. But, let me know and follow for more.