@landforce
Instagram · Greenscreen Talking Head
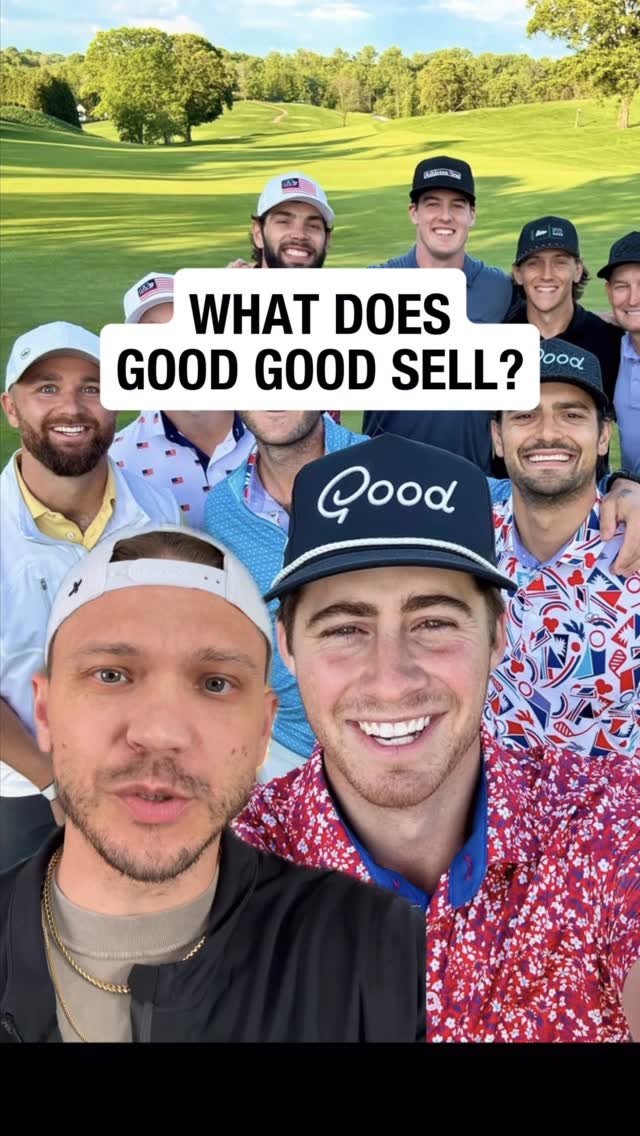
@landforce Not me just digging around looking at Good Good sales data in my spare time #goodgood #goodgoodgolf

@landforce
Instagram · Greenscreen Talking Head
@landforce Not me just digging around looking at Good Good sales data in my spare time #goodgood #goodgoodgolf
Performance
Video #9958 · Greenscreen Talking Head
[01]
The creator analyzes the sales performance of the golf brand 'Good Good' using third-party data on a greenscreen. He breaks down their $4.2M revenue by product category, color, and specific items like divot tools and hoodies, highlighting key insights about volume versus revenue drivers.
[02]
[03]
 532.2K13.3×Rejected dream leads to bigger success@bonusfootage · Origin Story
 376.1K92.7×Greenscreen brand strategy case study@davidkylechoe · Case Study Breakdown
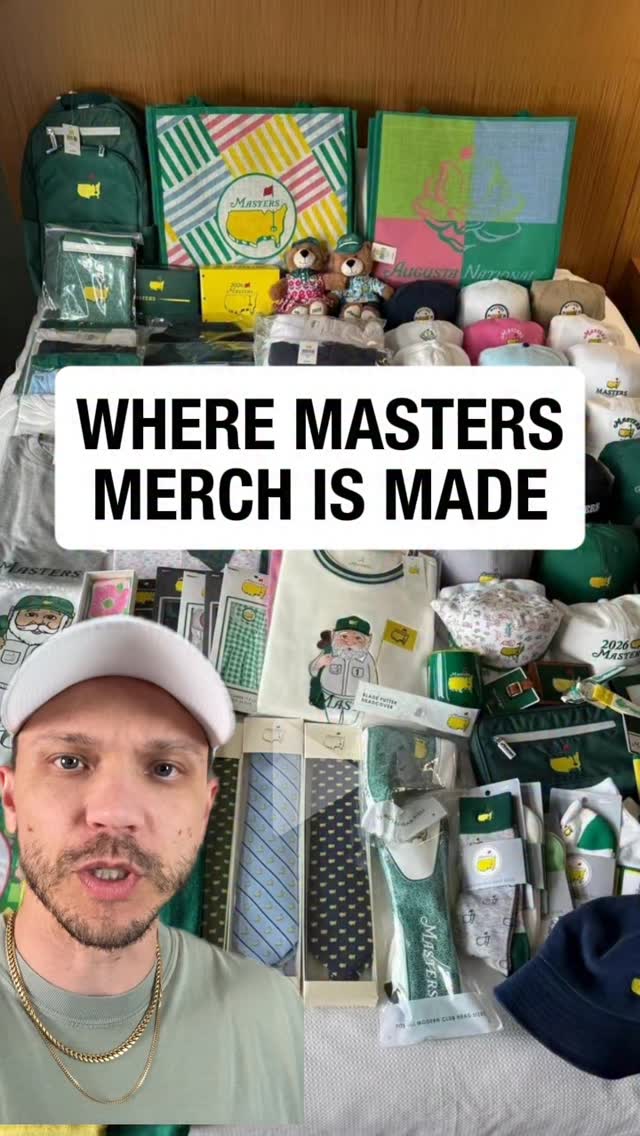 356K15.7×Greenscreen breakdown of merch sourcing@landforce · Breakdown
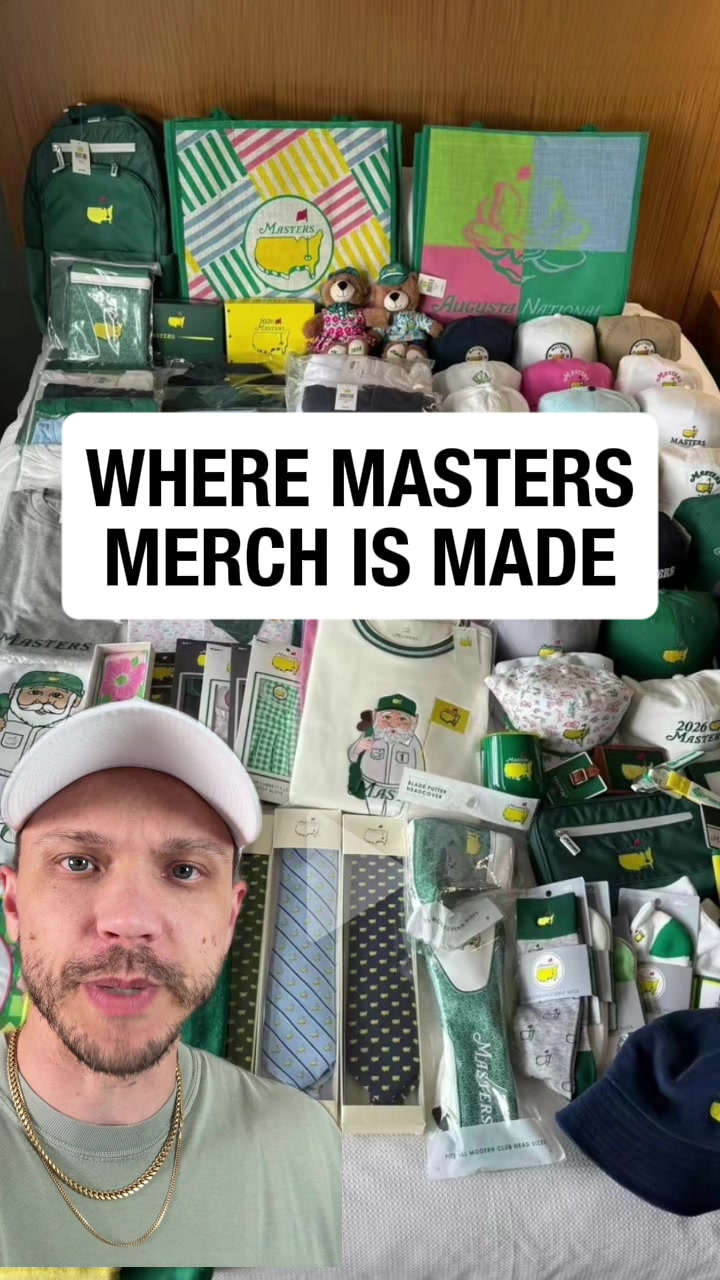 233.8K40.2×Greenscreen sourcing breakdown of merch@landforce_ · Breakdown
 384.2K6.1×Golf brand stereotype comedy breakdown@shaneohgolfs · What Your X Says About You
 354.4K11.7×Creator breaks down golf ad controversy@shaneohgolfs · Headlines
 70.7KGreenscreen brand sourcing supply breakdown@landforce · Breakdown
 492K3.5×Creator reports on major golf news@shaneohgolfs · Headlines
 549.1K7×Golf brand personality stereotypes explained@shaneohgolfs · What Your X Says About You
 212.3K3.1×Greenscreen golf product drop news@shaneohgolfs · Headlines
 59.6KExplaining golf auctions on Whatnot app@landforce · Buying List
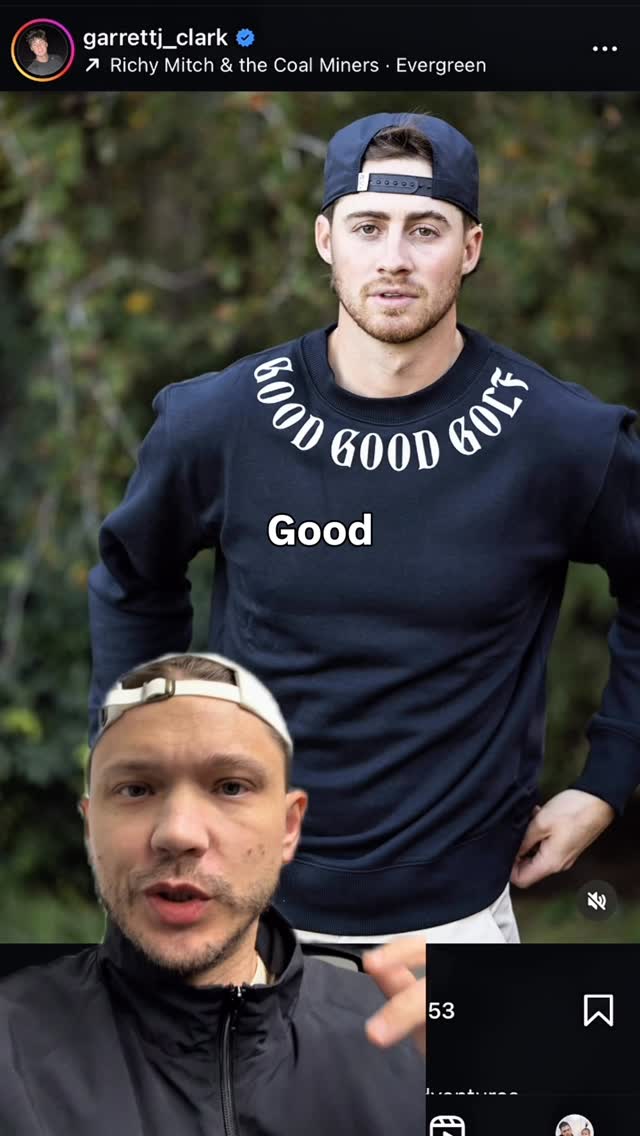 1.3M15.4×Hot take on streetwear golf apparel@landforce · Hot Take
[04]
[05]
What stops the scroll in the first 3 seconds
Title hook · 45%
WHAT DOES GOOD GOOD SELL?
Verbal hook · 20%
Do these brands actually sell? Good, good addition.
Visual hook · 35%
The creator's face is superimposed over a group photo of the famous YouTube golf group 'Good Good', creating immediate recognition and curiosity about the brand.
[07]
The promise the opener makes, and how the video pays it back
Hook
The Skeptical Inquiry: A direct challenge to the perceived success of a popular brand, promising objective verification through data.
Payoff
The Ego Spike: Connecting a specific data anomaly back to the creator's own previous actions or influence, serving as both a joke and proof of authority.
[08]
The structural pattern this video runs on
Framework
The Forensic Revenue Audit
Demystifying a popular entity's success by peeling back layers of private data, moving from macro financials to specific product insights, and ending with a personal connection.
The Neutrality Disclaimer
Establishes the creator as an unbiased auditor to build trust before revealing sensitive numbers.
The Macro Validation
Presents the headline revenue figures immediately to anchor the scale and prove the subject is worth analyzing.
The Volume vs. Value Paradox
Contrasts what sells the most units against what actually drives revenue, offering a quick business lesson.
The Consumer Behavior Insight
Highlights specific, relatable purchasing patterns (like discount reliance or color preference) that feel like insider secrets.
The Unit Economics Trap
Identifies a 'best seller' that is actually a business liability due to low price point, deepening the analysis.
The True Cash Cow
Reveals the actual heavy lifters in the product lineup, correcting the viewer's assumptions.
The Time-Bound Zoom
Narrows the analysis scope to a recent timeframe to isolate a specific anomaly or trend.
Not me just digging around looking at Good Good sales data in my spare time #goodgood #goodgoodgolf
title · beginning
WHAT DOES GOOD GOOD SELL?
informational · beginning
4.2M
contextual · end
Particle
Do these brands actually sell? Good, good addition. This is presented without shade and genuine curiosity. They've done 4.2 in the trailing 90, but November is already ripping. In that time, shirts and hats make up just over a third each by volume, but shirts account for more than 40% of the revenue. Note that nobody is buying anything at full price. Can't help but notice that blue stuff sells almost double the next color. Now at the product level, the tool takes the number one spot by volume. Modified best seller, but at $9, a product like that alone will kill you. Flip to buy revenue, you see hoodies absolutely holding it down. Those you wrote though is doing numbers considering it is almost half the price. Now when I reel this in a little to the last six weeks, what do we have here? Our favorite crew neck has done 726 units. If you zoom in, you can see the spot that I made my video about it. And that is gonna be the only joke I make here today. Shout out Particle for the data. Let's go.