Viral Hooks
Trending short videosInfographic map of Midwest arts funding
A

@arts_midwest

Instagram · Carousel
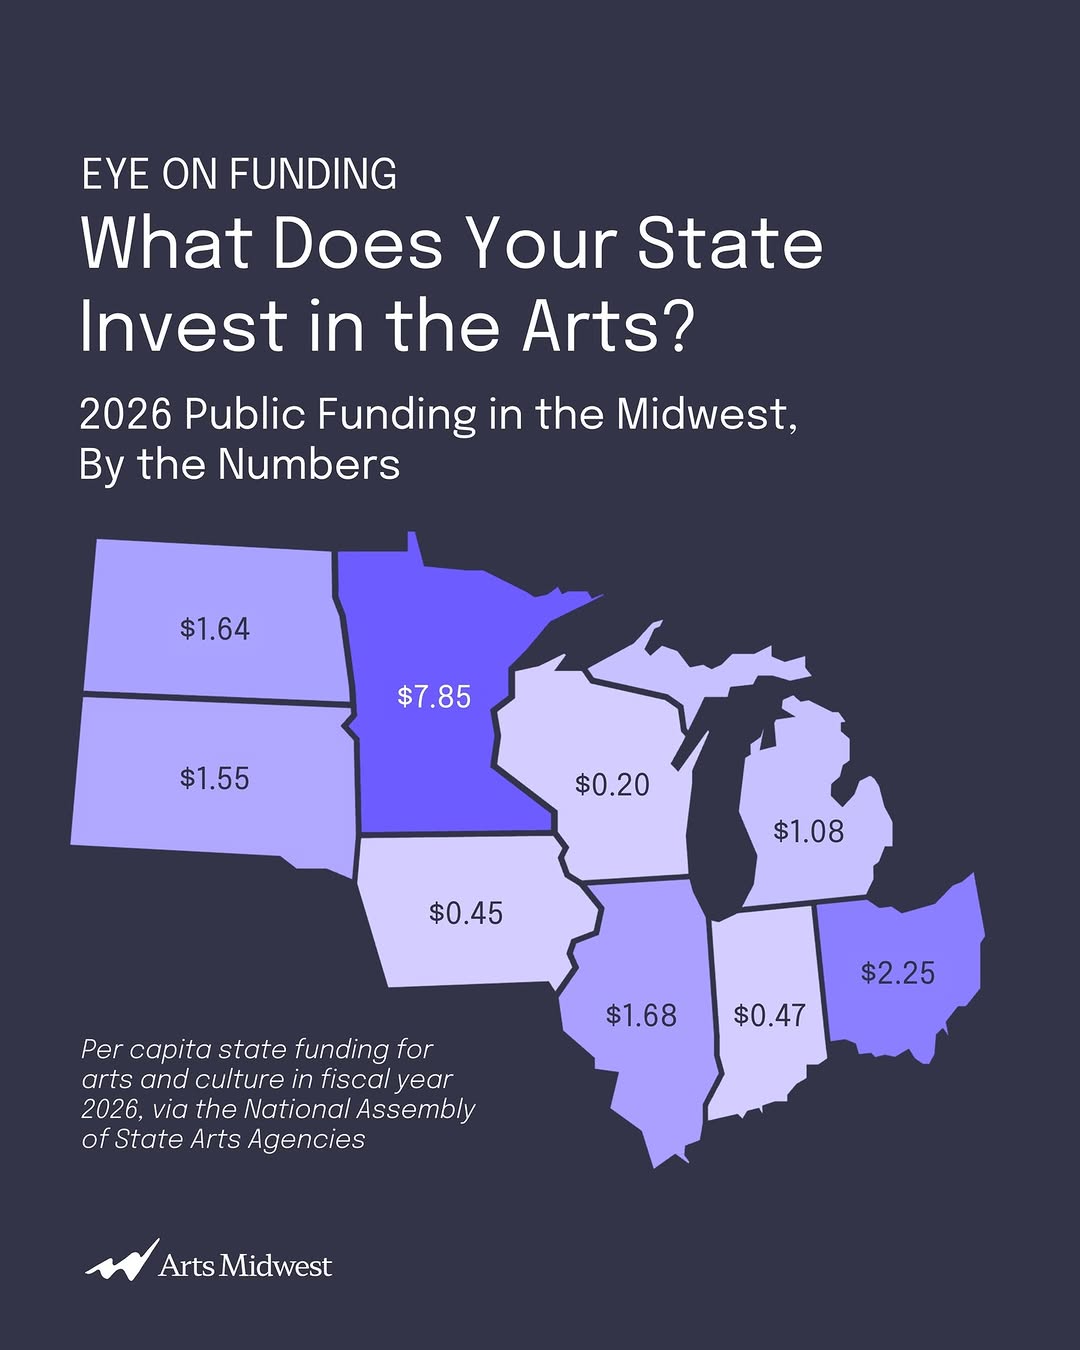
@arts_midwest $1.88 per person. That's the average of what states invested in the arts this year. But averages hide a lot. In the Midwest, the real numbers range from $0.20 to $7.85, including #1 in the nation (Minnesota) and #48 (Wisconsin). Nationally, legislative appropriations to state arts agencies totaled $646 million in FY2026, a 5.9% decrease from last year. And most concerning, population growth and inflation have reduced the real value of arts support over 25 years. When converted to 2001 dollars, FY2026’s per capita funding of $1.88 equals just $1.04. Compared to $1.57 in 2001, that means a real decline of 34%. Swipe to see what's at stake when state arts funding drops. Or, check out our full analysis of new data from the National Assembly of State Arts Agencies at the link in our bio.

View original on Instagram

The edit1 shot · 12 text
Shots Text

Performance

Views
108.7K
Likes
7.2K
Comments
212
Engagement
6.9%
Outlier
17.7×

Video #31188 · Carousel

Infographic map of Midwest arts fundingfrom @arts_midwest

[01]

Overview

This is an informational graphic presented as the first slide of a carousel post. It uses a map of the Midwestern US to display and compare the per capita state funding for arts and culture in fiscal year 2026, highlighting the significant variation between states.

[02]

Simple outline

  1. 1Pose a personal question.
  2. 2Visualize comparative data.
  3. 3Provide context and source.

[03]

Related videos

[04]

Classification

Format
Concepts
News Carousel
Elements
Data Visualization GraphicText OverlayTemplated Graphic Layout
Account

[05]

Hook analysis

What stops the scroll in the first 3 seconds

Title hook · 45%

What Does Your State Invest in the Arts?

Verbal hook · 15%

$1.88 per person.

Visual hook · 40%

A color-coded map of the Midwest visually represents disparities in arts funding, with a high-contrast dark purple state ($7.85) immediately drawing the eye and encouraging comparison.

[07]

Hook and payoff

The promise the opener makes, and how the video pays it back

Hook

The entire first slide acts as the hook. It combines a direct, audience-centric question with a data-visualization (a map) that reveals a surprising or dramatic inequality. This creates an immediate information gap that the user wants to fill by swiping.

Payoff

The payoff is deferred. This slide's function is to set up a problem and create the need for a resolution, which is promised in the caption ('Swipe to see what's at stake') and subsequent slides.

[08]

Narrative framework

The structural pattern this video runs on

Framework

The Data-Map Provocation

To use a visually compelling, data-rich map to make a broad issue feel personal and localized. The stark data differences and a direct headline provoke curiosity and a desire for explanation, driving the user to swipe for the 'why'.

  1. 1

    The Provocative Snapshot

    To establish the core topic and stakes through a single, powerful data visualization. It localizes a broad issue, making it personally relevant, and uses stark numerical contrast to create inherent tension and questions that the rest of the carousel is positioned to answer.

Themes

  • civic engagement
  • economic disparity
  • cultural investment
  • advocacy

Techniques

  • data visualization
  • graphic design
  • information design

Trends

  • data-driven content
  • infographic marketing

Post caption

$1.88 per person. That's the average of what states invested in the arts this year. But averages hide a lot. In the Midwest, the real numbers range from $0.20 to $7.85, including #1 in the nation (Minnesota) and #48 (Wisconsin). Nationally, legislative appropriations to state arts agencies totaled $646 million in FY2026, a 5.9% decrease from last year. And most concerning, population growth and inflation have reduced the real value of arts support over 25 years. When converted to 2001 dollars, FY2026’s per capita funding of $1.88 equals just $1.04. Compared to $1.57 in 2001, that means a real decline of 34%. Swipe to see what's at stake when state arts funding drops. Or, check out our full analysis of new data from the National Assembly of State Arts Agencies at the link in our bio.

Text overlays

  • title · photo_0

    EYE ON FUNDING What Does Your State Invest in the Arts? 2026 Public Funding in the Midwest, By the Numbers

  • informational · photo_0

    $1.64

  • informational · photo_0

    $1.55

  • informational · photo_0

    $7.85

  • informational · photo_0

    $0.45

  • informational · photo_0

    $0.20

  • informational · photo_0

    $1.68

  • informational · photo_0

    $1.08

  • informational · photo_0

    $0.47

  • informational · photo_0

    $2.25

  • contextual · photo_0

    Per capita state funding for arts and culture in fiscal year 2026, via the National Assembly of State Arts Agencies

  • branding · photo_0

    Arts Midwest

Infographic map of Midwest arts funding | Viral Hooks