@itsmarceliina
Instagram · Talking Head Edit
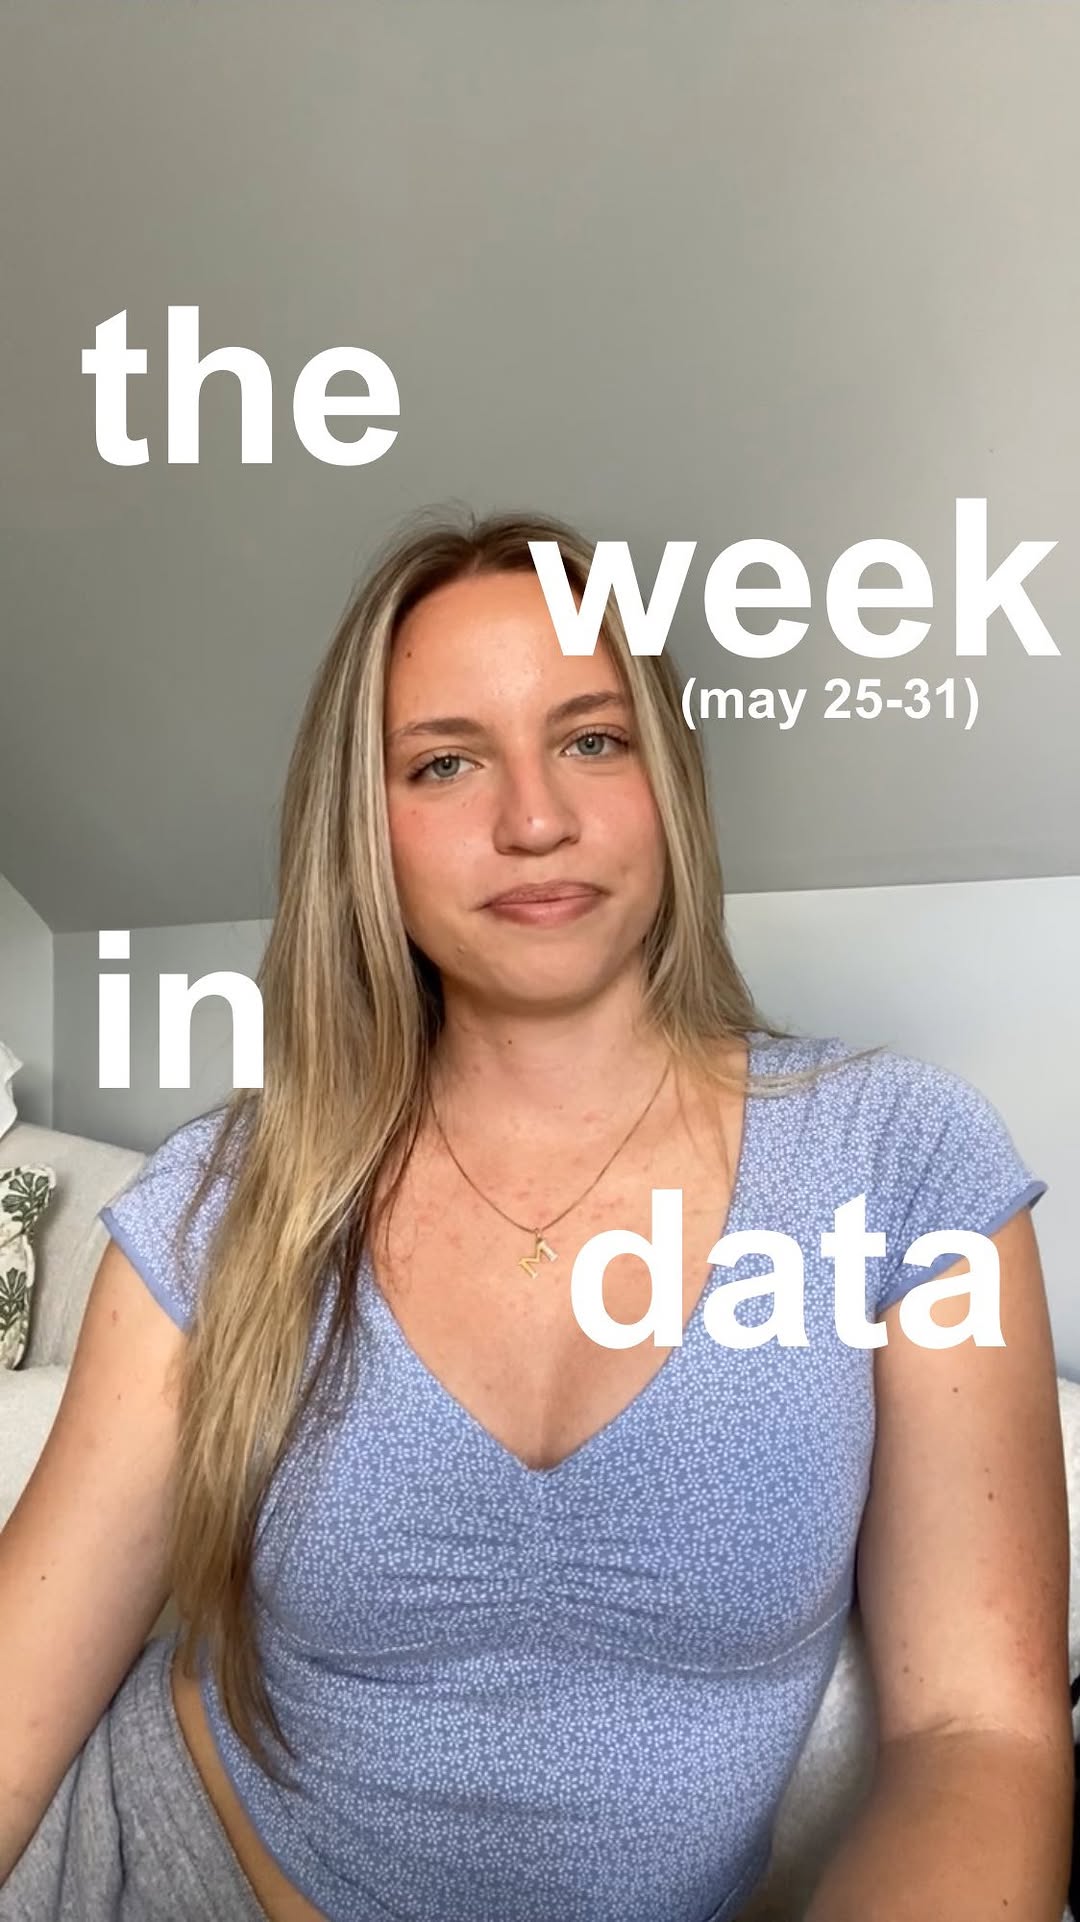
@itsmarceliina weekly roundup of the data behind the headlines (5/25)

@itsmarceliina
Instagram · Talking Head Edit
@itsmarceliina weekly roundup of the data behind the headlines (5/25)
Performance
Video #37583 · Talking Head Edit
[01]
The creator presents a weekly news roundup, breaking down three distinct headlines with data. First, she illustrates the rising valuation of AI startup Anthropic compared to OpenAI. Second, she visualizes the negative impact of a Blue Origin rocket explosion on space-related stocks. Finally, she explains a Stanford study on AI hiring bias using hand-drawn charts.
[02]
[03]
 693.3K5×Talking head tech news breakdown@metav3rse · Headlines
 620.1KShowing conflicting AI news headlines@distilledscience
 389K3.1×Split screen AI news breakdown@rony · Case Study Breakdown
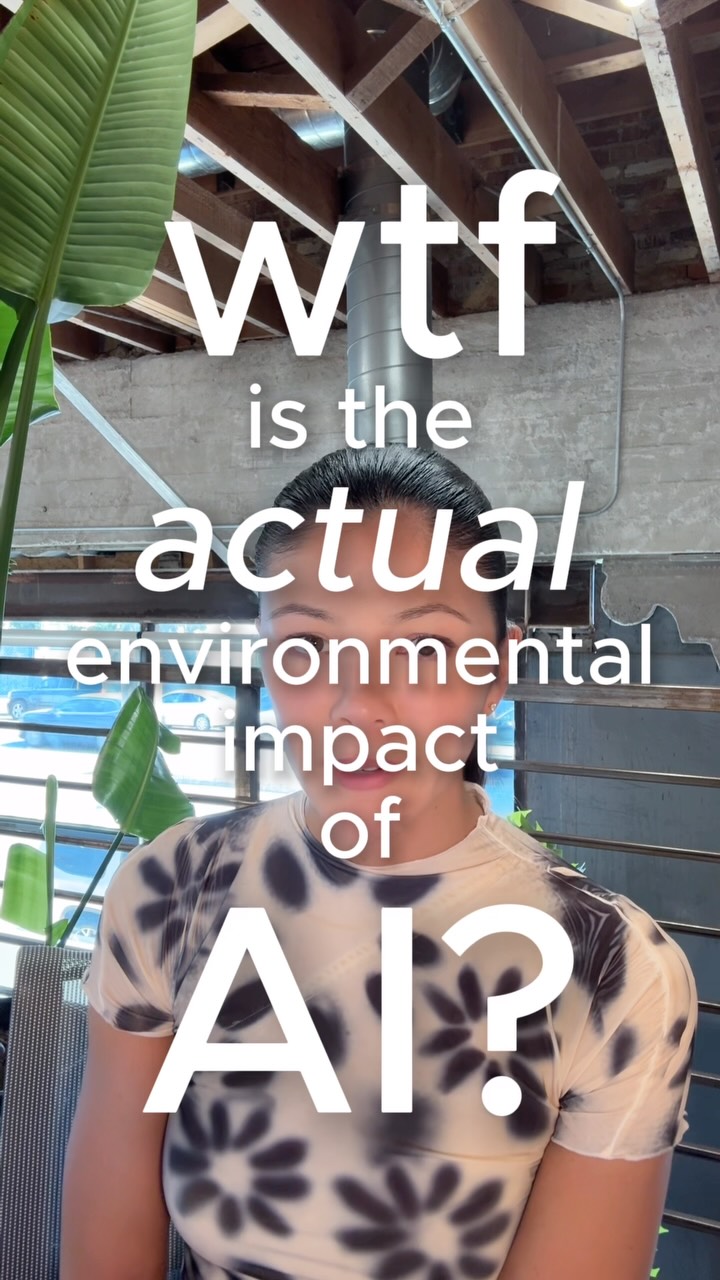 496.1KData breakdown of AI's electricity use@askcatgpt · Breakdown
 292K7.6×Fast-paced AI tool showcase@angus.sewell · Rapid Fire Listicle
 482.4K3.2×Split screen Elon Musk business breakdown@rony · Breakdown
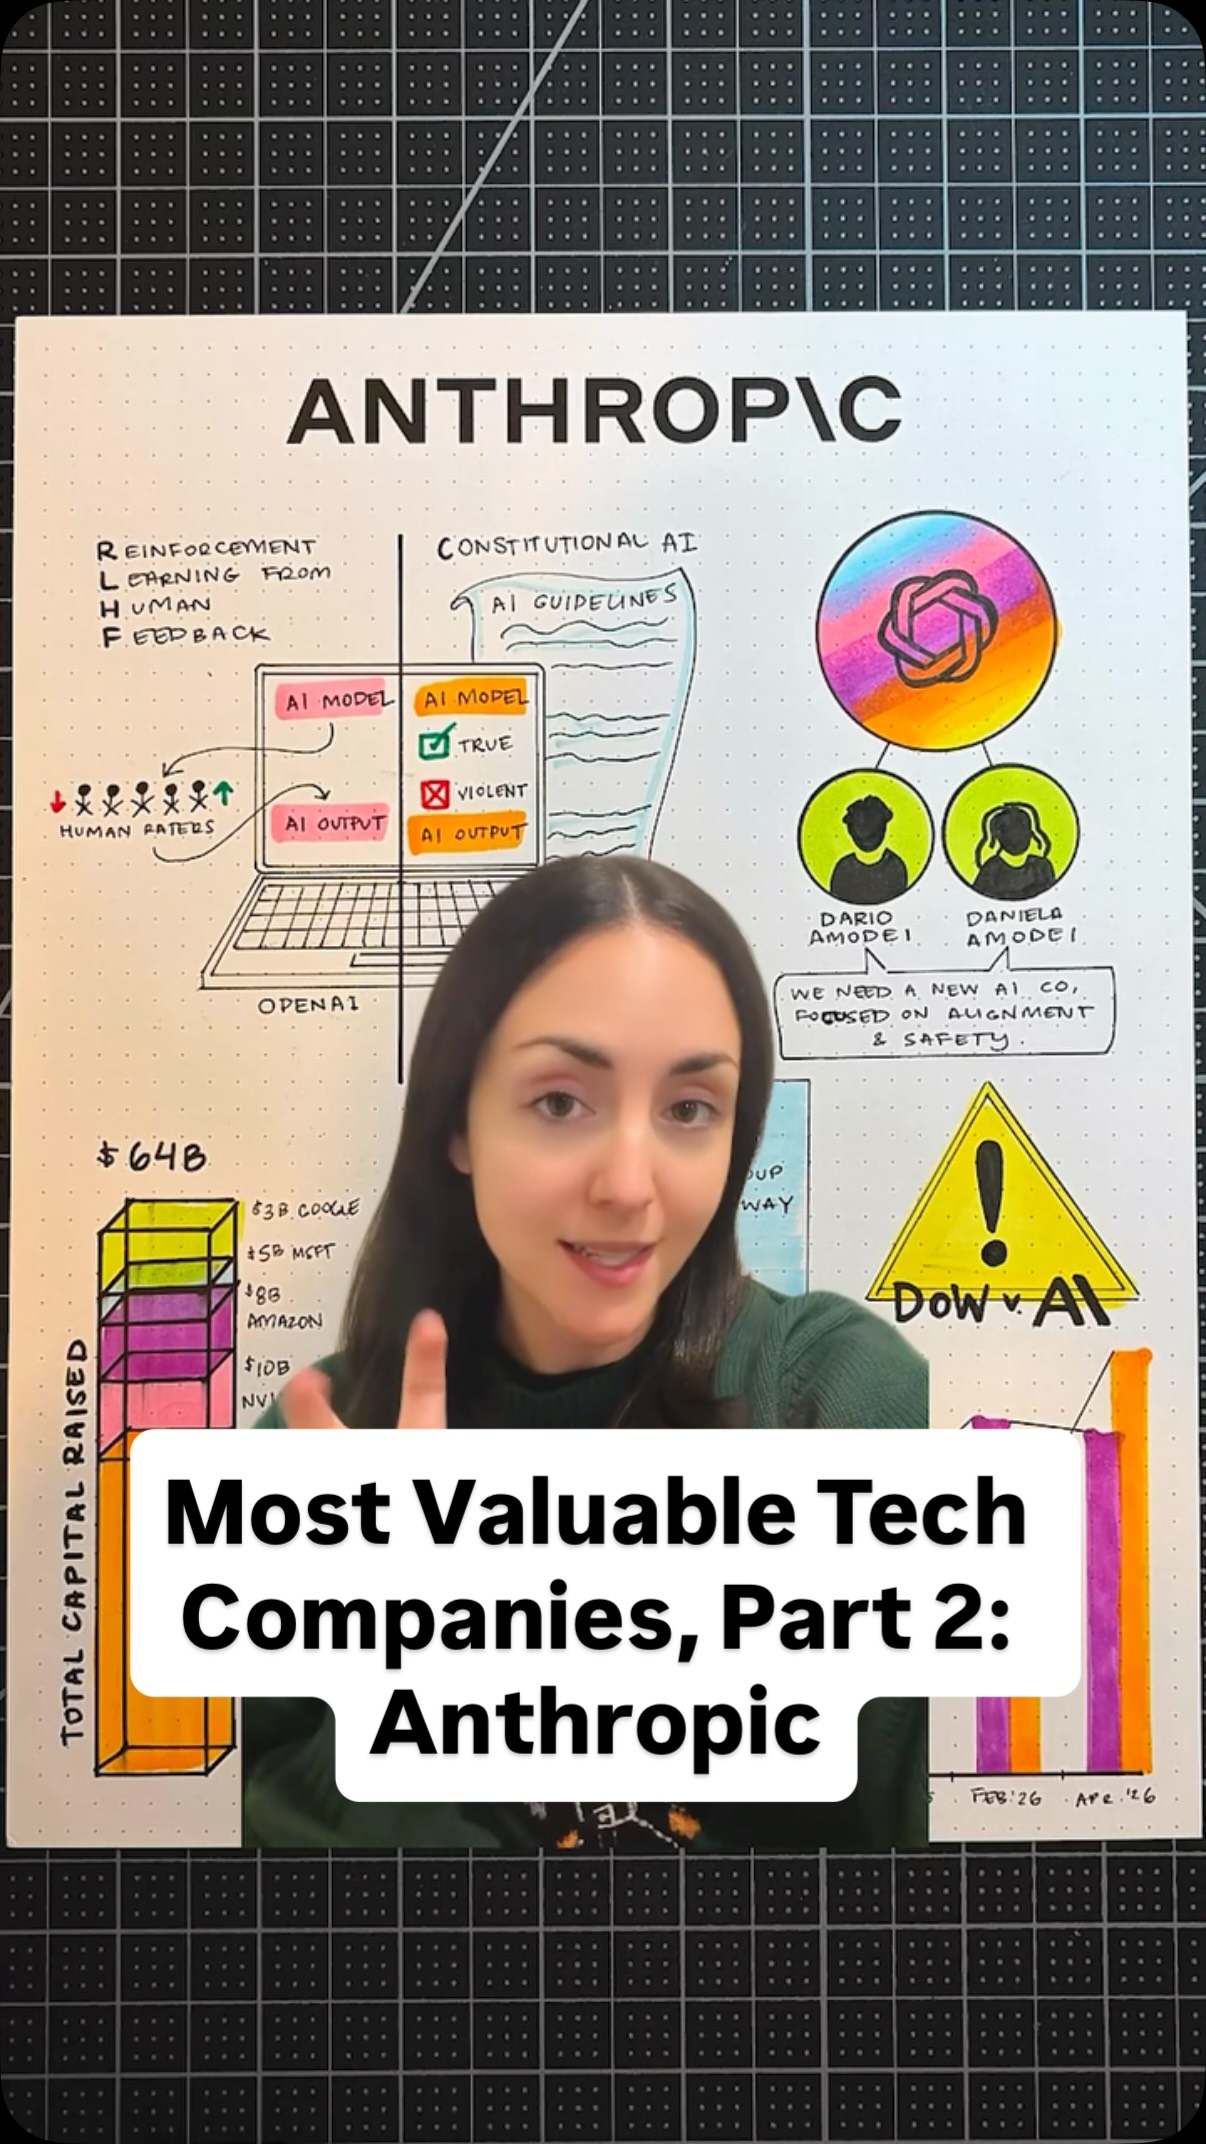 406.3K1.7×Illustrated explainer of AI company@nataliefratto · Breakdown
 655.8K32.6×AI predicts company death via reviews@angus.sewell · Opportunity Explainer
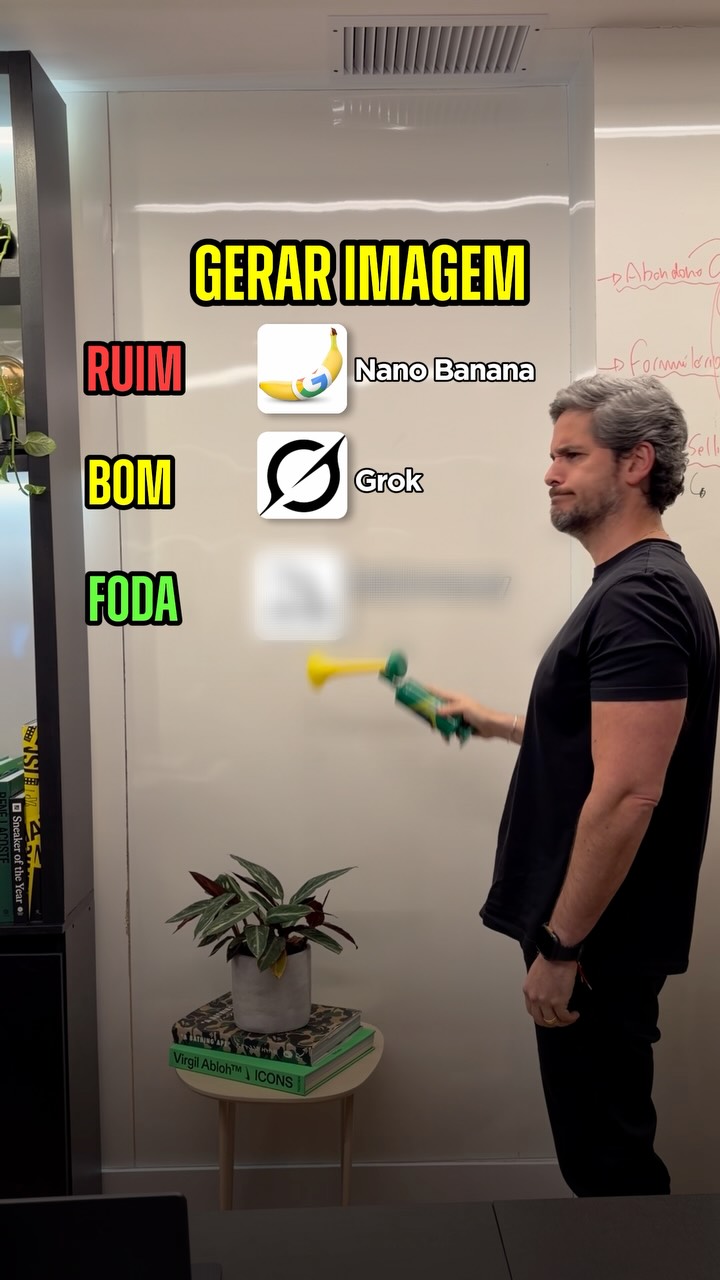 2.9M29.1×Rapid fire AI tool ranking@rony · Rapid Fire Listicle
 57.7KAI advertising opportunity showcase@thejamescamp · Opportunity Explainer
 110.8K2.1×Comparing expensive AI tools to DIY@angus.sewell · Breakdown
 2M1.3×Explaining new AI marketing tools@rpn · Breakdown
[04]
[05]
What stops the scroll in the first 3 seconds
Verbal hook · 100%
Look at the data behind this week's headlines.
[06]
Steal this for your own video
Let's look at the data behind .
[07]
The promise the opener makes, and how the video pays it back
Hook
A direct promise to reveal the hidden data and context behind well-known current events, establishing the video's value proposition immediately.
Payoff
Provides a concluding thought that contextualizes the findings, acknowledges limitations, and reinforces the central theme, while also setting an expectation for recurring future content.
[08]
The structural pattern this video runs on
Framework
The Data Storyteller
Deconstructing complex news headlines into simple, hand-drawn data visualizations to reveal the underlying story and its human impact.
The Market Leader Shakeup
Presents a story about a shift in power or ranking within an industry, using comparative data to illustrate the change and quantifying the financial stakes for the key players.
The Industry-Wide Shockwave
Details a singular negative event and then visualizes its cascading effect across multiple related entities, demonstrating broader market sensitivity and interconnectedness.
The Unseen Systemic Flaw
Reveals a hidden bias or problem within a widely used system, using statistical data to prove the flaw's existence and a secondary chart to explain its compounding negative impact on individuals.
weekly roundup of the data behind the headlines (5/25)
Look at the data behind this week's headlines. First, Anthropic became the most valuable AI startup in the world. It raised $65,000,000,000 in its series age round, hitting a $965,000,000,000 valuation. That edges out OpenAI, which was last valued at 852,000,000,000. The two companies have been increasingly compared on both valuation and revenue metrics. And on both, Anthropic has recently been closing the gap fast. After this round, it's reported that Anthropic's seven co founders, who each own less than 1% of the company, got about an $8,000,000,000 net worth bump each. That's the insane scale of this AI good rush. Last week, space related stocks have been surging on the back of SpaceX's upcoming IPO. But on May 28, a Blue Origin rocket exploded during a pre launch test at Cape Canaveral. The Jeff Bezos owned company is working to launch Amazon Internet satellites into orbit as a direct competitor to Elon Musk's SpaceX. The next morning, those space stock gains started unwinding. For example, Rocket Lab, which had run up significantly in the week prior, hit an intraday low of down nine percent. Similarly, AST SpaceMobile dropped 20% at its worse, Intuitive Machines tier, and Voyager 12%. And finally, a Stanford study of 4,000,000 job applications found adverse impact in AI hiring. Focusing on the Pymetrics hiring system, they found 15% of Asian applicants and 26 of Black applicants routed to positions where the algorithm discriminates against them under federal law. But a more novel finding is about algorithmic monoculture. When applicants apply to multiple employers using the same model, they expect independent evaluations. But their numerical score is identical everywhere, meaning a rejection at one triggers rejection across all of them. Them. This chart shows exactly that. The observed systemic rejection rank, shown in dark blue, consistently exceeds what chance would predict, shown in light blue. For example, ten percent of people who applied to four jobs were rejected from all four of them, a much higher rate than what would be expected if it were up to chance. The data is from 2018 to 2022, and a lot of today's algorithms work differently. But the concern holds. If a major vendor's algorithm has a flaw, every company using it gets hit, sometimes without even knowing it. And that's all for today. See you next week.