Viral Hooks
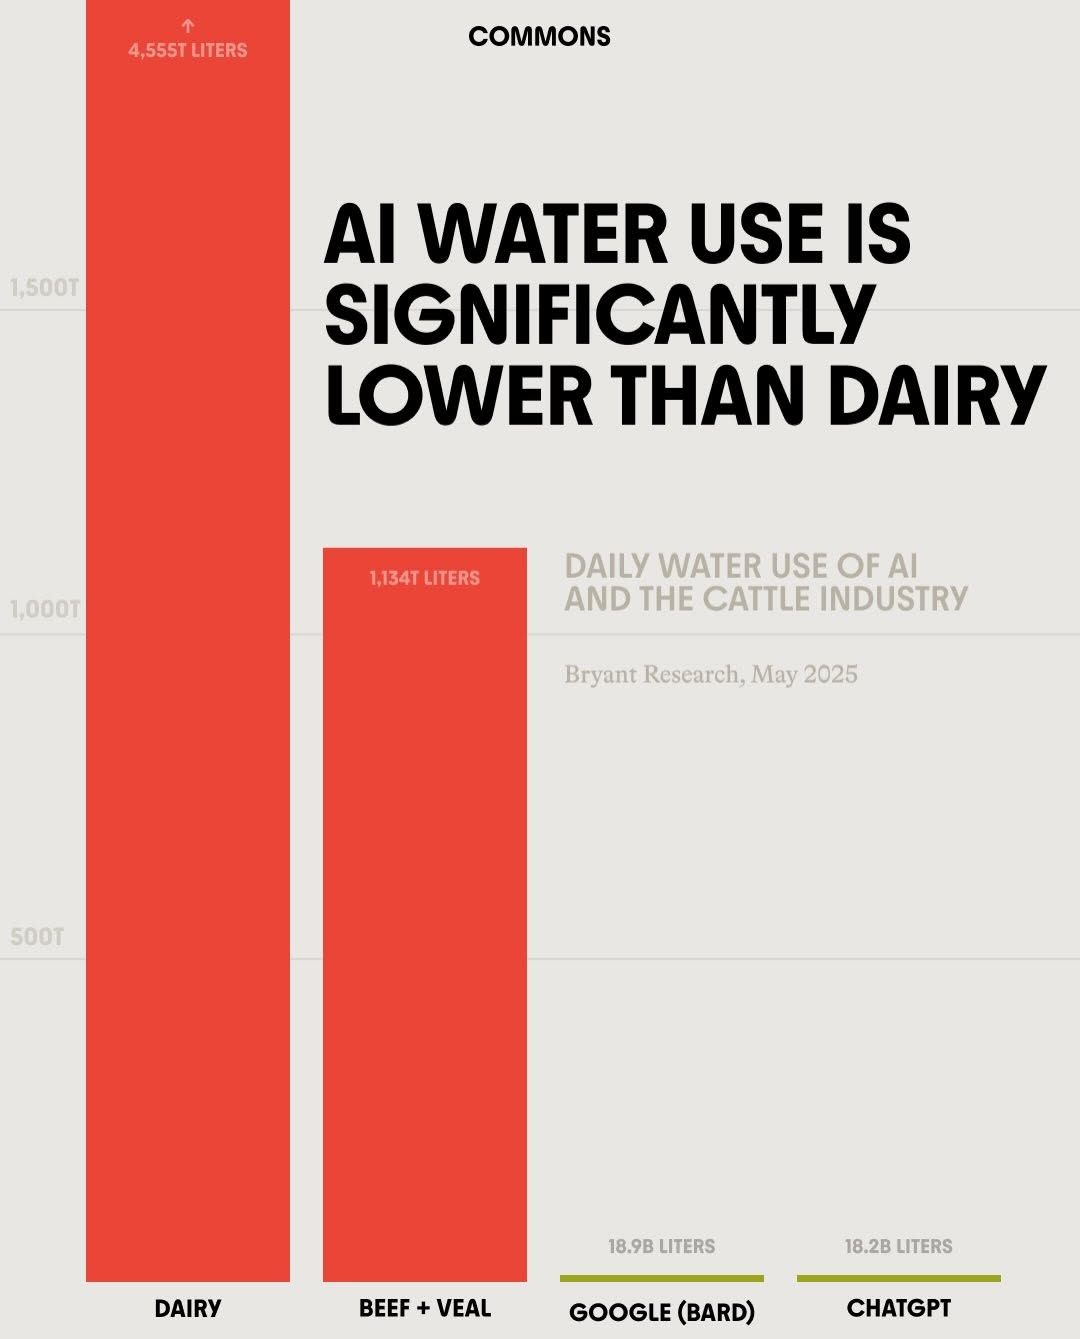
Trending short videosBar chart comparing AI and dairy water use.
C

@commonsearth

Instagram · Carousel

@commonsearth 🔗 Comment pod for a link to our episode! While AI is a new threat to our resources, the animal agriculture industry has been draining them for decades. Find out more on the latest episode of the podcast: “How Cows and Congress are Raising Your Grocery Bill”

View original on Instagram

The edit1 shot · 12 text
Shots Text

Performance

Views
718.9K
Likes
47.9K
Comments
2.4K
Engagement
7%
Outlier
30.1×

Video #31912 · Carousel

Bar chart comparing AI and dairy water use.from @commonsearth

[01]

Overview

This is an infographic presented as a bar chart that makes a comparative argument about daily water usage. It visually demonstrates that the water consumption of AI models like Google's Bard and ChatGPT is orders of magnitude lower than that of the dairy and beef industries, aiming to reframe the conversation around resource-intensive technologies.

[02]

Simple outline

  1. 1State a surprising comparison.
  2. 2Visually establish a massive scale.
  3. 3Reveal a shocking contrast.
  4. 4Stamp with authority.

[03]

Related videos

[04]

Classification

Format
Concepts
Statement CarouselPublic Service Announcement
Elements
Data Visualization GraphicText OverlayScale ContrastTemplated Graphic Layout

[05]

Hook analysis

What stops the scroll in the first 3 seconds

Title hook · 35%

AI WATER USE IS SIGNIFICANTLY LOWER THAN DAIRY

Verbal hook · 40%

While AI is a new threat to our resources, the animal agriculture industry has been draining them for decades.

Visual hook · 25%

The extreme visual contrast between the massive red bars representing dairy/beef water use and the minuscule green lines for AI immediately communicates a vast difference in scale, creating a powerful visual hook.

[06]

Hook template

Steal this for your own video

While everyone is worried about [new threat], [established industry] has been doing [harm] for [timeframe].

  • — While everyone is worried about crypto energy use, traditional banking data centers have been burning through it for decades.
  • — While everyone is worried about fast fashion, the leather industry has been polluting waterways for over a century.
  • — While everyone is worried about electric vehicle batteries, the oil industry has been contaminating soil for generations.

[07]

Hook and payoff

The promise the opener makes, and how the video pays it back

Hook

A bold, declarative headline that presents a counter-intuitive or controversial comparison as a fact, immediately grabbing attention and setting the argument.

Payoff

The viewer is left with a powerful, easily digestible visual takeaway that proves the headline's claim and reframes their perspective on the issue. The graphic itself serves as the complete argument and resolution.

[08]

Narrative framework

The structural pattern this video runs on

Framework

The David & Goliath Data Slam

To reframe a popular concern by comparing it to a much larger, often overlooked problem using extreme visual scale distortion. The narrative unfolds within a single, dense infographic, guiding the eye from a provocative claim to the shocking visual proof.

  1. 1

    The Framing Statement

    A subtitle that clearly defines the entities and the metric being compared (e.g., 'Daily Water Use of X and Y'), providing essential context for the visual data.

  2. 2

    The Visual Anchor (Goliath)

    A dramatically oversized bar chart element representing the established, larger data point. This sets an extreme visual scale and anchors the viewer's perception of 'big'.

  3. 3

    The Punchline Reveal (David)

    One or more visually minuscule chart elements representing the topic in question. The extreme contrast with the 'Goliath' bar delivers the narrative's core message in a shocking, memorable way.

  4. 4

    The Credibility Stamp

    A small, unobtrusive text element citing a source and date, which lends authority and believability to the dramatic claims made by the visual.

Themes

  • Environmental impact
  • Technological advancement
  • Industry comparison
  • Resource consumption

Techniques

  • Data visualization
  • Typography
  • Color contrast
  • Scale contrast

Trends

  • Infographic content
  • Data-driven arguments

Post caption

🔗 Comment pod for a link to our episode! While AI is a new threat to our resources, the animal agriculture industry has been draining them for decades. Find out more on the latest episode of the podcast: “How Cows and Congress are Raising Your Grocery Bill”

Text overlays

  • branding · photo_0

    COMMONS

  • title · photo_0

    AI WATER USE IS SIGNIFICANTLY LOWER THAN DAIRY

  • contextual · photo_0

    DAILY WATER USE OF AI AND THE CATTLE INDUSTRY

  • contextual · photo_0

    Bryant Research, May 2025

  • informational · photo_0

    ↑ 4,555T LITERS

  • informational · photo_0

    1,134T LITERS

  • informational · photo_0

    18.9B LITERS

  • informational · photo_0

    18.2B LITERS

  • informational · photo_0

    DAIRY

  • informational · photo_0

    BEEF + VEAL

  • informational · photo_0

    GOOGLE (BARD)

  • informational · photo_0

    CHATGPT

Bar chart comparing AI and dairy water use. | Viral Hooks