Viral Hooks
Trending short videosBar chart of oil giant emissions
C

@commonsearth

Instagram · Carousel
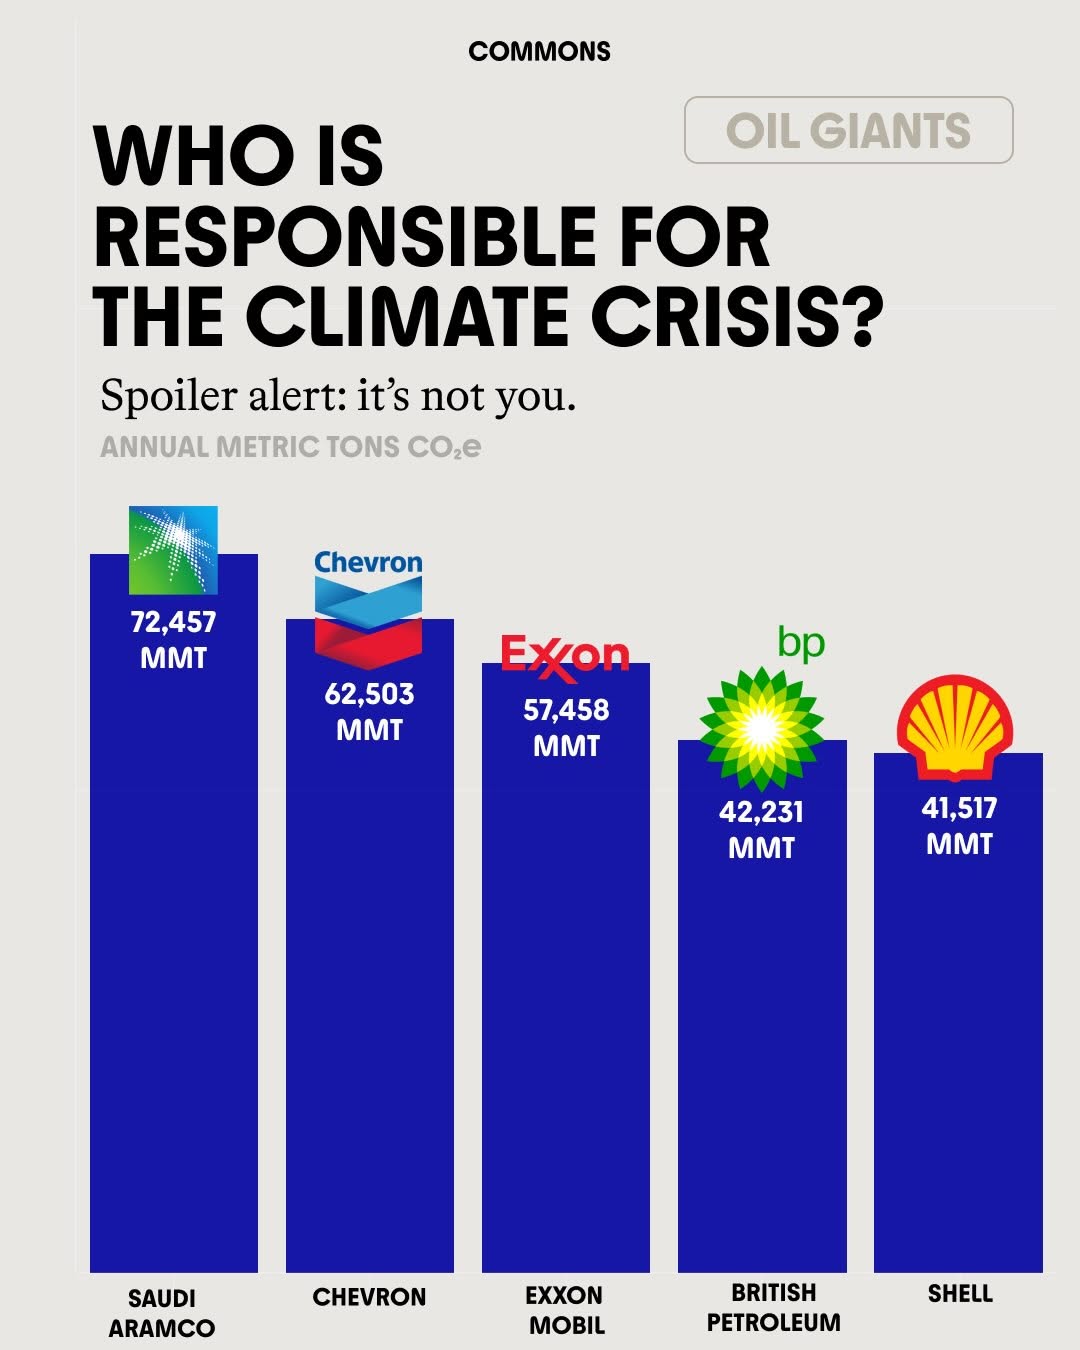
@commonsearth Here’s the tea on who is ACTUALLY responsible 👀 We can’t control the ethical decisions of companies, but you CAN control where your money goes. Every transaction is a vote for the world you want, and the corporations driving the crisis are paying close attention to where us consumers spend our money. #sustainablefinance #carbonfootprint #greenfinance #fossilfuels

View original on Instagram

The edit1 shot · 7 text
Shots Text

Performance

Views
381.4K
Likes
25.4K
Comments
320
Engagement
6.8%
Outlier
38.2×

Video #38223 · Carousel

Bar chart of oil giant emissionsfrom @commonsearth

[01]

Overview

A graphic infographic presenting a bar chart that ranks five major oil companies (Saudi Aramco, Chevron, Exxon Mobil, BP, Shell) by their annual CO2e emissions. The post's purpose is to shift the narrative of climate change responsibility from individuals to large corporations.

[02]

Simple outline

  1. 1Pose a provocative question
  2. 2Absolve the audience directly
  3. 3Present overwhelming visual proof

[03]

Related videos

[04]

Classification

Format
Concepts
Public Service AnnouncementStatement Carousel
Elements
Text OverlayData Visualization GraphicGraphic Overlay

[05]

Hook analysis

What stops the scroll in the first 3 seconds

Title hook · 45%

WHO IS RESPONSIBLE FOR THE CLIMATE CRISIS?

Verbal hook · 25%

Here’s the tea on who is ACTUALLY responsible 👀

Visual hook · 30%

A bold, easy-to-read bar chart infographic with prominent corporate logos, creating a strong visual statement about corporate emissions.

[06]

Hook template

Steal this for your own video

WHO IS ACTUALLY RESPONSIBLE FOR [widely blamed problem]?

  • — WHO IS ACTUALLY RESPONSIBLE FOR THE OBESITY EPIDEMIC?
  • — WHO IS ACTUALLY RESPONSIBLE FOR THE STUDENT DEBT CRISIS?
  • — WHO IS ACTUALLY RESPONSIBLE FOR RISING RENT PRICES?

[07]

Hook and payoff

The promise the opener makes, and how the video pays it back

Hook

A large, bold headline poses a highly debated, emotionally charged question to capture immediate attention and frame the entire post.

Payoff

The payoff is a single, powerful cognitive shift. The viewer instantly receives a clear, simple answer to a complex question, complete with a new target for their concern, all delivered in one glance without needing to swipe.

[08]

Narrative framework

The structural pattern this video runs on

Framework

The Single-Slide Indictment

To reframe a complex issue by posing a provocative question, immediately absolving the audience of blame, and then presenting a single, powerful data visualization that identifies a clear set of external culprits. This entire narrative arc is delivered in one static image.

  1. 1

    The Absolving Spoiler

    A sub-headline immediately answers the question in a way that relieves the viewer of personal guilt or responsibility, creating an instant alliance and making them receptive to the following information.

  2. 2

    The Visual Data Indictment

    A dominant data visualization (e.g., a bar chart) serves as the undeniable evidence, ranking the identified 'culprits' and quantifying their impact. This visually proves the headline's claim and directs the audience's focus.

Themes

  • Corporate Accountability
  • Environmentalism
  • Consumer Activism

Techniques

  • Infographic Design
  • Data Visualization

Trends

  • Data-driven content
  • Activist infographics

Post caption

Here’s the tea on who is ACTUALLY responsible 👀 We can’t control the ethical decisions of companies, but you CAN control where your money goes. Every transaction is a vote for the world you want, and the corporations driving the crisis are paying close attention to where us consumers spend our money. #sustainablefinance #carbonfootprint #greenfinance #fossilfuels

Text overlays

  • title · photo_0

    WHO IS RESPONSIBLE FOR THE CLIMATE CRISIS?

  • contextual · photo_0

    Spoiler alert: it's not you.

  • informational · photo_0

    72,457 MMT

  • informational · photo_0

    62,503 MMT

  • informational · photo_0

    57,458 MMT

  • informational · photo_0

    42,231 MMT

  • informational · photo_0

    41,517 MMT

Bar chart of oil giant emissions | Viral Hooks