@sidewalk.tv
Instagram · Interview Q&A
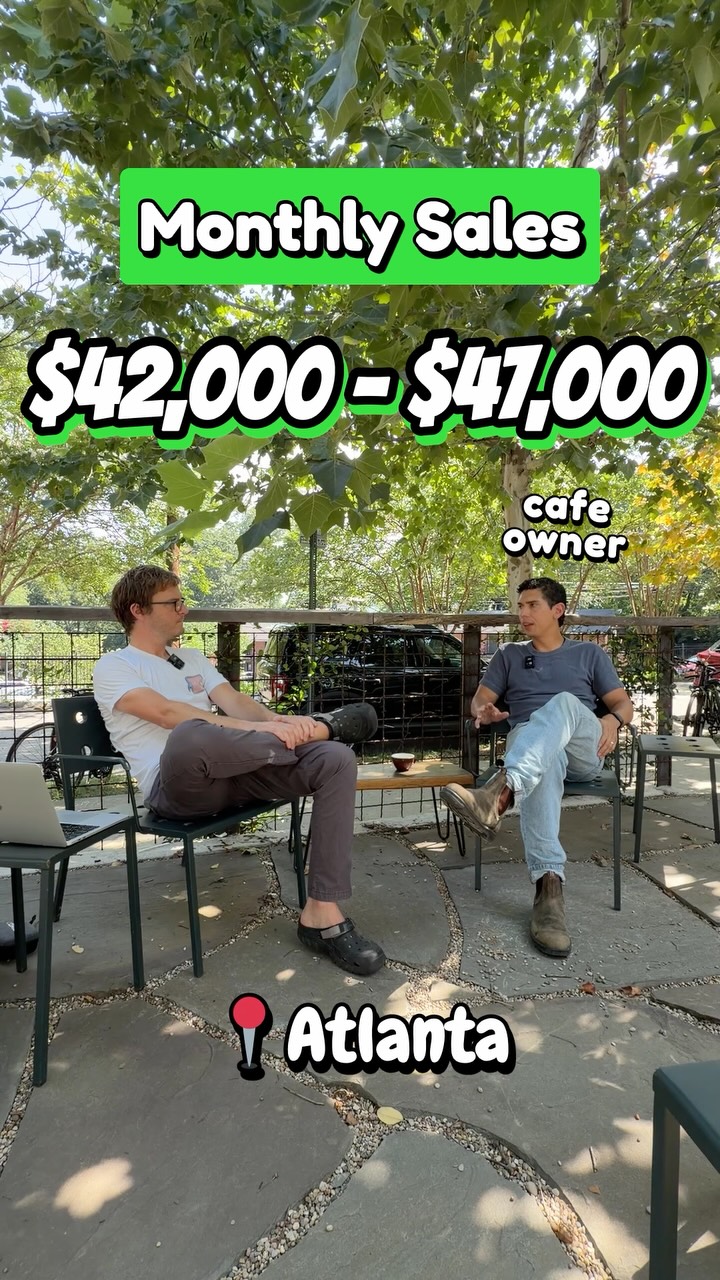
@sidewalk.tv This coffee shop does $500k/year in 400 sqft ☕️

@sidewalk.tv
Instagram · Interview Q&A
@sidewalk.tv This coffee shop does $500k/year in 400 sqft ☕️
Performance
Video #46442 · Interview Q&A
[01]
The creator interviews a coffee shop owner in Atlanta who breaks down his business's key financial metrics. The owner details monthly and annual sales, profit margins, rent costs for his 400 sqft space, the breakdown of major expenses like COGS and labor, and the daily volume of drinks sold on weekdays versus weekends.
[02]
[03]
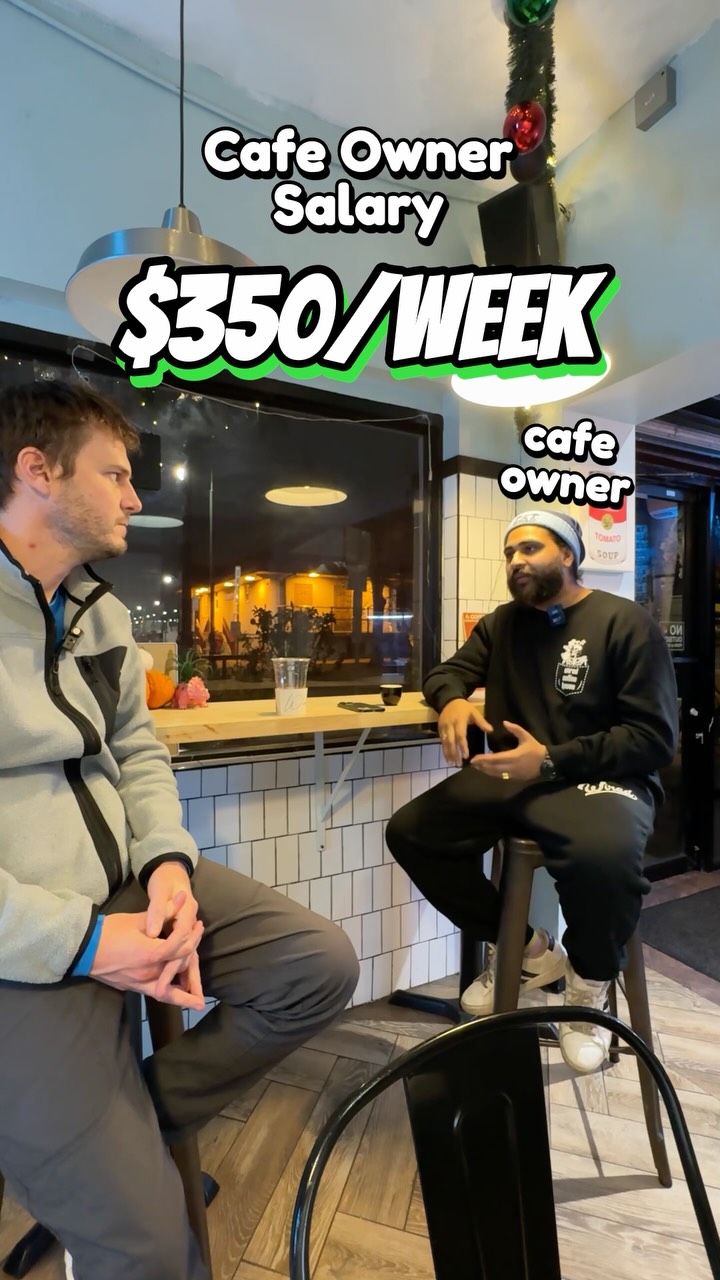 160K1.1×Cafe owner reveals business numbers@sidewalk.tv · Breakdown
 512.9KCoffee truck business financial breakdown@sidewalk.tv · Case Study Breakdown
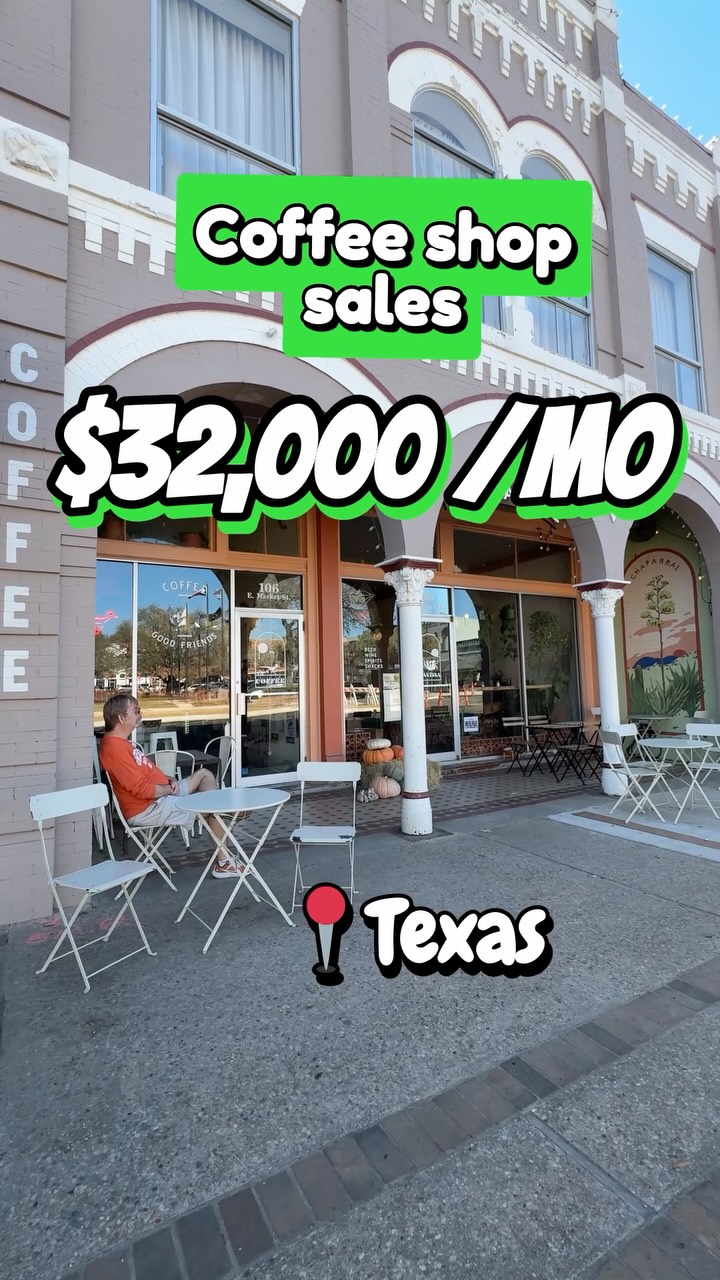 152.5KCoffee shop business financial breakdown@sidewalk.tv · Case Study Breakdown
 243.8K1.1×Restaurant owner breaks down business finances@sidewalk.tv · Case Study Breakdown
 560.7K468×Explains three keys to business success@theburgcoffeecorp · Value Vlog
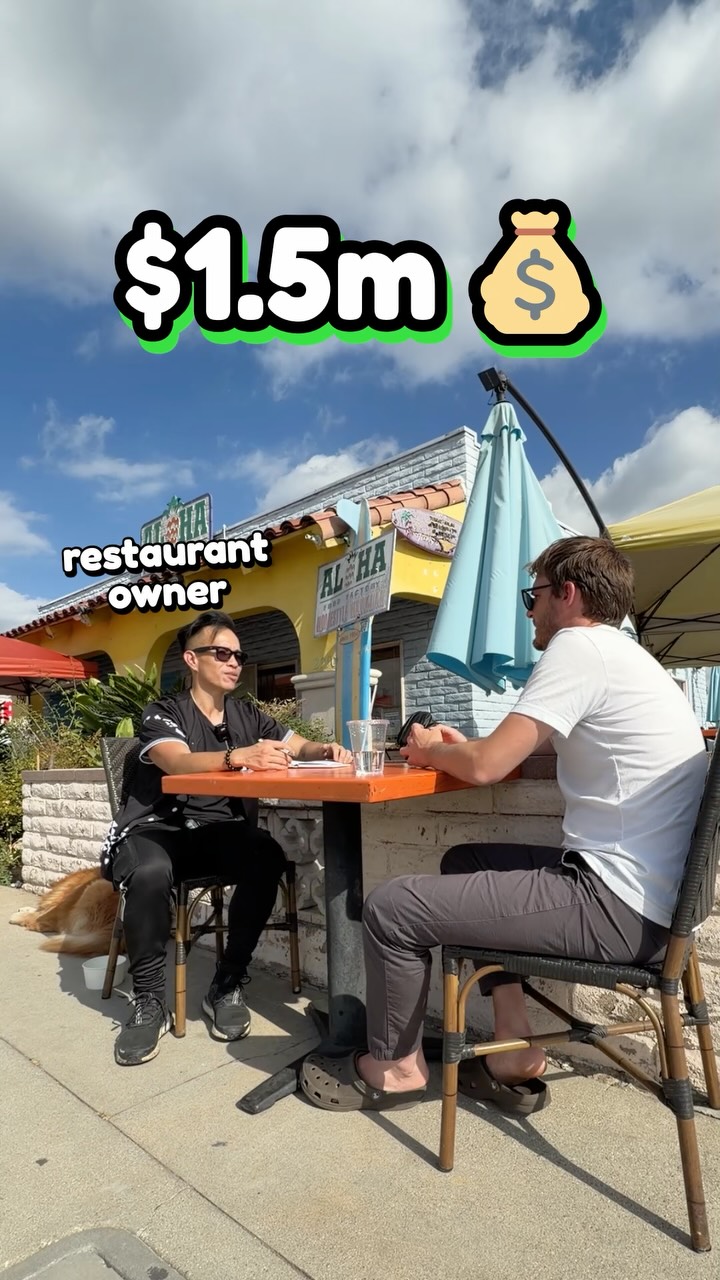 223.3K1.5×Restaurant owner breaks down finances@sidewalk.tv · Breakdown
 358.5K1.8×Coffee chain business metric breakdown@sidewalk.tv · Case Study Breakdown
 87.6KBusiness owner financial breakdown interview@sidewalk.tv · Case Study Breakdown
 988.5K5.2×Cafe owner reveals tough financials@sidewalk.tv · Vulnerable Monologue
 172K17.8×Documenting a coffee business journey.@poorboy.coffee · Journey Documentation
 172K2.3×Transparent restaurant business breakdown@softiesburger · Breakdown
 1.8M62.1×Interview breaks down mobile business@thekoerneroffice · Case Study Breakdown
[04]
[05]
What stops the scroll in the first 3 seconds
Title hook
Sales of a coffee shop?
Verbal hook
Anywhere from 42,000 to 47,000
Visual hook
A wide shot inside a stylish coffee shop with a unique, colorful striped ceiling, showing two people in conversation.
[07]
The promise the opener makes, and how the video pays it back
Hook
A direct, high-level question about a key business metric (e.g., sales, revenue) to create an immediate curiosity gap and promise a data-driven answer.
Payoff
The viewer is left with a comprehensive, multi-faceted understanding of the business's performance, satisfying their initial curiosity with a complete, easy-to-digest data set.
[08]
The structural pattern this video runs on
Framework
The Business Transparency Funnel
To satisfy audience curiosity by systematically revealing the key financial and operational metrics of a relatable business, moving from high-level revenue down to granular daily activity.
The Gross Revenue Reveal
State the most impressive, high-level financial figure (e.g., monthly/annual sales) to establish the business's scale and create an initial 'wow' factor.
The Profitability Reality Check
Introduce the net profit margin and the resulting absolute profit figure, which grounds the large revenue number and adds a layer of business realism.
The Personal Stake Revelation
Clarify the owner's personal financial outcome (e.g., salary vs. profit draw), humanizing the numbers and addressing a common viewer question about entrepreneurship.
The Core Expense Breakdown
Detail the primary fixed and variable costs (e.g., rent, cost of goods, labor) as percentages or absolute numbers to build a complete financial picture.
The Daily Grind Metric
Translate the abstract financial data into a tangible, daily operational unit (e.g., items sold, customers served) to make the business's activity feel concrete and relatable.
This coffee shop does $500k/year in 400 sqft ☕️
title · beginning
Sales of a coffee shop?
contextual · throughout
Atlanta
title · beginning
Monthly Sales
contextual · beginning
cafe owner
informational · beginning
$500,000
title · middle
Profit Margins
informational · middle
12%
informational · middle
$500,000 SALES / 12% MARGINS = Salary
informational · middle
$60,000 PROFIT
title · middle
Rent
informational · middle
400 SQFT
informational · middle
$3,000 / MO
informational · middle
$3,000 / MO + 1-2% OF SALES
title · middle
Big costs
informational · middle
35%
informational · middle
25%
title · end
Drinks sold a day?
informational · end
180 - 200 DRINKS WEEKDAYS
informational · end
2X SAT SUN
informational · end
400 a day
Anywhere from 42,000 to 47,000 this year, you know, we're projected to cross 500 k. So our margins are about worse. I don't pull a salary from tier. So the 12% profit internal square footage is 400 square best, around $3,000 a month. We we also have a percentage rank as part of it. I think it's, like, better a one or 2%. I can't really remember. The biggest for us is is gonna be COGS. It's probably about 35%. And then for labor, it's about 25. No know, we're sort of, like, there at that 60% where you where you wanna be. On a weekday, I would say, you know, anywhere from a 180 to 200. On Saturdays and Sundays, almost double that. So it could get up to, 400.