@sidewalk.tv
Instagram · Interview Q&A

@sidewalk.tv NYC cafe owner pays himself $350/week with $20k/mo in sales 👀

@sidewalk.tv
Instagram · Interview Q&A
@sidewalk.tv NYC cafe owner pays himself $350/week with $20k/mo in sales 👀
Performance
Video #46857 · Interview Q&A
[01]
The creator interviews a New York cafe owner who breaks down his business's key financial metrics. The owner reveals his personal salary, average and peak monthly sales, rent for the small space, daily drink sales volume and price, the variance in daily and monthly revenue, and the number of employees during different seasons.
[02]
[03]
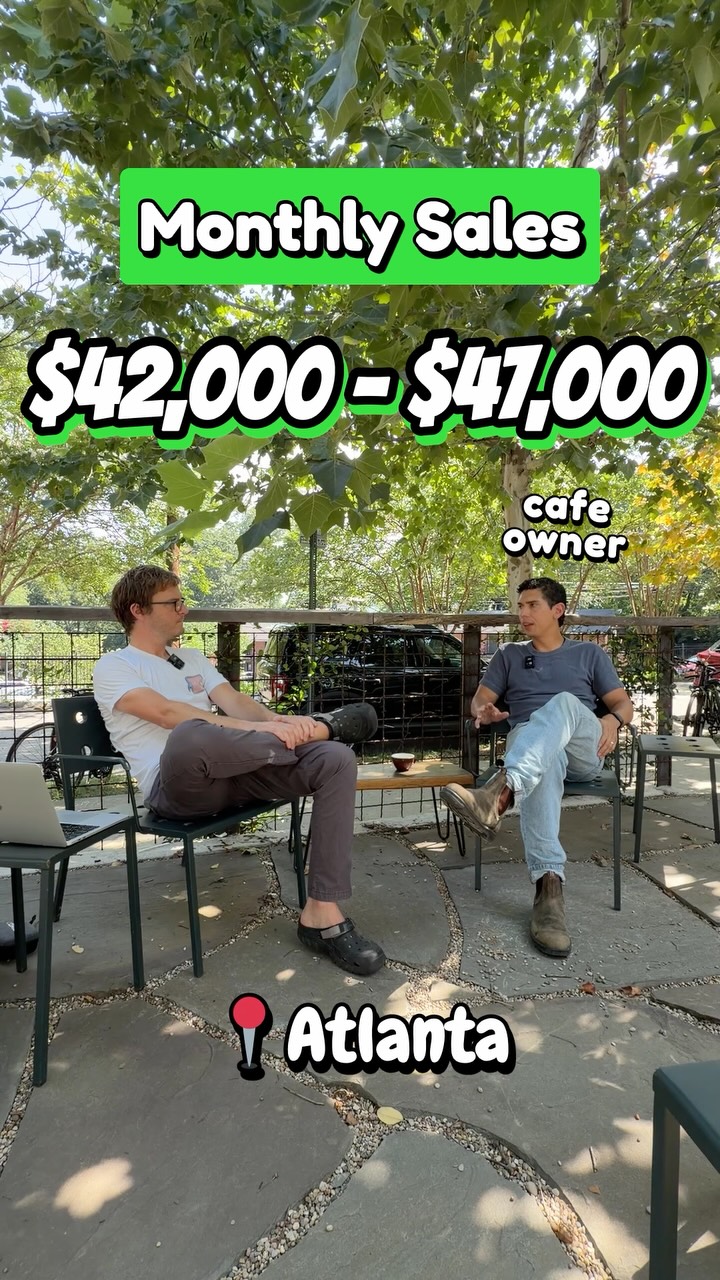 183.2KCoffee shop owner reveals business numbers@sidewalk.tv · Breakdown
 243.8K1.1×Restaurant owner breaks down business finances@sidewalk.tv · Case Study Breakdown
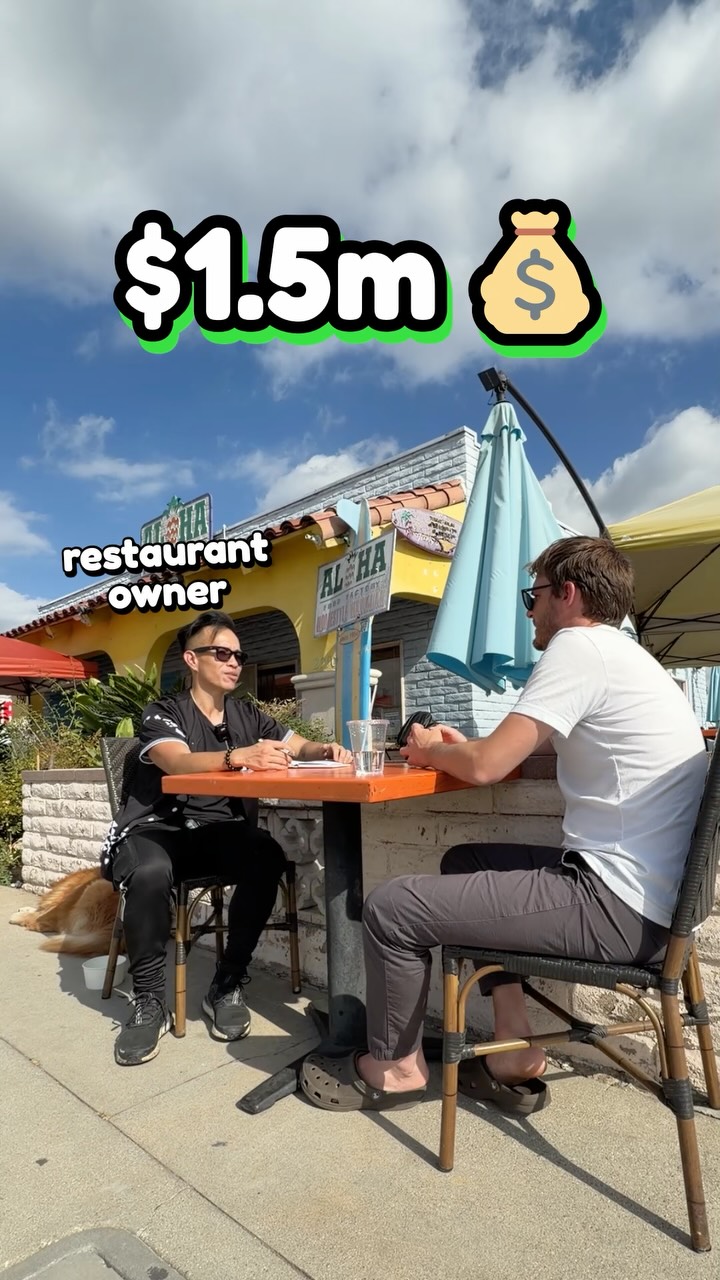 223.3K1.5×Restaurant owner breaks down finances@sidewalk.tv · Breakdown
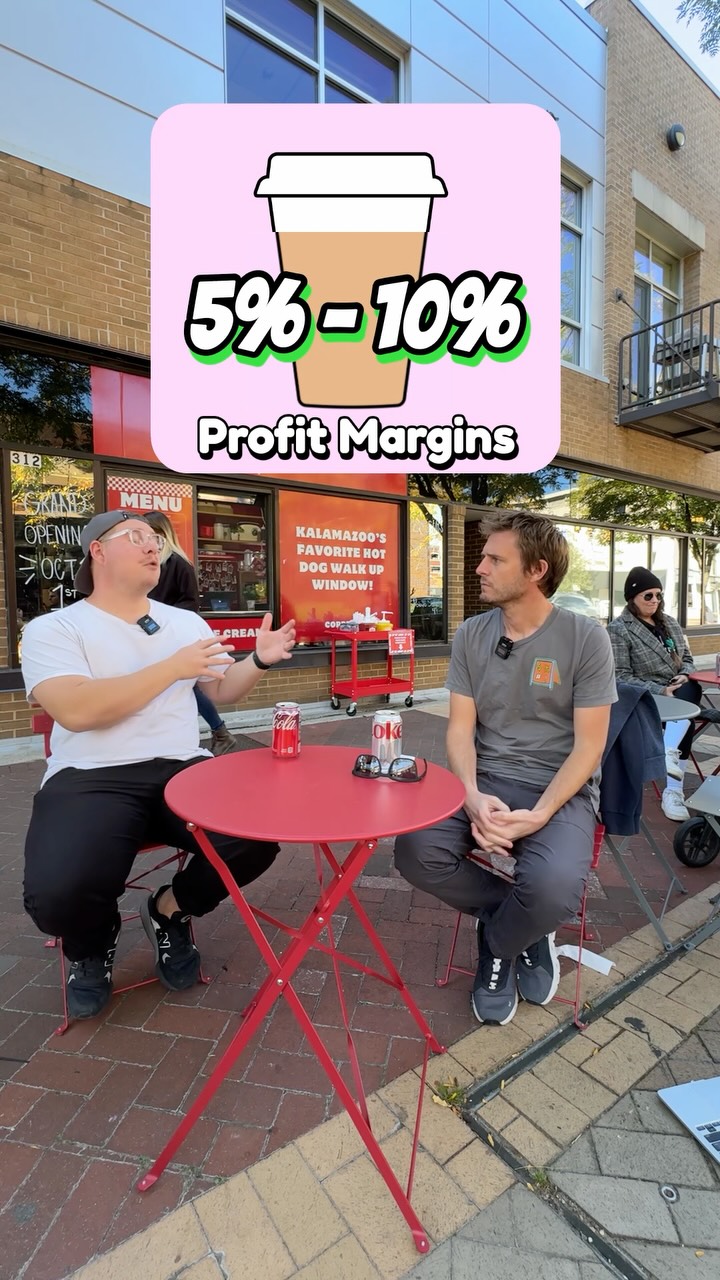 988.5K5.2×Cafe owner reveals tough financials@sidewalk.tv · Vulnerable Monologue
 560.7K468×Explains three keys to business success@theburgcoffeecorp · Value Vlog
 512.9KCoffee truck business financial breakdown@sidewalk.tv · Case Study Breakdown
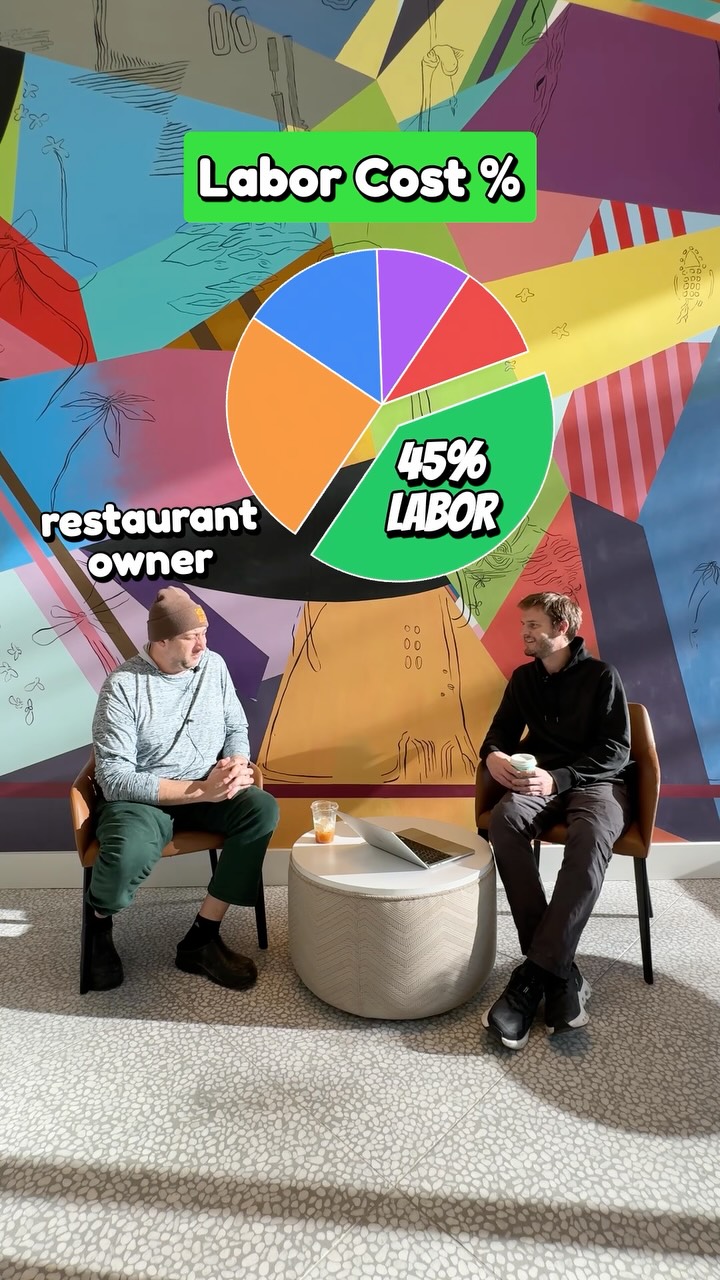 87.6KBusiness owner financial breakdown interview@sidewalk.tv · Case Study Breakdown
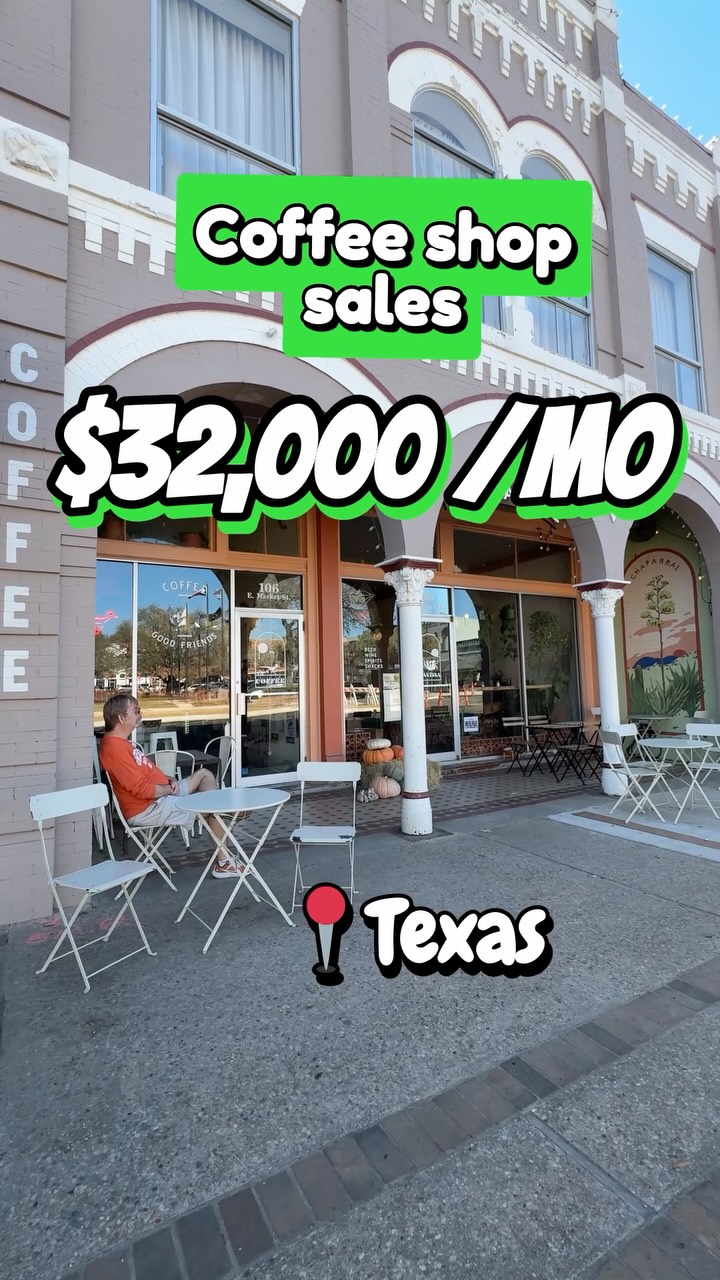 152.5KCoffee shop business financial breakdown@sidewalk.tv · Case Study Breakdown
 172K2.3×Transparent restaurant business breakdown@softiesburger · Breakdown
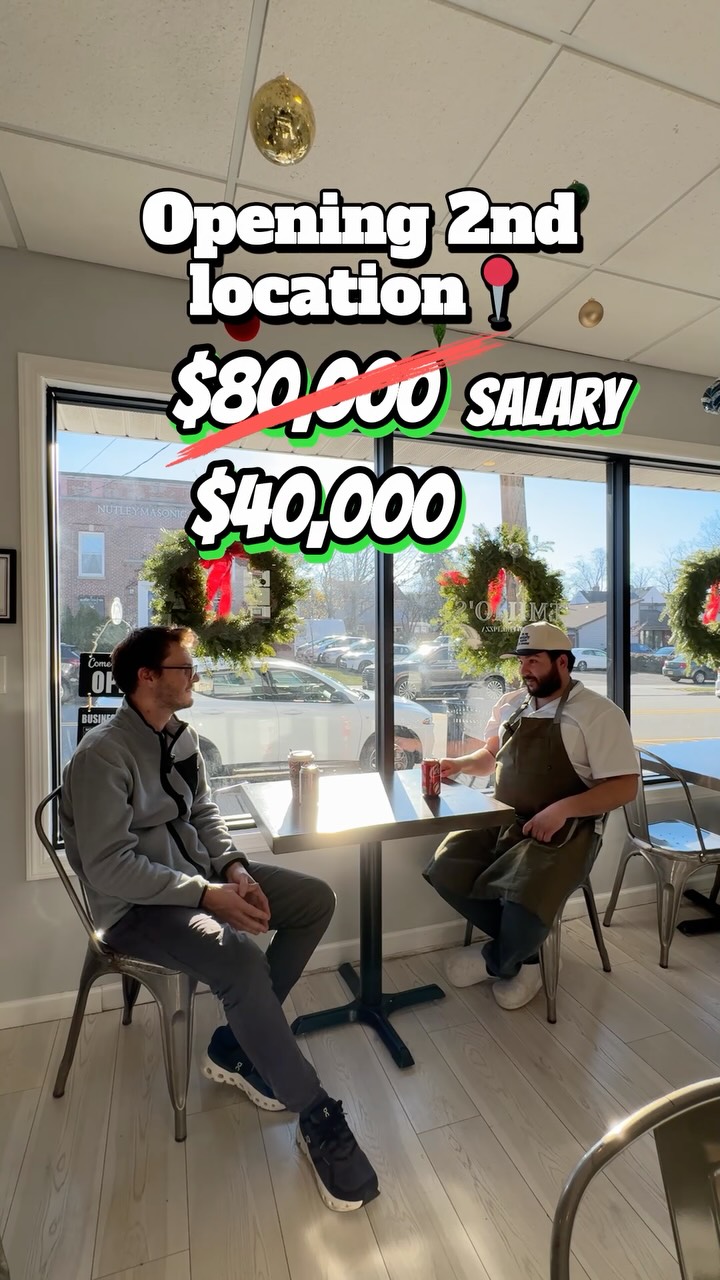 1.2M6.5×Owner reveals salary and growth plan@sidewalk.tv · Case Study Breakdown
 1.1M8.3×Creator breaks down monthly paycheck@raitryna · Breakdown
 358.5K1.8×Coffee chain business metric breakdown@sidewalk.tv · Case Study Breakdown
[04]
[05]
What stops the scroll in the first 3 seconds
Title hook
Cafe Owner Salary
Verbal hook
$3.50 a week, what I was paying myself.
Visual hook
A wide, dynamic shot of the interior of a cozy cafe, establishing the setting and context immediately, with a large, bold title overlay grabbing attention.
[07]
The promise the opener makes, and how the video pays it back
Hook
A surprisingly low or high personal metric (e.g., salary, hours worked) is presented with bold text to create an immediate curiosity gap about the underlying business economics.
Payoff
The viewer is left with a comprehensive, multi-faceted understanding of the subject's financial reality, satisfying the initial curiosity by providing a complete, albeit complex, picture.
[08]
The structural pattern this video runs on
Framework
The Financial Teardown
A rapid-fire Q&A that deconstructs the financial reality of a specific job or business by revealing key metrics in a specific order, starting with a shocking personal number to create a strong curiosity gap.
The Expectation Reset
A grounding statement is made to manage audience expectations and frame the subsequent data with a dose of reality, directly addressing a common misconception (e.g., 'You're not going to become a millionaire...').
The Top-Line Reveal
The gross revenue or primary performance metric is stated, providing the overall scale of the operation and a benchmark against which other numbers will be compared.
The Primary Cost Anchor
The single largest expense (e.g., rent) is detailed, often with contextual constraints (e.g., small size, lack of amenities) that justify the cost or explain operational challenges.
The Unit Metric Breakdown
The top-line number is broken down into a more tangible, per-unit or per-day metric (e.g., drinks sold per day), making the business model easier to comprehend.
The Performance Ceiling
The best-case scenario or highest performance period is revealed, showing the potential upside and adding a layer of aspiration or surprise.
The Volatility Spectrum
The variance between high and low performance periods (daily, monthly) is exposed, illustrating the inconsistency and risk involved in the operation.
The Operational Footprint
A final key metric (like number of employees) is revealed to give a sense of the operational size and complexity, completing the business overview.
NYC cafe owner pays himself $350/week with $20k/mo in sales 👀
title · beginning
Cafe Owner Salary
contextual · beginning
NEW YORK
informational · beginning
$350/WEEK
contextual · beginning
cafe owner
title · middle
Cafe Sales
informational · middle
$20,000 /MO
title · middle
Rent
informational · middle
$3,400 /MO
informational · middle
405 SQFT
informational · middle
- No bathroom - No kitchen
title · middle
Drinks sold a day?
informational · middle
125 DRINKS
informational · middle
$7.50
title · middle
Highest Sales month?
informational · middle
$60,000
informational · middle
$40,000
informational · middle
$25,000
title · middle
Daily Sales
informational · middle
$750 - $800/DAY
informational · middle
SOME DAYS: $400
informational · middle
WEEKENDS: $2,000
title · end
Employees
informational · end
3
informational · end
7 - 8
$3.50 a week, what I was paying myself. You're not gonna become a millionaire from one cafe. A healthy average would be about 20,000 a month. So what's the total of square feet? Four zero five square feet. Rank came up to about 3,400. Yep. It was a small space. Yep. We didn't have a public facing bathroom. Barely had enough space to make the kitchen work. I'd say about, like, a tier drinks at an average of, like, $7.50 a drink. It depends. We've had months where there's $60,000 a month. Right? Mhmm. Best $260,000 a month, $340,000 a month, and the rest are all like $25,000 a month, $20,000 a month. $75,800 a day on average. Some days it's $400 and then on a weekend we do $2,000 a day on a weekend. Now we have three. At peak, during peak season, maybe like $7.08.