@sidewalk.tv
Instagram · Interview Q&A
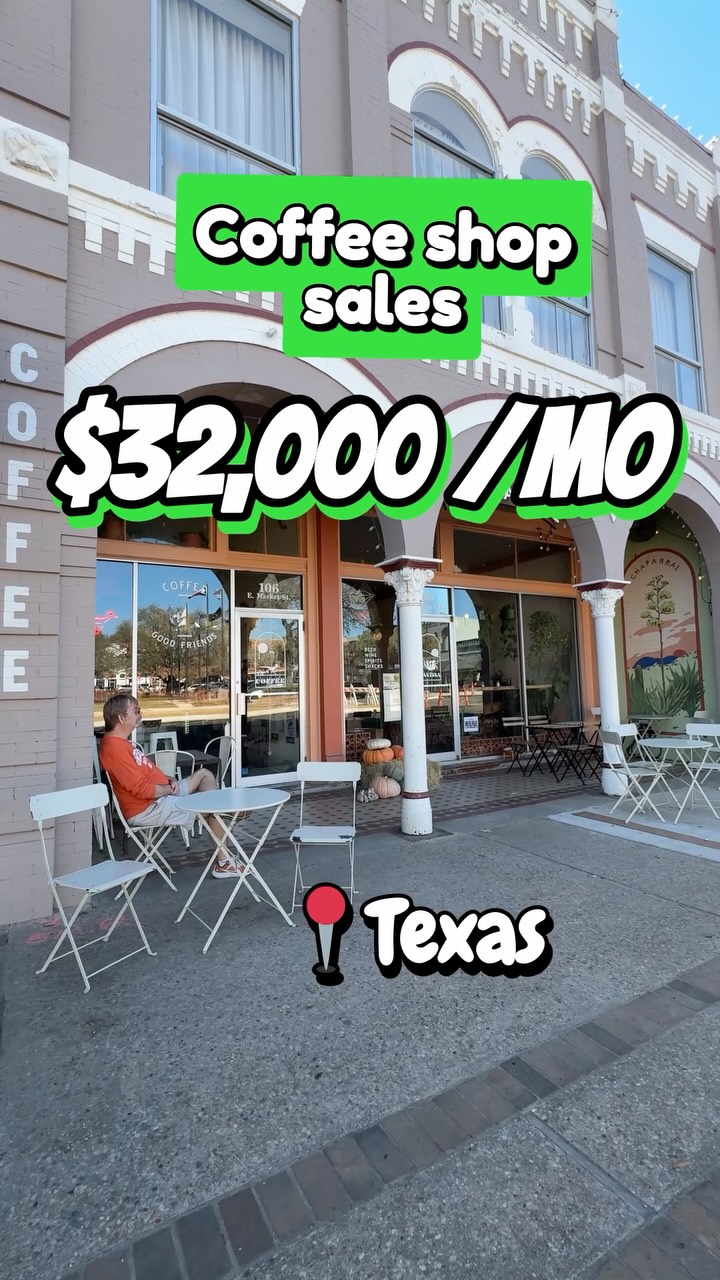
@sidewalk.tv $32k/month in sales. $5k in labor. $1,100 in rent 👀

@sidewalk.tv
Instagram · Interview Q&A
@sidewalk.tv $32k/month in sales. $5k in labor. $1,100 in rent 👀
Performance
Video #46856 · Interview Q&A
[01]
The creator presents a financial case study of a coffee shop in Lockhart, Texas, by interviewing the owner. Through a montage of B-roll, interview clips, and prominent text overlays, the video breaks down the shop's key metrics, including monthly sales ($32k), startup costs ($27k), labor costs ($5k), and rent ($1.1k), while also detailing product pricing, employee wages, tips, and customer volume patterns.
[02]
[03]
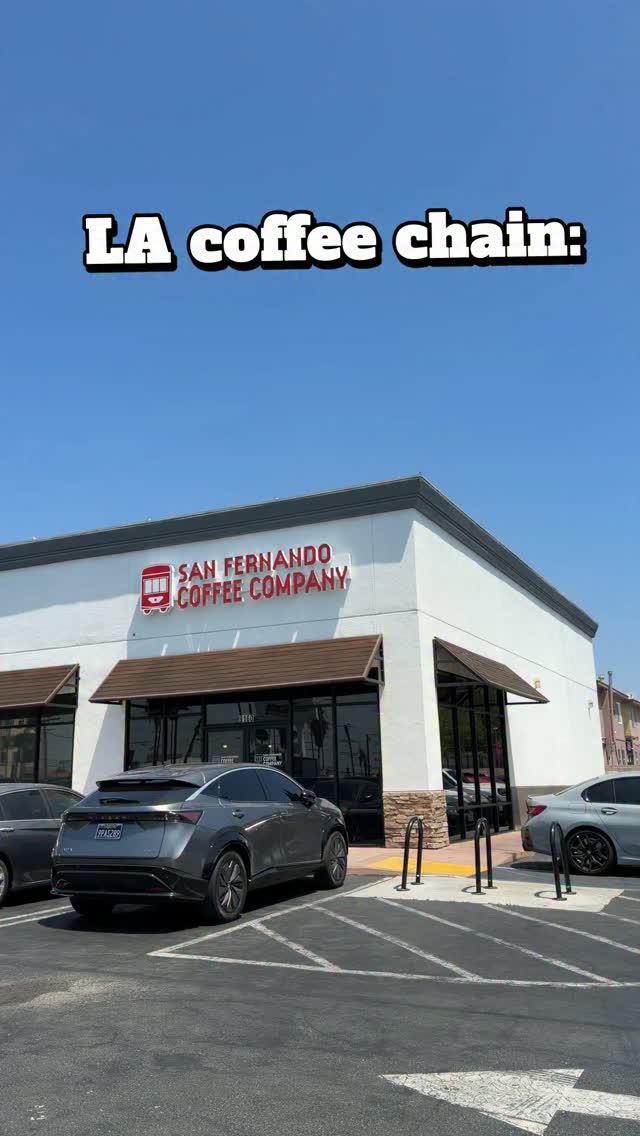 358.5K1.8×Coffee chain business metric breakdown@sidewalk.tv · Case Study Breakdown
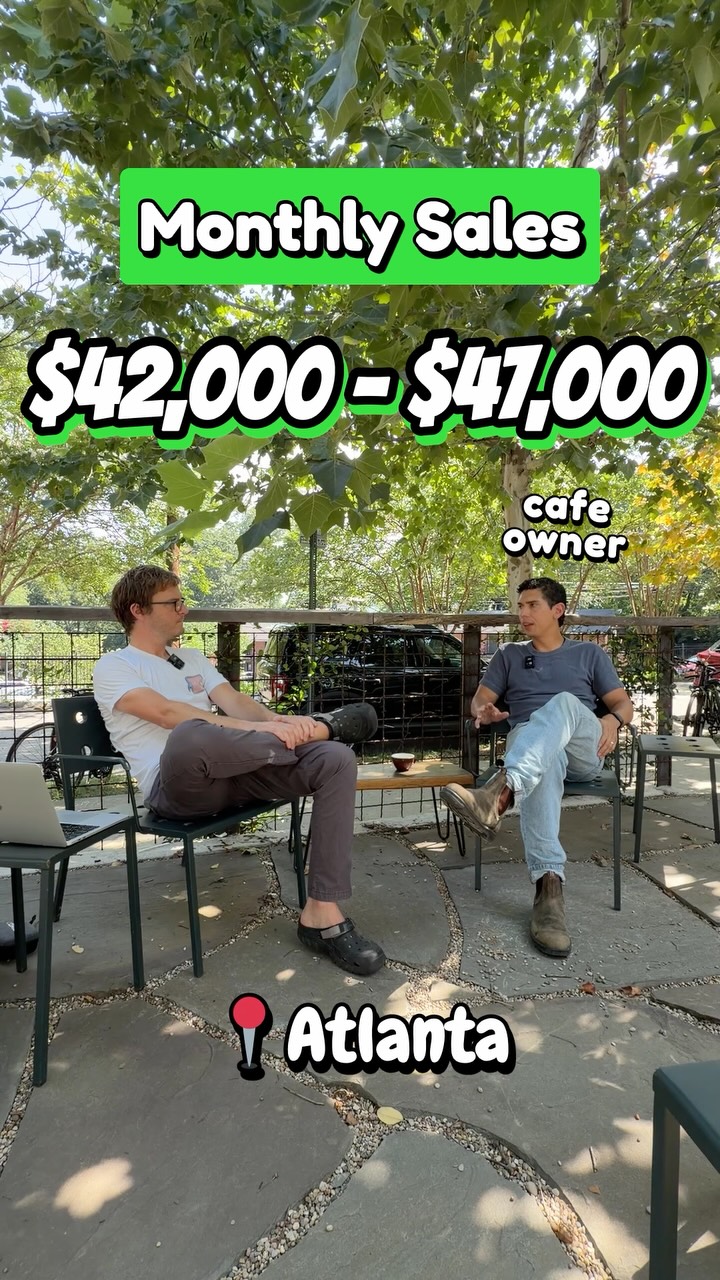 183.2KCoffee shop owner reveals business numbers@sidewalk.tv · Breakdown
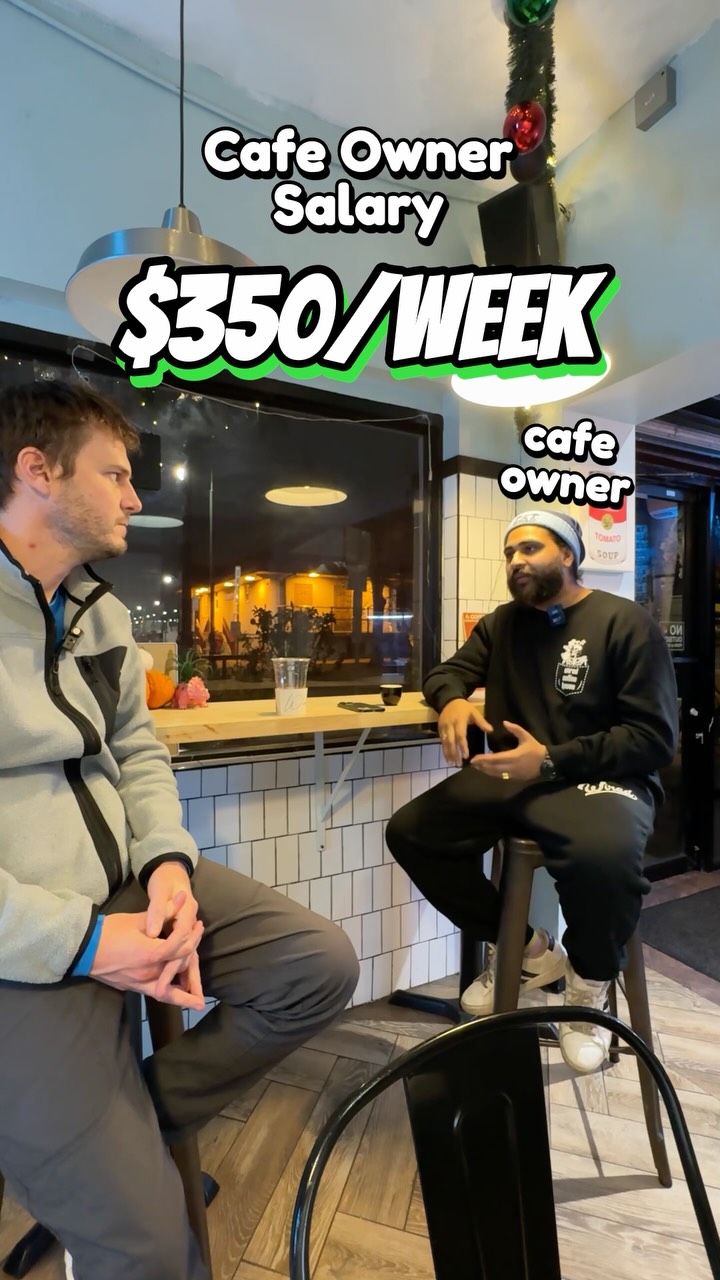 160K1.1×Cafe owner reveals business numbers@sidewalk.tv · Breakdown
 512.9KCoffee truck business financial breakdown@sidewalk.tv · Case Study Breakdown
 243.8K1.1×Restaurant owner breaks down business finances@sidewalk.tv · Case Study Breakdown
 560.7K468×Explains three keys to business success@theburgcoffeecorp · Value Vlog
 4.6MInspirational advice with sarcastic punchline · Relatable One Shot
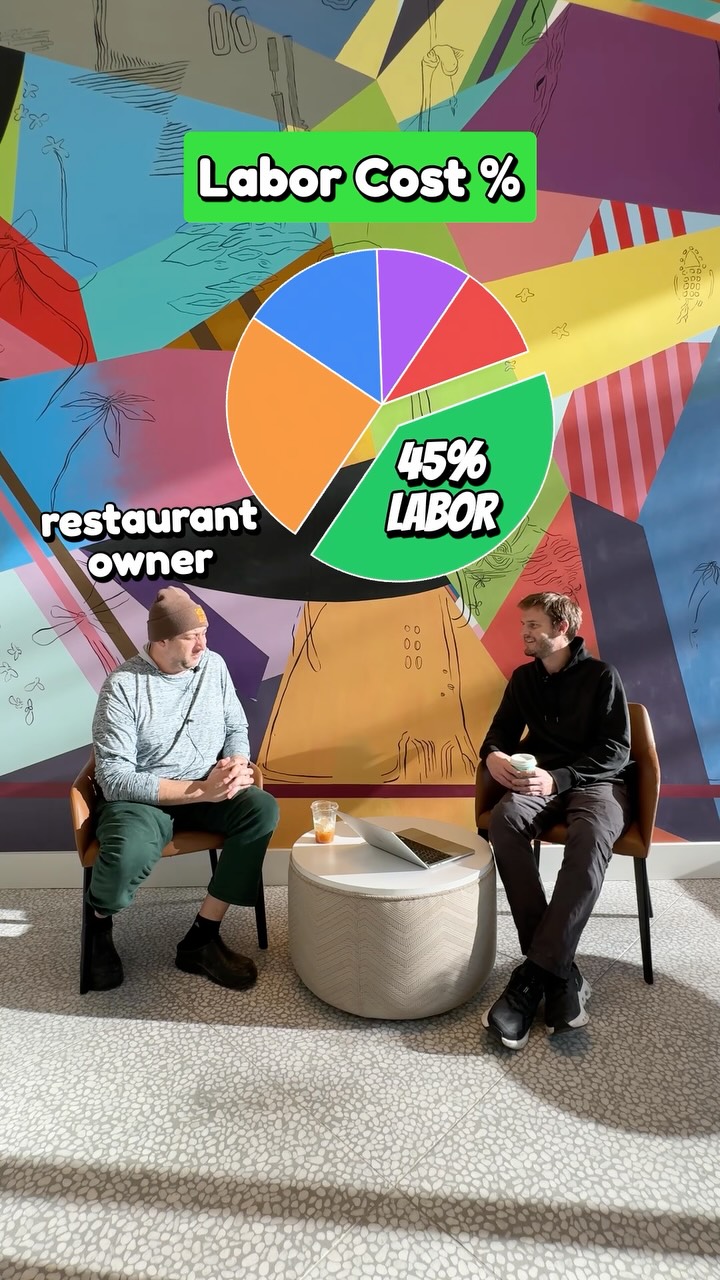 87.6KBusiness owner financial breakdown interview@sidewalk.tv · Case Study Breakdown
 223.3K1.5×Restaurant owner breaks down finances@sidewalk.tv · Breakdown
 172K2.3×Transparent restaurant business breakdown@softiesburger · Breakdown
 172K17.8×Documenting a coffee business journey.@poorboy.coffee · Journey Documentation
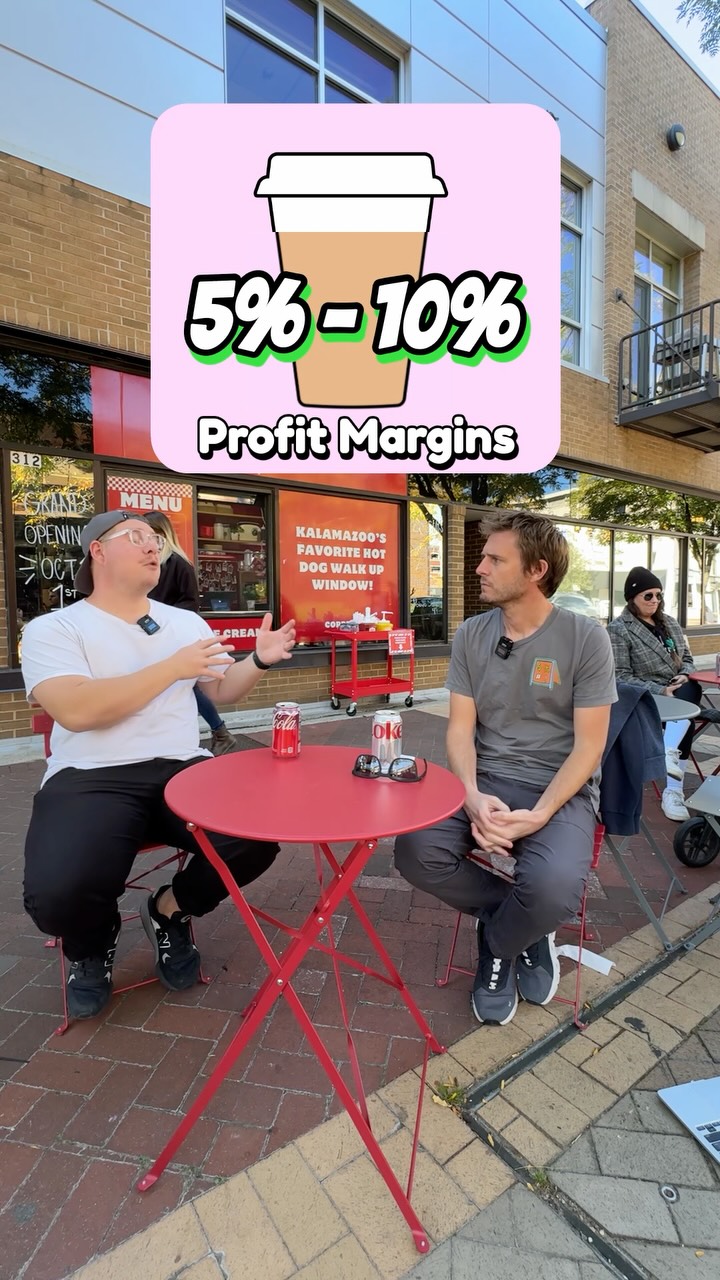 988.5K5.2×Cafe owner reveals tough financials@sidewalk.tv · Vulnerable Monologue
[04]
[05]
What stops the scroll in the first 3 seconds
Title hook · 85%
Coffee shop sales $32,000 /MO
Visual hook · 15%
The video opens with an aesthetically pleasing interior shot of a coffee shop filled with numerous green plants, viewed through an arched window, creating an inviting and visually rich scene.
[06]
Steal this for your own video
sales $ /MO
[07]
The promise the opener makes, and how the video pays it back
Hook
Immediately present the single most impressive, high-level metric (e.g., total sales) as a bold, on-screen number to establish high stakes and create immediate curiosity.
Payoff
Reveal the final contextualizing pieces of information (e.g., customer volume, physical location) that tie all the previous data points together, providing a satisfying explanation for the entity's success and leaving the viewer with a complete picture.
[08]
The structural pattern this video runs on
Framework
The Business X-Ray
To deconstruct a seemingly complex entity (like a business) into a series of simple, digestible, and often surprising data points, satisfying viewer curiosity about 'how it really works' by presenting revenue first and then chipping away at it with costs.
The Barrier to Entry
Reveal the initial, one-time investment required to start, grounding the narrative in reality and establishing the initial risk.
The Primary Cost Drain
Introduce the largest, most significant recurring cost (e.g., labor), beginning the process of breaking down the initial impressive metric.
The Efficiency Ratio
Re-contextualize the primary cost as a percentage of the top-line metric, providing an industry-standard benchmark for analysis and adding a layer of business acumen.
The Unfair Advantage
Reveal a surprisingly low or efficient cost (e.g., rent) that creates a 'wow' moment and highlights a key secret to the model's viability.
The Unit Economic
Drill down to the value of a single unit of production (e.g., price per latte), connecting the macro financial view to the micro-transactional level.
The Human Element Breakdown
Detail the costs at the individual employee level (e.g., hourly wages), humanizing the larger cost categories.
The Compensation Kicker
Reveal a secondary source of compensation (e.g., tips) that completes the financial picture for the human element and demonstrates viability for staff.
The Operational Cadence
Visualize the rhythm of the operation over a typical cycle (e.g., a weekly sales chart) to show peaks and troughs in activity.
$32k/month in sales. $5k in labor. $1,100 in rent 👀
title · beginning
Coffee shop sales
informational · beginning
$32,000 /MO
contextual · beginning
Texas
title · beginning
Startup Costs 🔨
informational · beginning
$27,000
title · beginning
Labor cost
informational · beginning
$5,000 /MO
informational · beginning
LABOR IS 16% OF SALES
title · middle
Rent
informational · middle
$1,100 /mo
contextual · middle
Lockhart, TX
informational · middle
650 SQFT
title · middle
LATTE PRICE
informational · middle
$4
title · middle
Wages
informational · middle
$10-12 /HR
title · middle
Tips 🥫
informational · middle
+$8-12 TIPS /HR
informational · middle
Owner still works shifts
title · end
Weekly Sales? 📈
informational · end
WEEKEND CUSTOMERS: 180-200