@sidewalk.tv
Instagram · Interview Q&A
@sidewalk.tv This 27 year old has 32 coffee shop locations, no investors 👀

@sidewalk.tv
Instagram · Interview Q&A
@sidewalk.tv This 27 year old has 32 coffee shop locations, no investors 👀
Performance
Video #47264 · Interview Q&A
[01]
The creator presents a case study of the San Fernando Coffee Company, using a montage of B-roll and interview shots. The video relies on text overlays to reveal the company's key business metrics, including its multi-million dollar monthly sales, number of locations, and expansion plans. It highlights the 27-year-old owner, breaks down major costs like payroll, states the company's profit margins, and emphasizes that the business is bootstrapped with no investors.
[02]
[03]
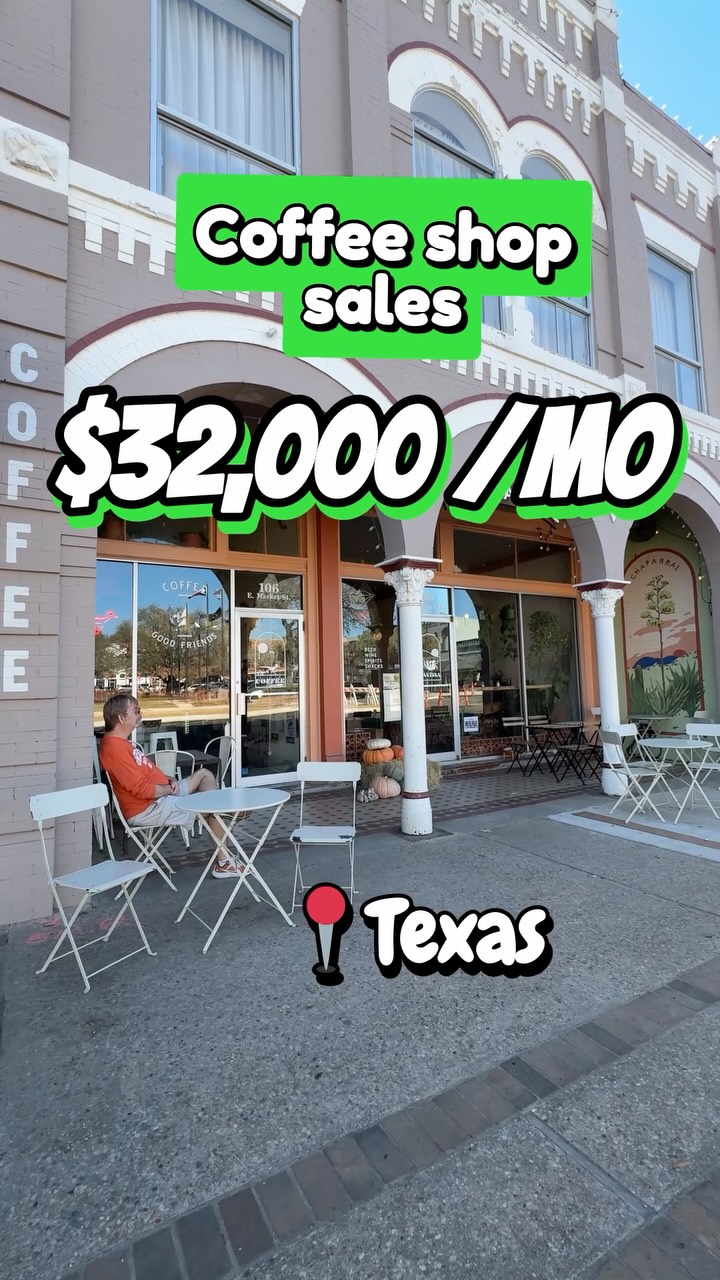 152.5KCoffee shop business financial breakdown@sidewalk.tv · Case Study Breakdown
 512.9KCoffee truck business financial breakdown@sidewalk.tv · Case Study Breakdown
 599.7K2.6×Business idea case study breakdown@anuar.wealth · Case Study Breakdown
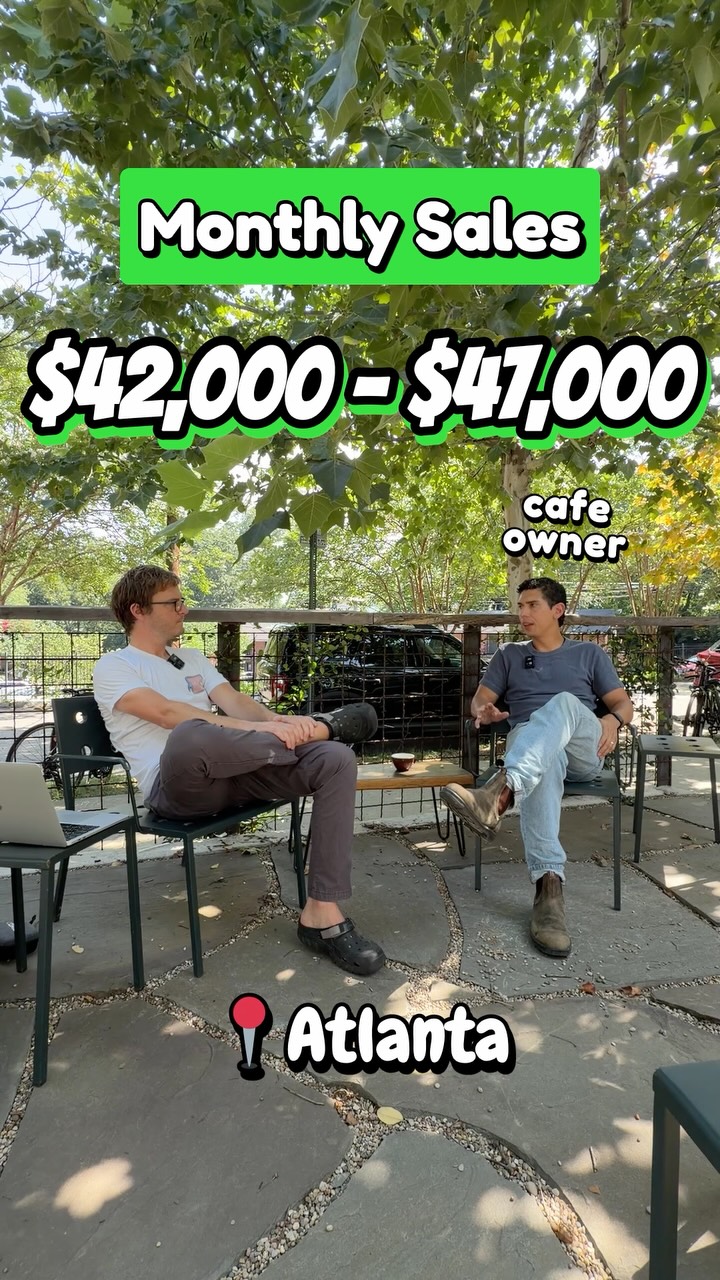 183.2KCoffee shop owner reveals business numbers@sidewalk.tv · Breakdown
 378.9K1.8×Montage of small business packing orders@mmoire_official · Motivational Mantra
 161.1K7×Behind the scenes brand photoshoot@millygoldsmith · Behind The Scenes
 560.7K468×Explains three keys to business success@theburgcoffeecorp · Value Vlog
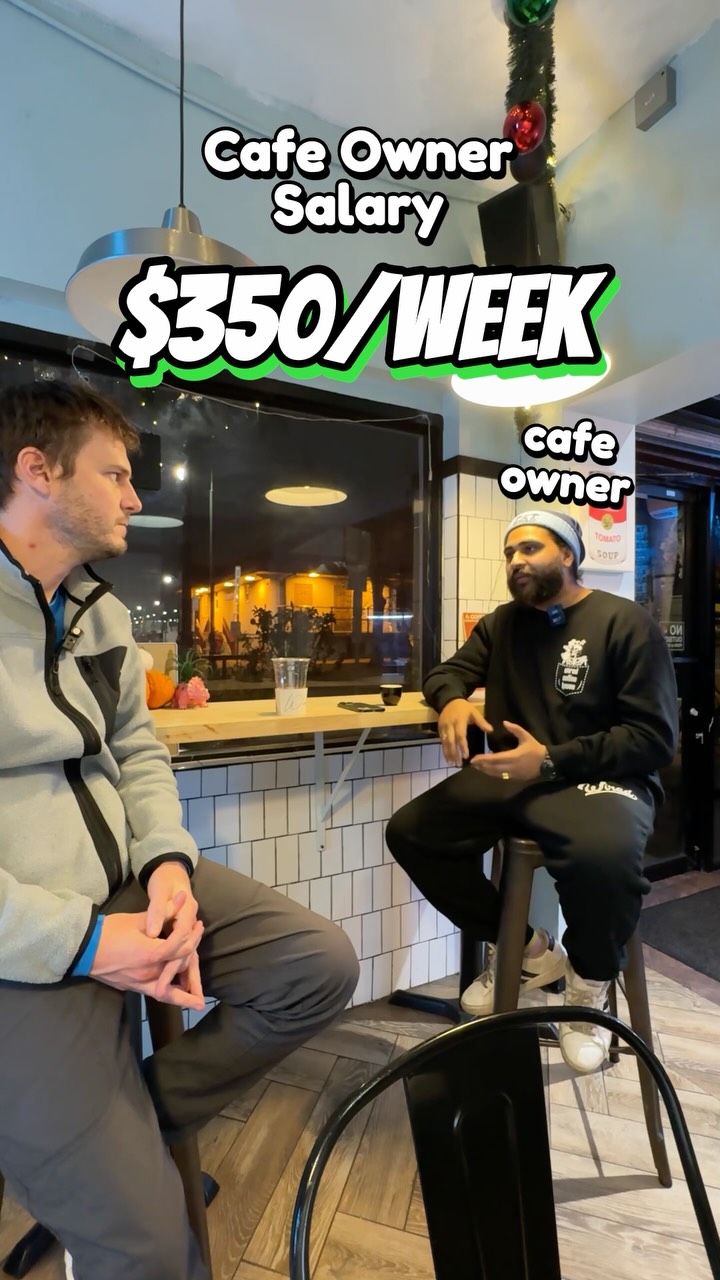 160K1.1×Cafe owner reveals business numbers@sidewalk.tv · Breakdown
 11.8M8.8×Founder's journey from start to success@livportio · Origin Story
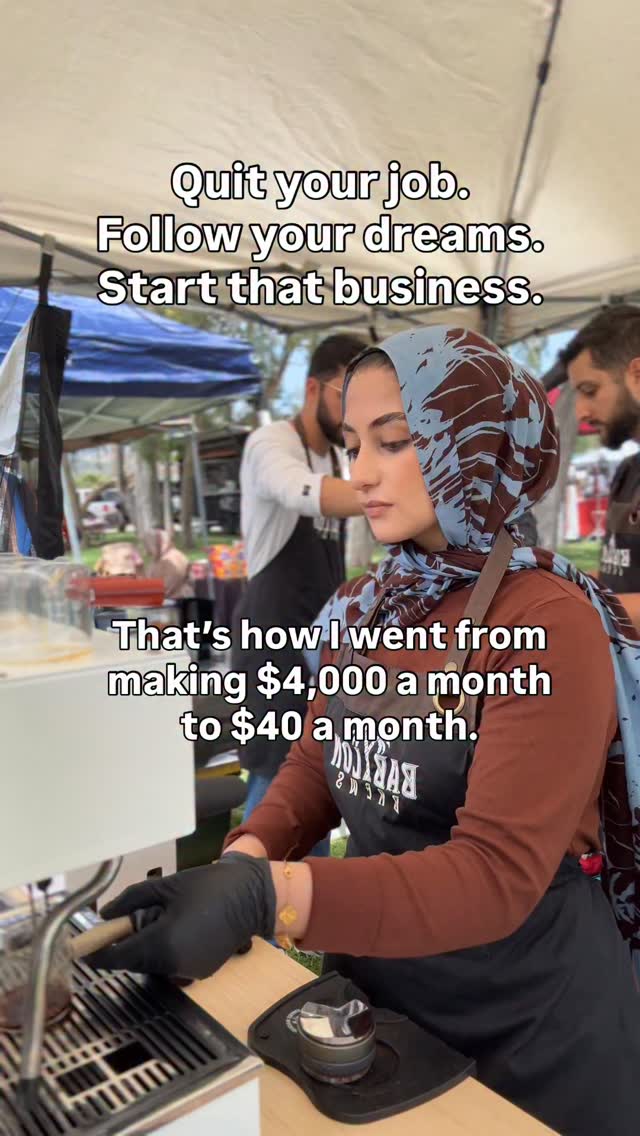 4.6MInspirational advice with sarcastic punchline · Relatable One Shot
 172K17.8×Documenting a coffee business journey.@poorboy.coffee · Journey Documentation
 1.2M9.5×Split screen business case study@rony · Case Study Breakdown
[04]
[05]
What stops the scroll in the first 3 seconds
Title hook · 90%
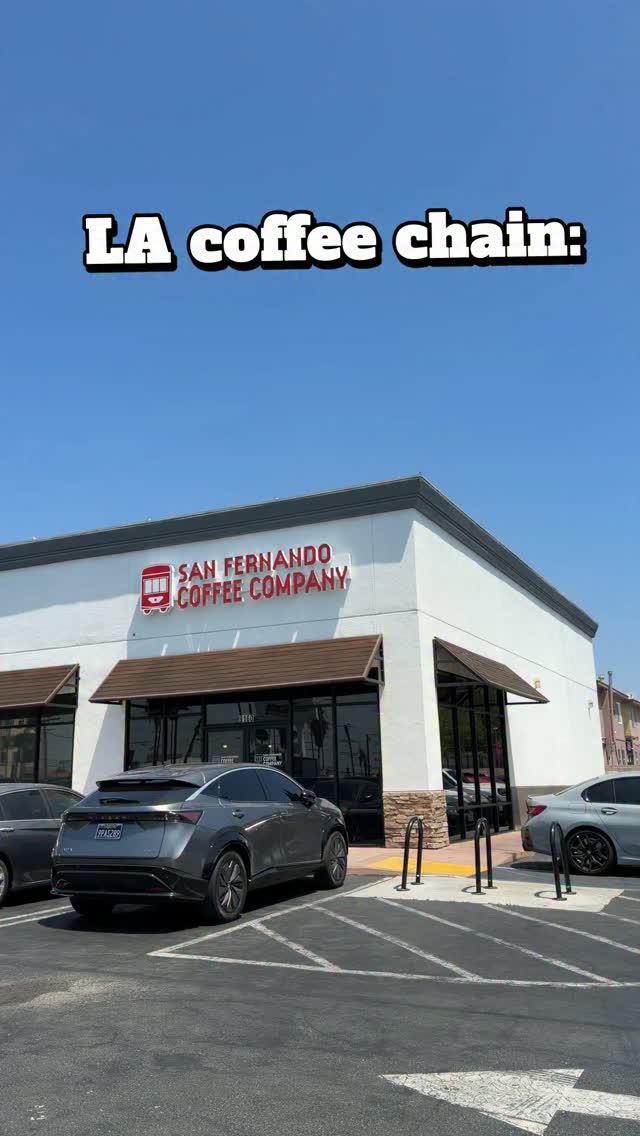
LA coffee chain: $1.3M - $1.6M MONTHLY SALES
Visual hook · 10%
A clean, wide establishing shot of the coffee shop's modern storefront under a bright, clear blue sky, creating an appealing and professional first impression.
[06]
Steal this for your own video
: SALES
[07]
The promise the opener makes, and how the video pays it back
Hook
Present a jaw-dropping, top-line financial metric (e.g., monthly sales) to establish high stakes and immediately capture attention.
Payoff
The final reveal that the entire operation was bootstrapped, which serves as the ultimate aspirational climax to the success story.
[08]
The structural pattern this video runs on
Framework
The Business Deconstructed
To showcase the impressive success of a business by systematically revealing key financial metrics in a question-and-answer format, building from top-line revenue down to profitability and operational reality, culminating in an aspirational twist.
The Humanizer & Scale Proof
Introduce the surprisingly relatable protagonist (e.g., young owner) and the impressive scale of the operation (e.g., number of locations) to ground the initial claim.
The Growth Vector
Show evidence of future expansion to demonstrate that the success is not static but accelerating, escalating the narrative's momentum.
The Practicality Probe
Pose a common, real-world business question about a major cost (e.g., labor) to create a relatable point of tension and anticipation.
The Cost Revelation
Answer the cost question with another large, specific number, reinforcing the scale of the operation and satisfying the viewer's curiosity.
The Financial X-Ray
Use a simple graphic (e.g., a pie chart) to visually break down the major cost categories, providing a quick, digestible business insight.
The Ultimate Question
Pose the final, most important question about profitability, setting up the video's primary payoff.
The Profitability Payoff
Reveal the core profit margin percentage, delivering the key piece of information the entire video has been building towards.
The Granular Proof
Provide specific performance data from individual units or locations to add credibility and make the macro numbers more tangible.
The Aspirational Twist
Reveal a surprising and impressive detail about how the success was achieved (e.g., no investors, bootstrapped), elevating the story's impact.
The Performance Spectrum
Contrast the performance of the lowest-performing and highest-performing units to provide a realistic, transparent, and comprehensive view of the business.
This 27 year old has 32 coffee shop locations, no investors 👀
title · beginning
LA coffee chain: $1.3M - $1.6M MONTHLY SALES
informational · beginning
17 cafes
informational · beginning
27 yr old owner
informational · beginning
15 new under construction
informational · middle
LABOR COST ?
informational · middle
PAYROLL $400K - $500K A MONTH
contextual · middle
Costs
informational · middle
PAYROLL 25%
informational · middle
Profit Margins % 15% - 22%
informational · middle
This store: $165,000 /mo SALES
informational · middle
Rialto Location: $300,000 /mo SALES
informational · end
No investors
informational · end
💯 Bootstrapped
contextual · end
Daily Sales 📈
informational · end
$1,300 SALES A DAY (slowest shop)
informational · end
$9,000 /DAY (busiest shop)