@sidewalk.tv
Instagram · Talking Head Edit
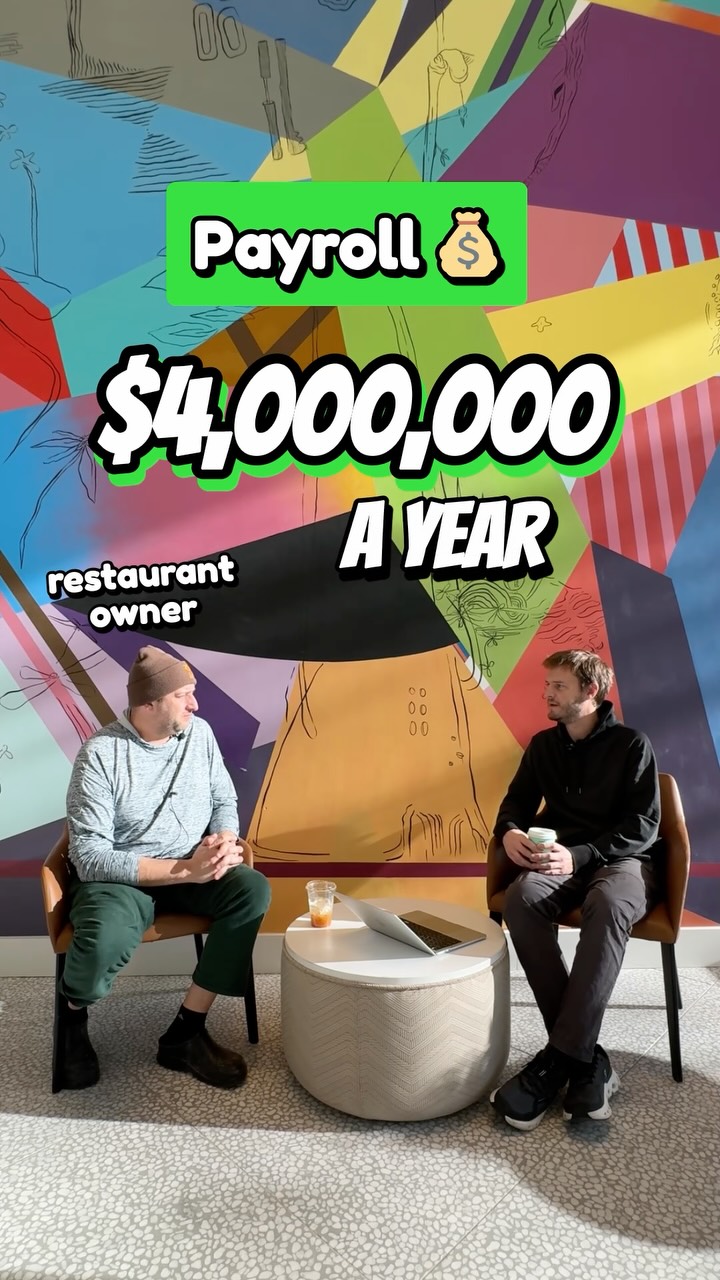
@sidewalk.tv This restaurant owner talks about annual sales and rising costs of the restaurant industry 👀

@sidewalk.tv
Instagram · Talking Head Edit
@sidewalk.tv This restaurant owner talks about annual sales and rising costs of the restaurant industry 👀
Performance
Video #46863 · Talking Head Edit
[01]
The creator interviews a Boston-based restaurant owner who reveals his group's projected annual sales of $8 million. The owner then breaks down the high labor costs, which are around 45% of sales, and explains how the traditional restaurant cost structure (30% food, 30% labor) is no longer viable. He states that a 40% labor cost is the new reality, pushing the combined food and labor costs to 70%, and discusses the challenge of menu prices not rising at the same rate as these costs.
[02]
[03]
 87.6KBusiness owner financial breakdown interview@sidewalk.tv · Case Study Breakdown
 223.3K1.5×Restaurant owner breaks down finances@sidewalk.tv · Breakdown
 243.8K1.1×Restaurant owner breaks down business finances@sidewalk.tv · Case Study Breakdown
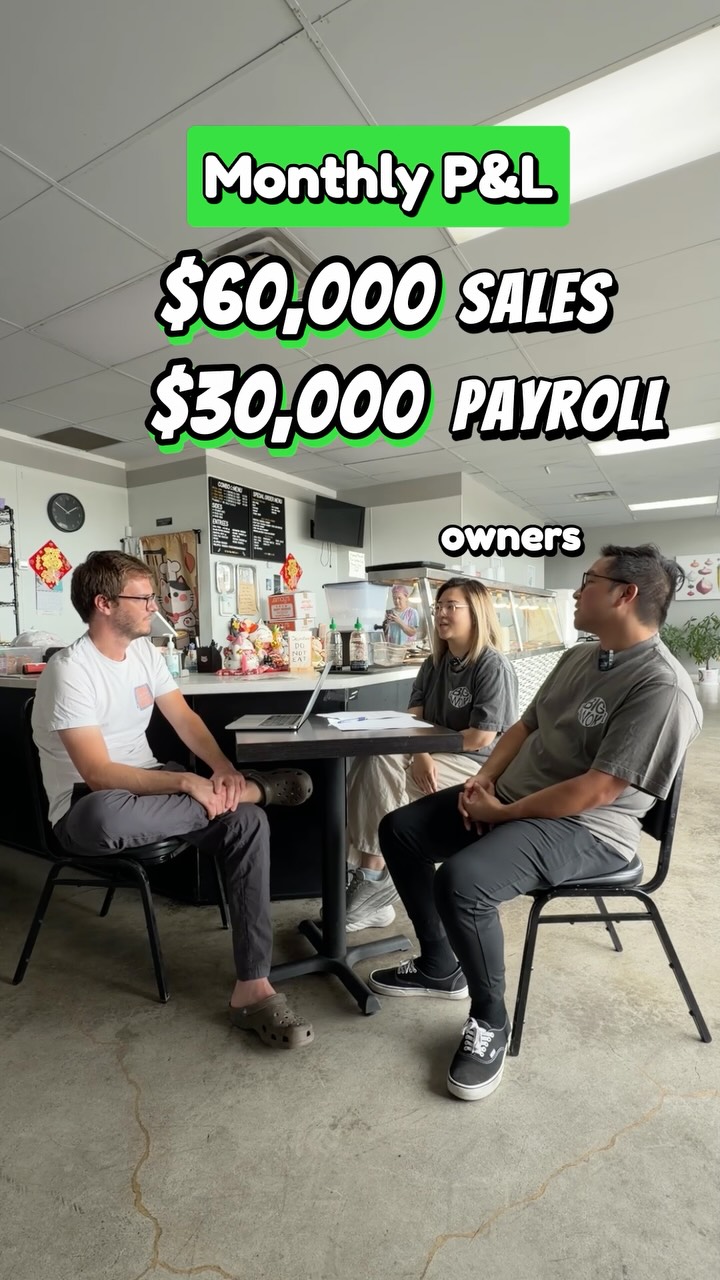 1.9M9.8×Restaurant owners reveal monthly profit@sidewalk.tv · Case Study Breakdown
 172K2.3×Transparent restaurant business breakdown@softiesburger · Breakdown
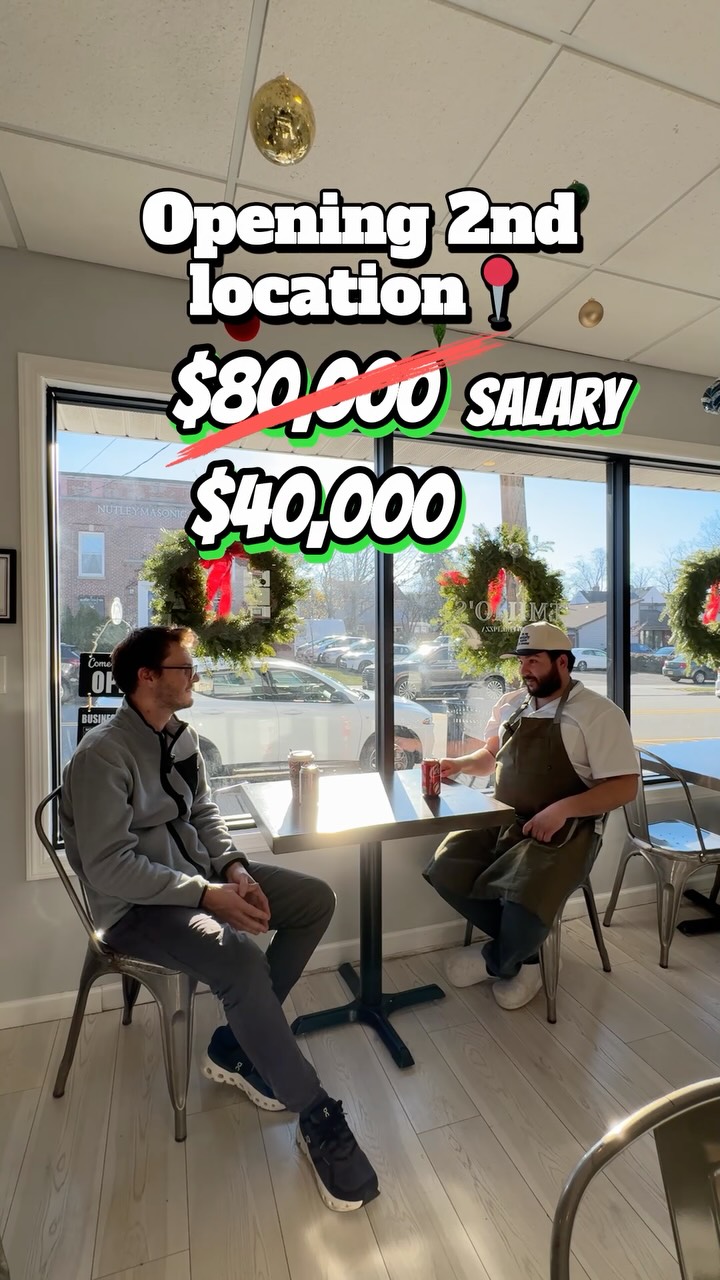 1.2M6.5×Owner reveals salary and growth plan@sidewalk.tv · Case Study Breakdown
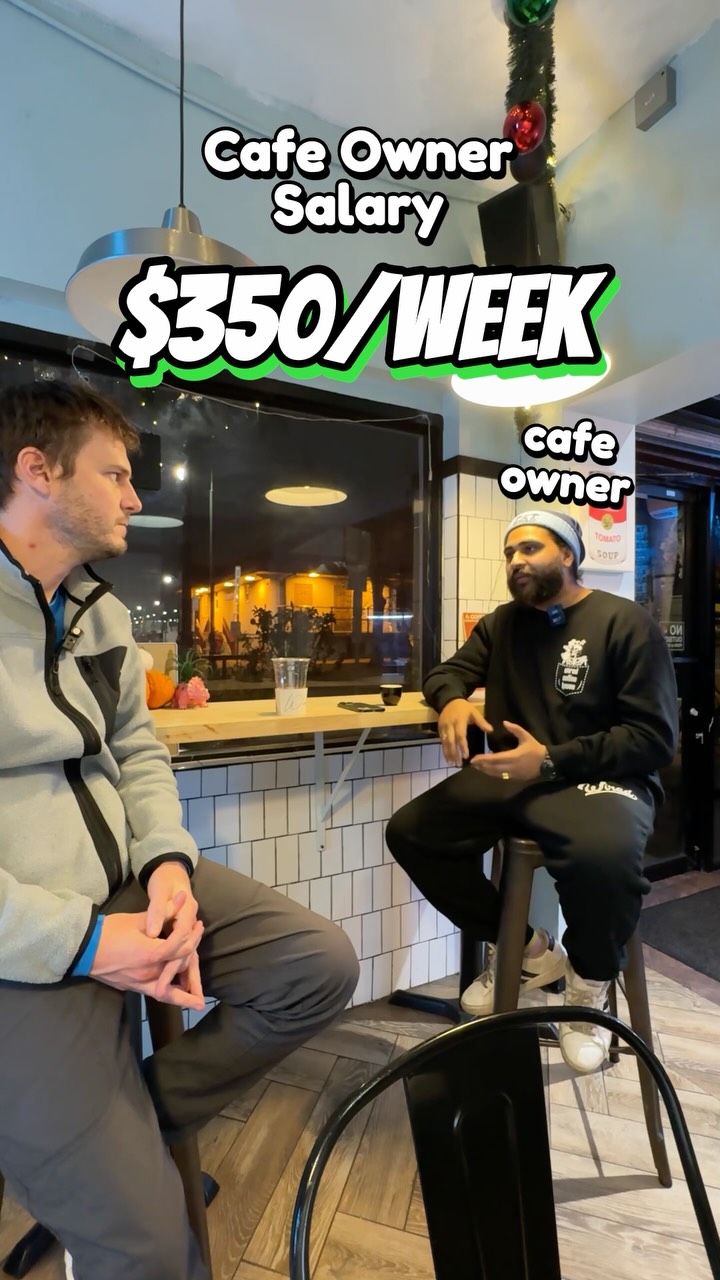 160K1.1×Cafe owner reveals business numbers@sidewalk.tv · Breakdown
 560.7K468×Explains three keys to business success@theburgcoffeecorp · Value Vlog
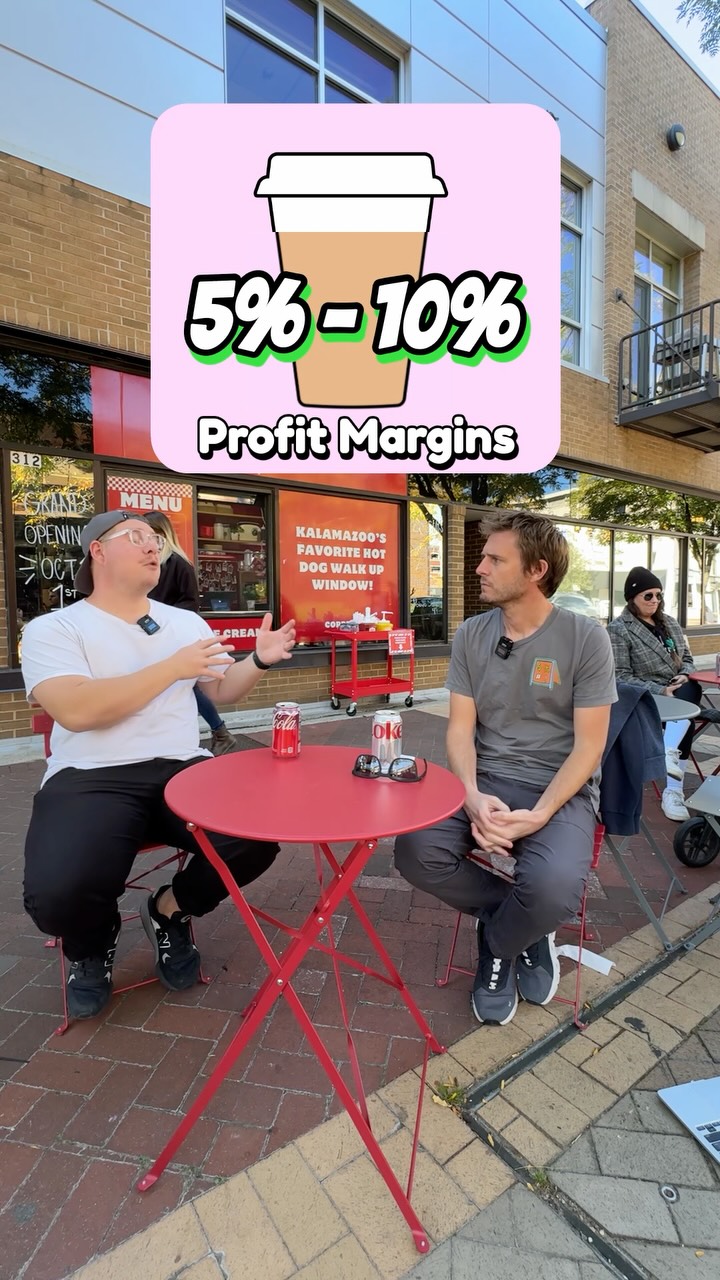 988.5K5.2×Cafe owner reveals tough financials@sidewalk.tv · Vulnerable Monologue
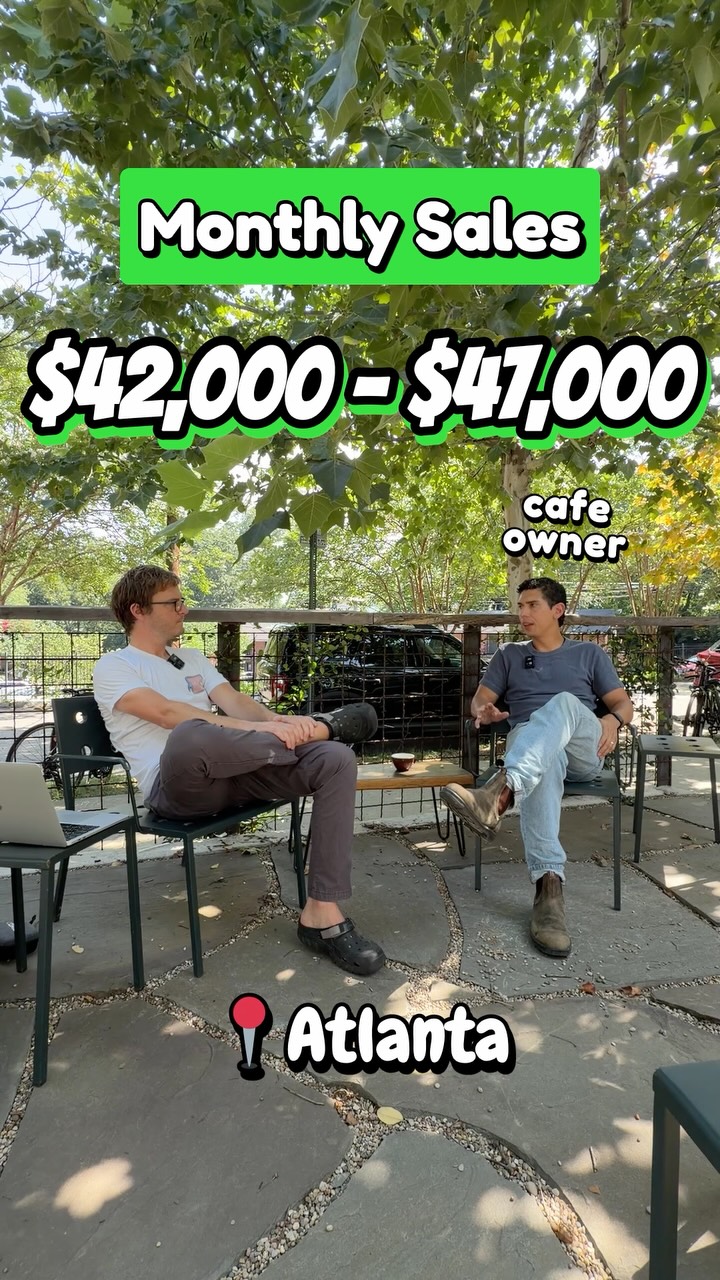 183.2KCoffee shop owner reveals business numbers@sidewalk.tv · Breakdown
 512.9KCoffee truck business financial breakdown@sidewalk.tv · Case Study Breakdown
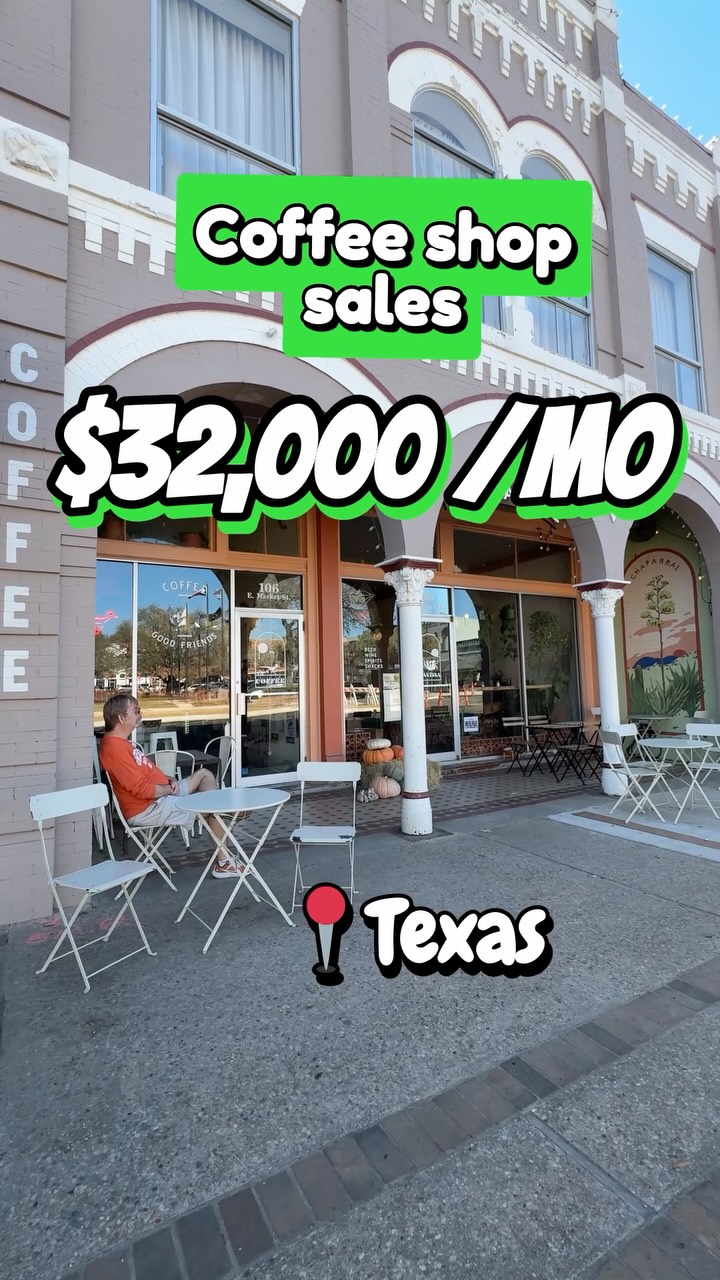 152.5KCoffee shop business financial breakdown@sidewalk.tv · Case Study Breakdown
[04]
[05]
What stops the scroll in the first 3 seconds
Title hook
Sales of a Restaurant?
Verbal hook
This year will hopefully be around 8,000,000.
Visual hook
A wide, panning shot across a busy and aesthetically pleasing modern restaurant interior, showing customers, staff, and unique decor.
[07]
The promise the opener makes, and how the video pays it back
Hook
A direct question about a business's performance, immediately answered with a large, attention-grabbing top-line revenue figure to establish high stakes and generate curiosity about profitability.
Payoff
A final visual (like a line graph) that illustrates the core, unresolved tension driving the industry's challenges (e.g., costs rising faster than prices), concluding with a statement that frames the issue as a systemic problem.
[08]
The structural pattern this video runs on
Framework
The Expert Deconstruction
To hook viewers with an impressive top-line number, then systematically break it down to reveal a more complex and challenging underlying reality, using historical benchmarks to frame the current situation.
The Cost Gut Punch
Immediately counter the impressive revenue figure by revealing the single largest cost as a high percentage and absolute dollar amount, creating tension by significantly reducing the perceived profit.
The Holistic Cost Map
Present a simple visual model (like a pie chart) that breaks down all major cost categories, providing a complete financial framework for the viewer to understand the business's structure.
The Idealized Past
Introduce a historical benchmark or an old 'rule of thumb' for cost structures, establishing a baseline of what was once considered a healthy or ideal model.
The Benchmark Invalidation
Explicitly state that the previously established historical benchmark is now obsolete, creating a narrative turning point and signaling a shift to a new, more difficult reality.
The New 'Good Enough'
Define the new, less favorable target for the primary cost, recalibrating the viewer's expectations of what constitutes success in the current environment.
The Reality Synthesis
Combine the new cost realities to present the current, less profitable blended cost model, quantifying the negative shift from the historical benchmark.
This restaurant owner talks about annual sales and rising costs of the restaurant industry 👀
title · beginning
Sales of a Restaurant?
contextual · beginning
Boston
informational · beginning
$8,000,000 ANNUAL SALES
contextual · beginning
restaurant owner
title · beginning
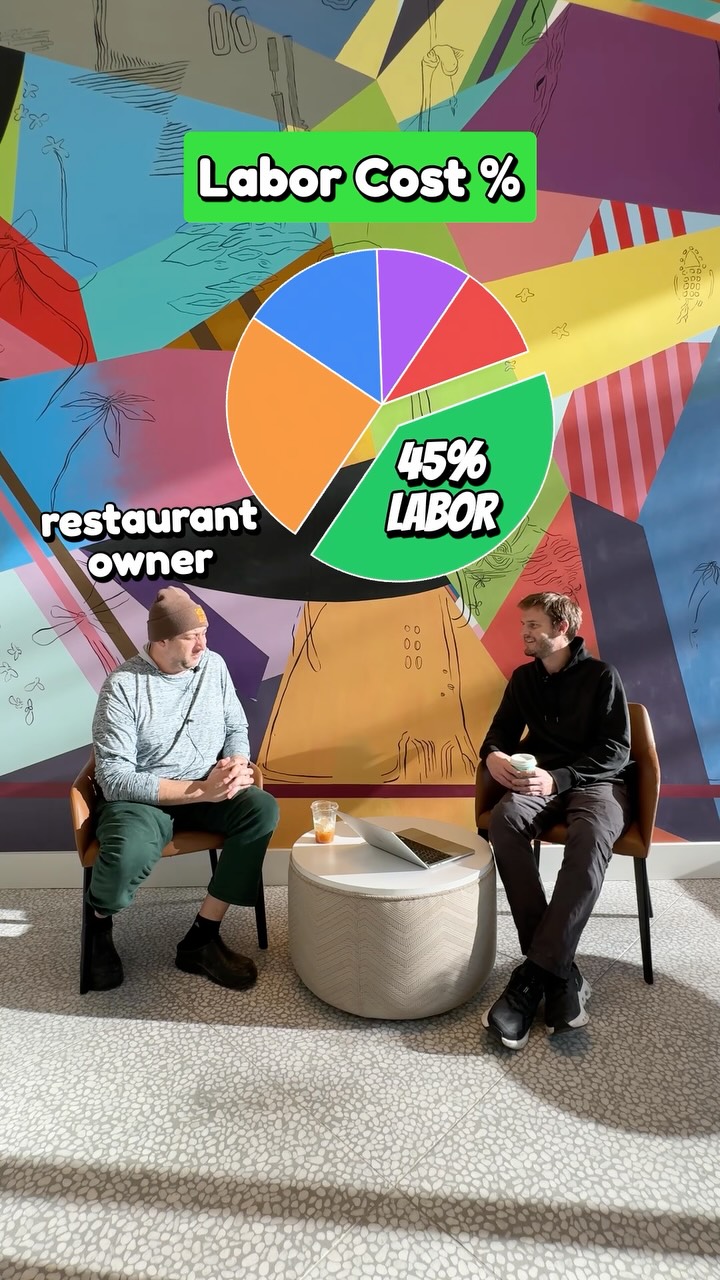
Labor Costs?
informational · beginning
45%
title · middle
Payroll 💰
informational · middle
$4,000,000 A YEAR
title · middle
RESTAURANT COSTS BREAKDOWN
title · middle
Old Cost Structure
informational · middle
30% COGS 30% LABOR 60%
title · middle
Actual Labor Costs
informational · middle
40%
title · end
Reality
informational · end
30% COGS 40% LABOR 70%
title · end
Menu Prices and COGS
This year will hopefully be around 8,000,000. The whole shebang? The whole shebang. A year? It's too high. Yeah. It's at like 45%. $4,000,000. That's a lot. 4,000,000 in Labor. Labor. All costs are kind of a little bit, since COVID, have good a little bit wonky. You know, there used to be this, like, you wanna pay 30% for for your food worst and 30% for your labor, you know, those blended should be around tier, and I feel like that is, that's no longer the standard. I mean, you know, labor is, you know, try to hit... If you can hit 40%, I feel like you're doing good. Really? So that blended number is now more like a tier, because food worst certainly hasn't gone down. But labor and food just keeps going up. Labor and food keeps going up, but, yeah, rank many prices are are not increasing at the same rate as those worst, so that's challenging for this industry as a whole.