@creators
Instagram · Talking Head Edit
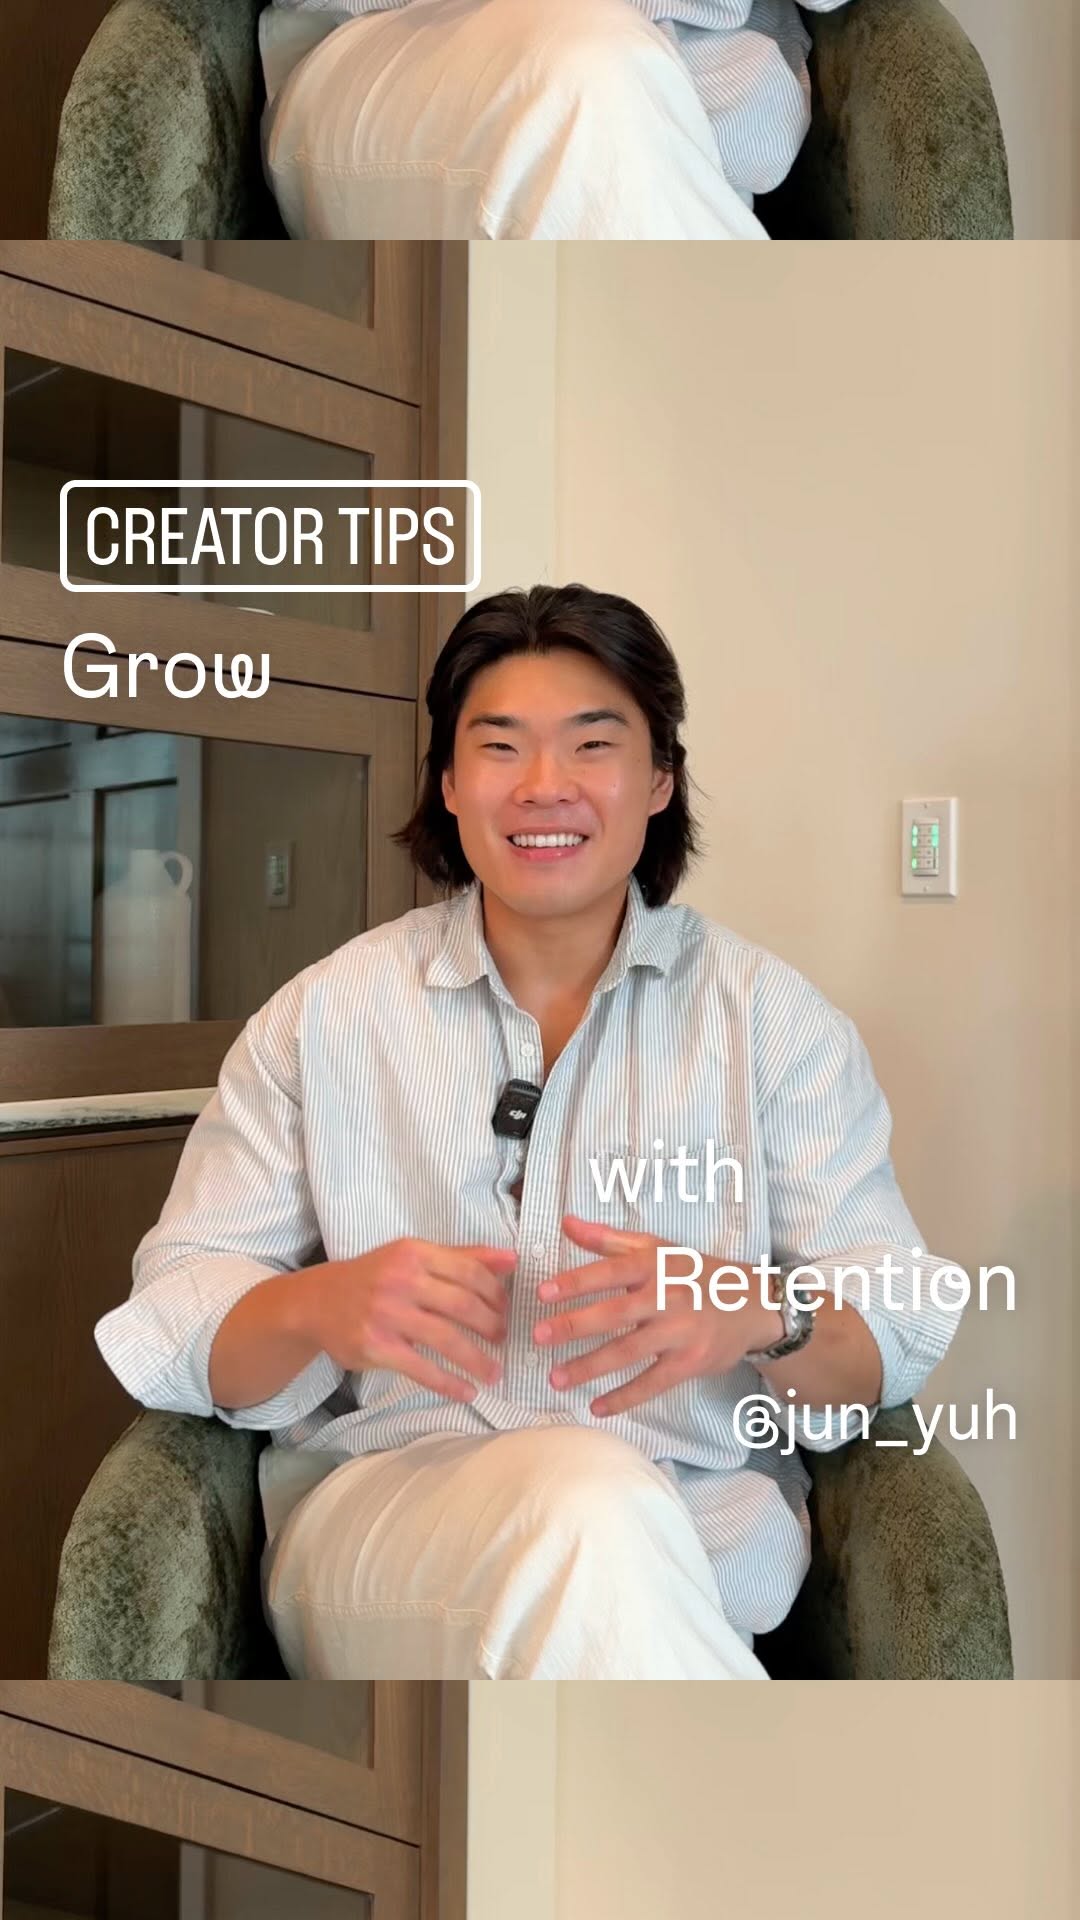
@creators @jun_yuh explains how you can use Insights to understand content performance and improve content strategy 📈💡

@creators
Instagram · Talking Head Edit
@creators @jun_yuh explains how you can use Insights to understand content performance and improve content strategy 📈💡
Performance
Video #19762 · Talking Head Edit
[01]
The creator establishes massive credibility, introduces the concept of retention curves varying by video duration, and then systematically breaks down three specific duration categories (short, medium, long). For each category, he displays a 'bad' retention graph and provides a highly specific, actionable content strategy (rehooks, transformations, hook stacking) to fix the drop-off, concluding with a call to follow for more breakdowns.
[02]
[03]
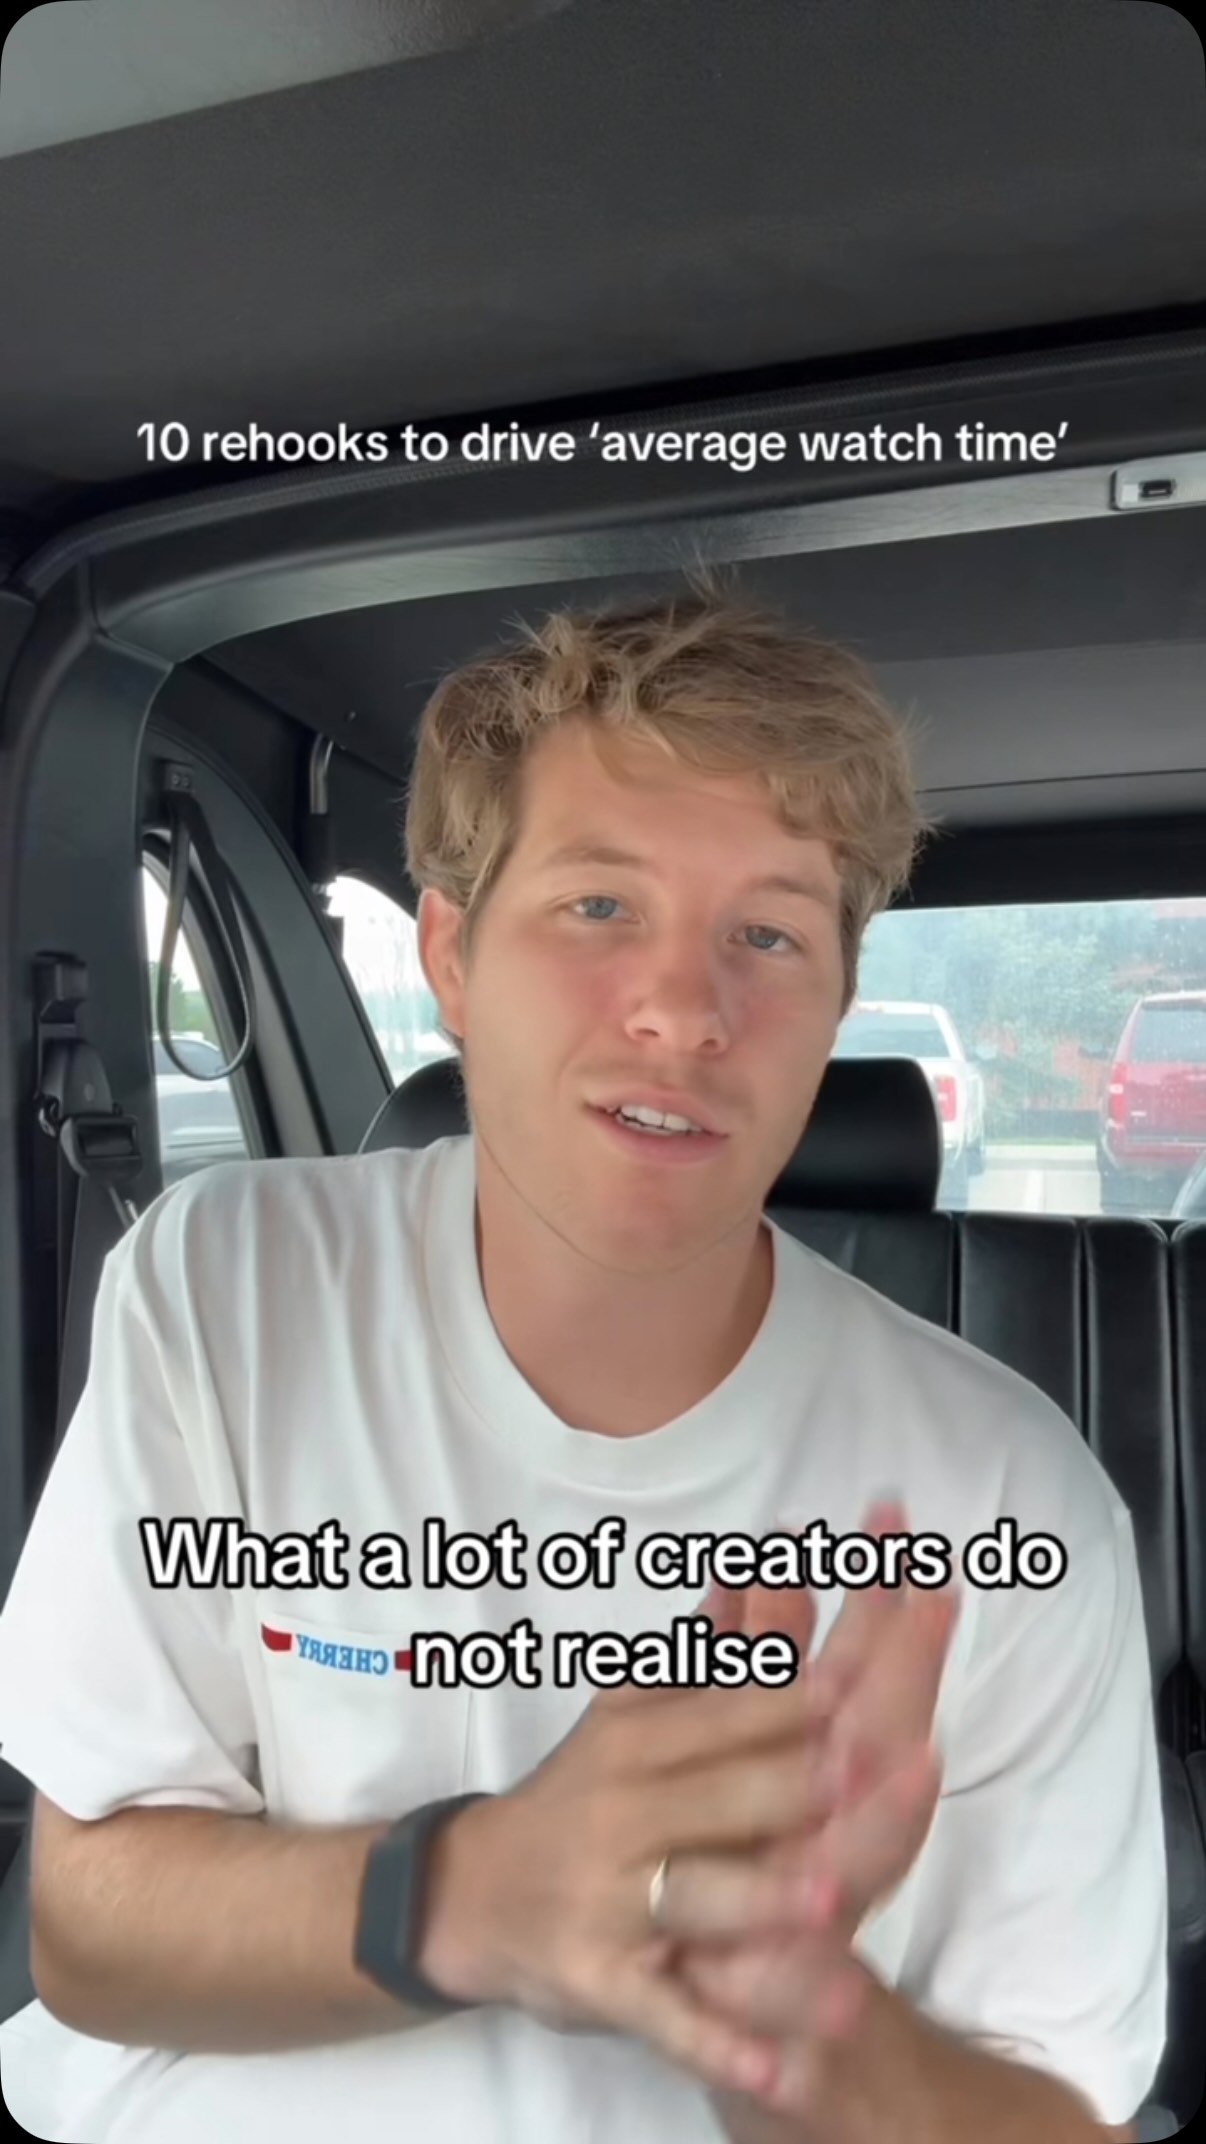 63KCreator lists 10 video rehooks@briarcochran · Rapid Fire Listicle
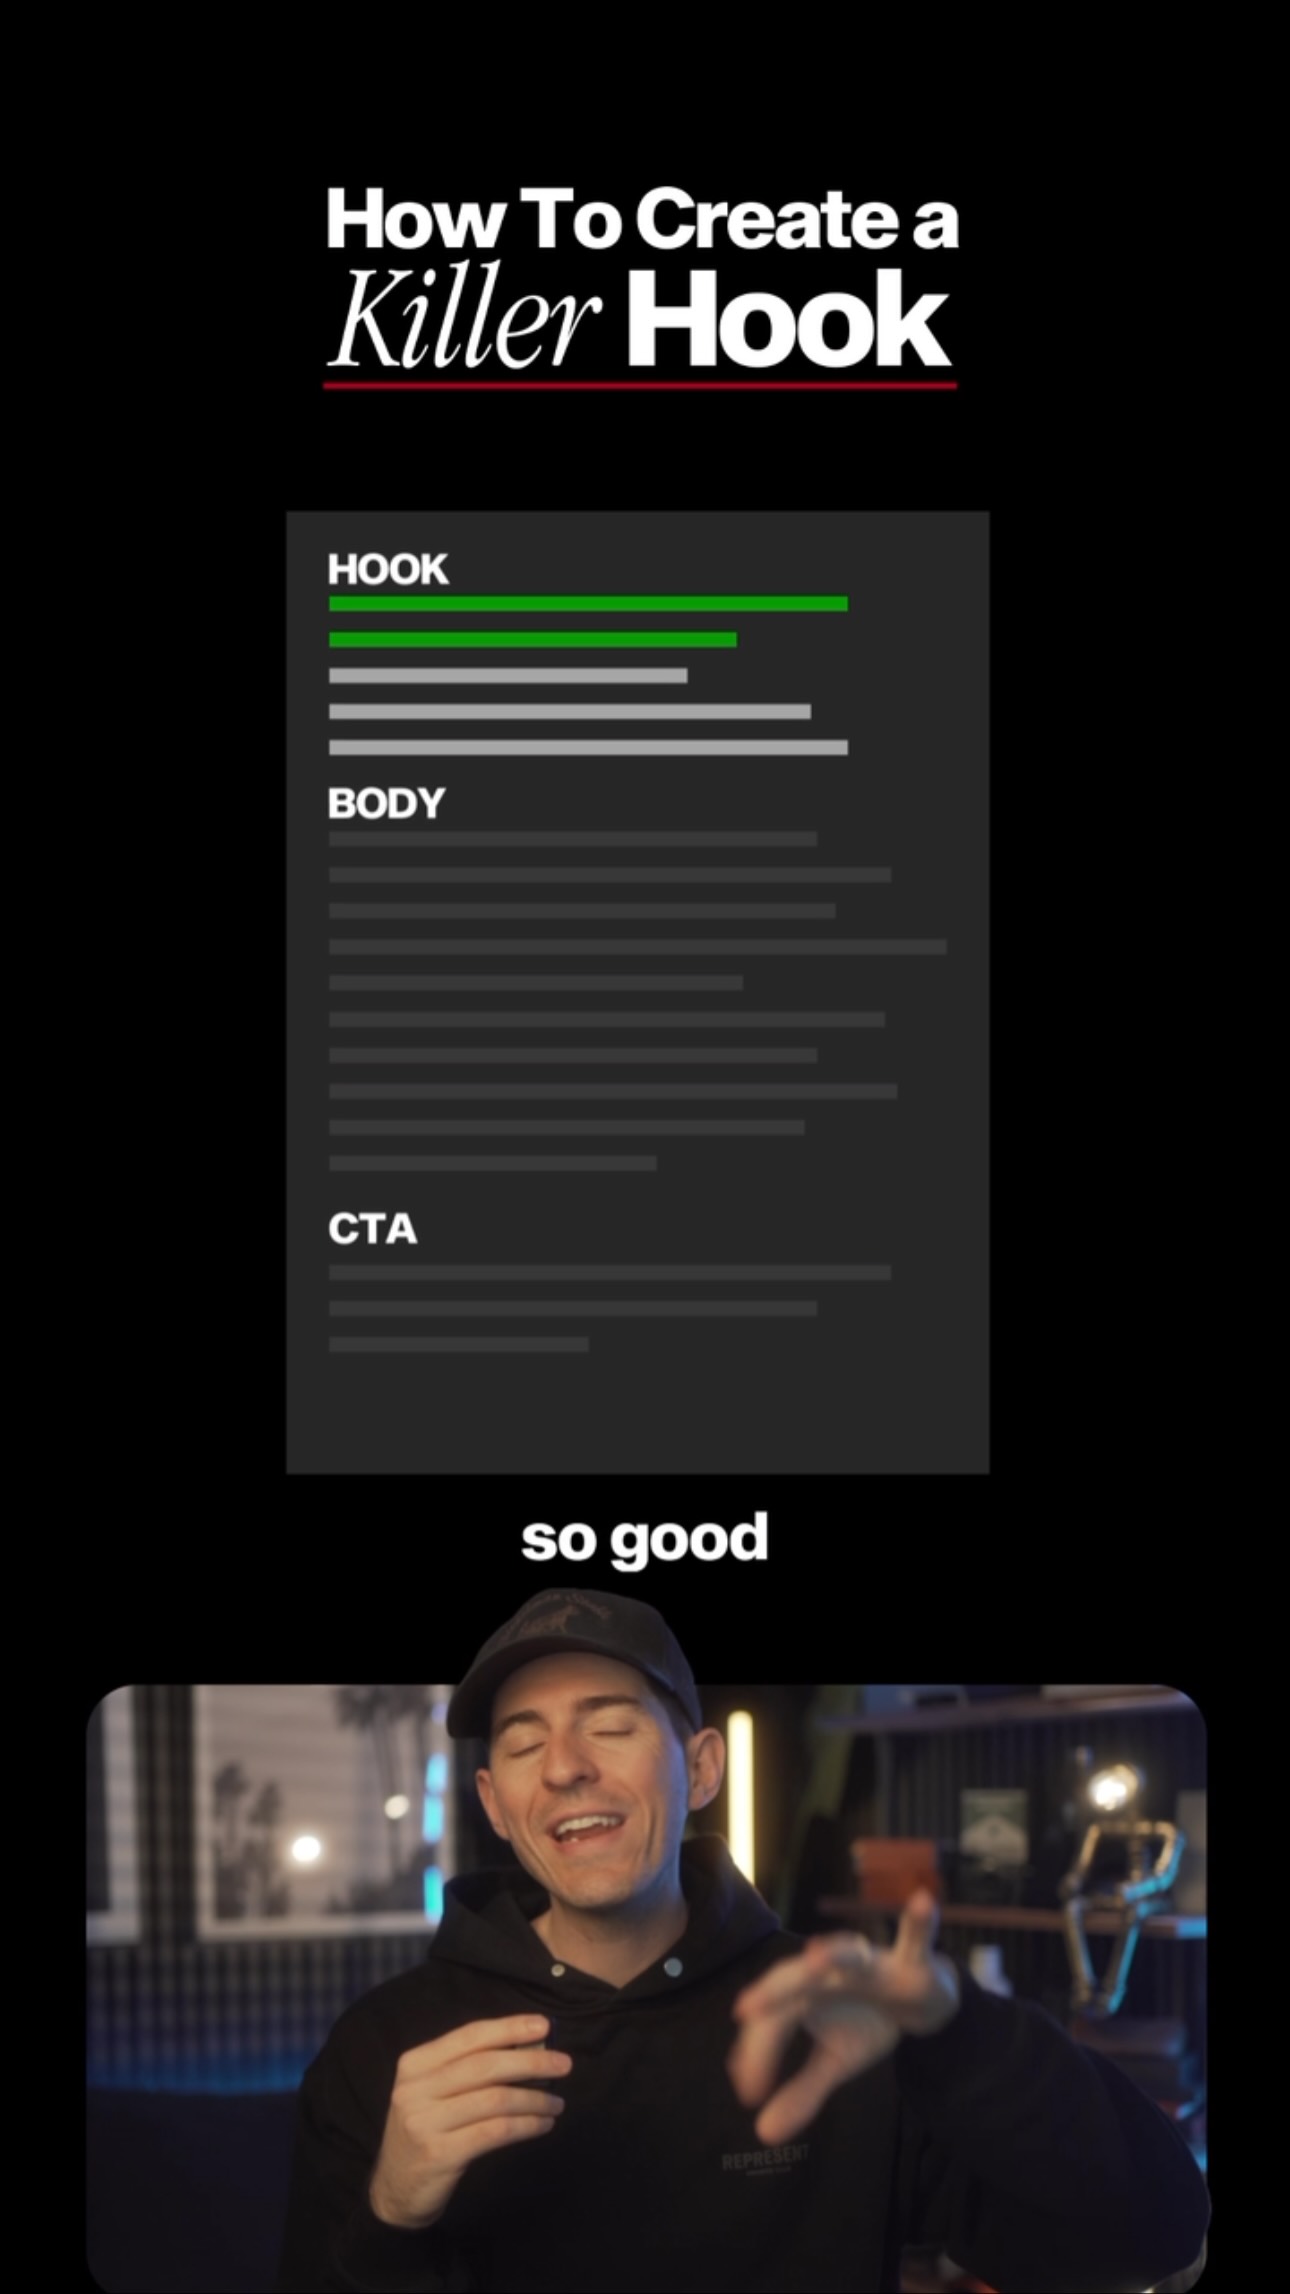 587.4K11.4×Explains three-step video hook method@kallawaymarketing · Tutorial / How To
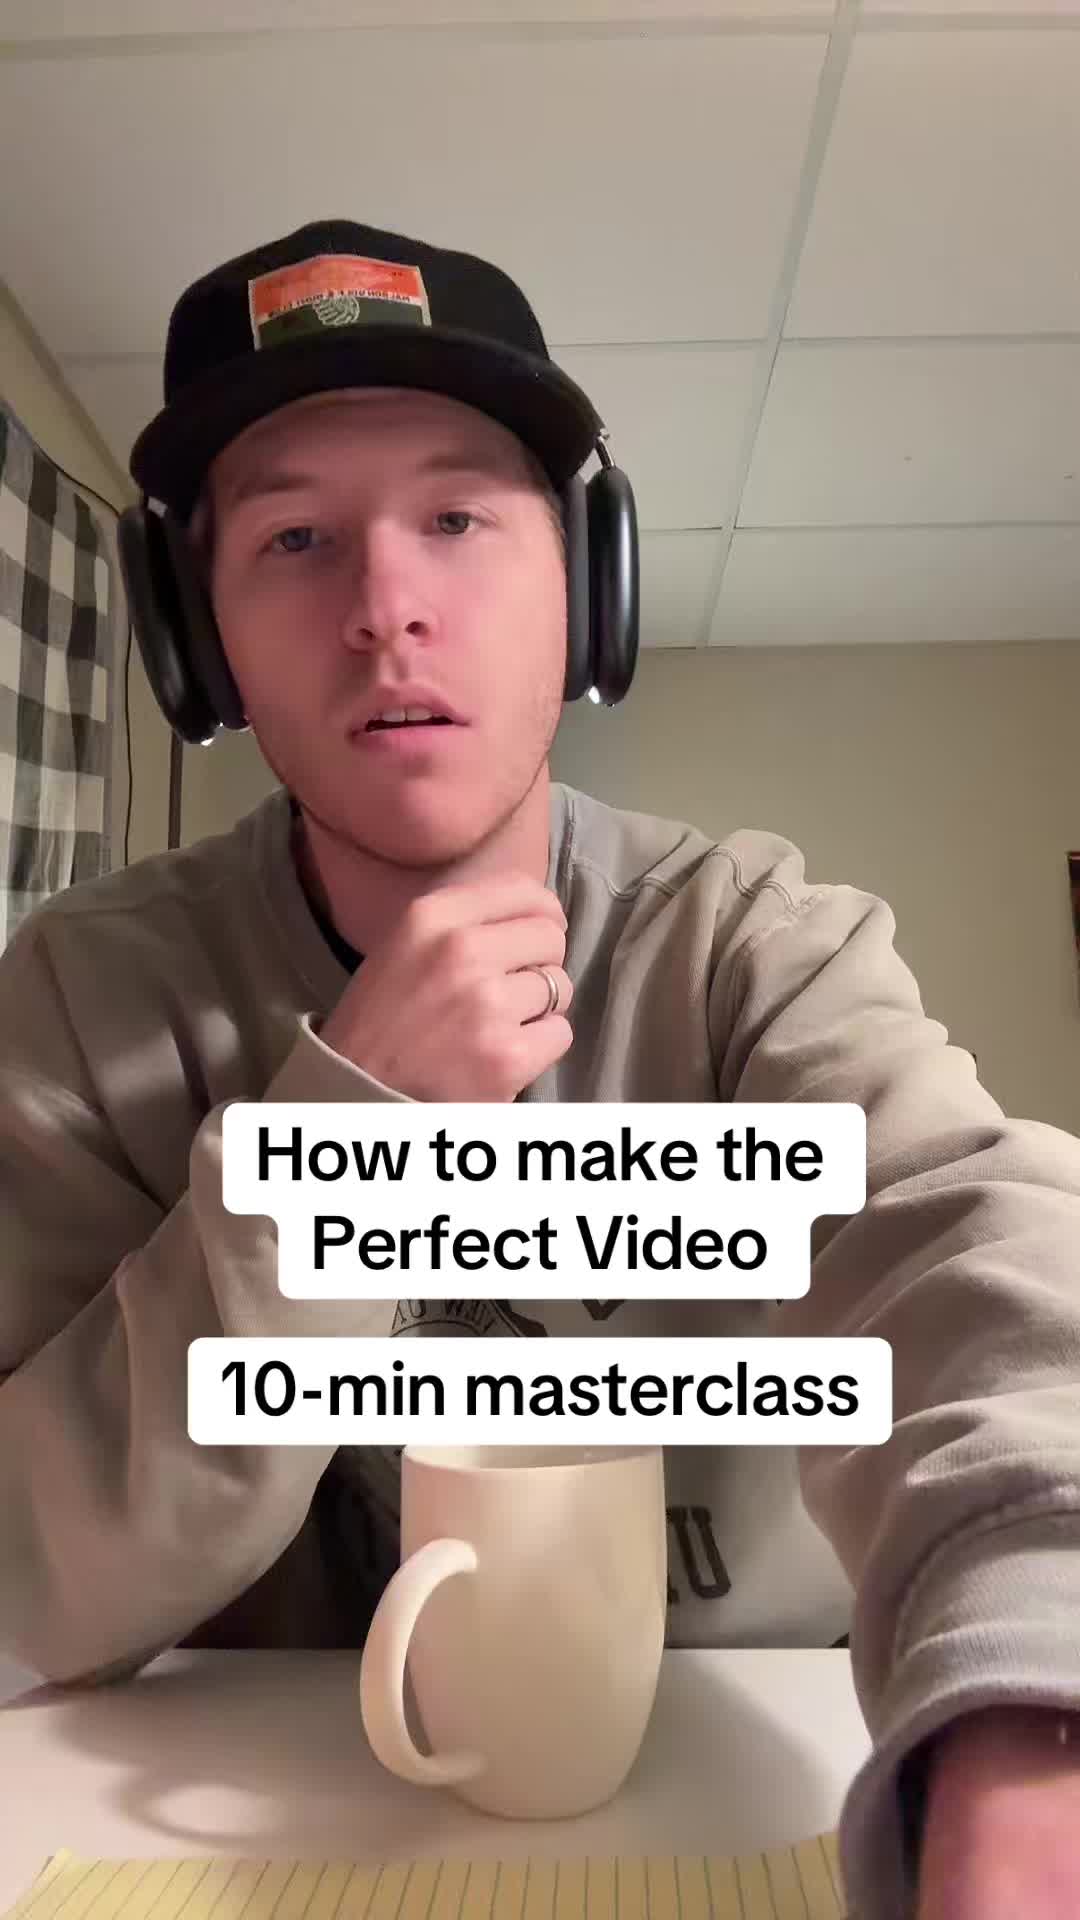 171.8K2.4×Creator's Venn diagram framework for making the perfect video@briarcochran · Breakdown
 342.4K47.8×Breaks down one-shot video strategy@house.of.ag · Breakdown
 1.3MCreator explains retention tips on screen@iamchrischung · Playbook
 333.5K17.8×Viral video case study breakdown@thepostprotocol · Case Study Breakdown
 1.7M90.5×Viral marketing formula breakdown@thepostprotocol · Case Study Breakdown
 517K40.6×Comparing two video creation approaches@itsmodernmillie · Good vs Bad
 410.4K103.6×Explains five video growth formats@house.of.ag · Tutorial / How To
 137.2KExplains three-step hook writing framework@iamaayushswamy · Tutorial / How To
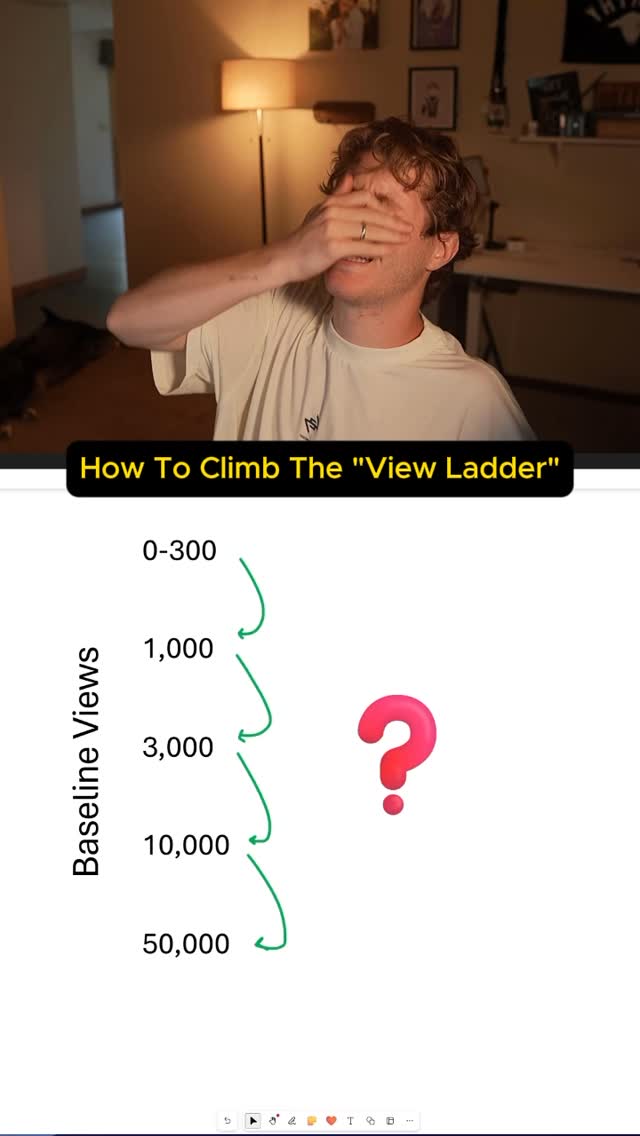 78.5K2.3×Breaking down the creator view ladder.@briarcochran · Breakdown
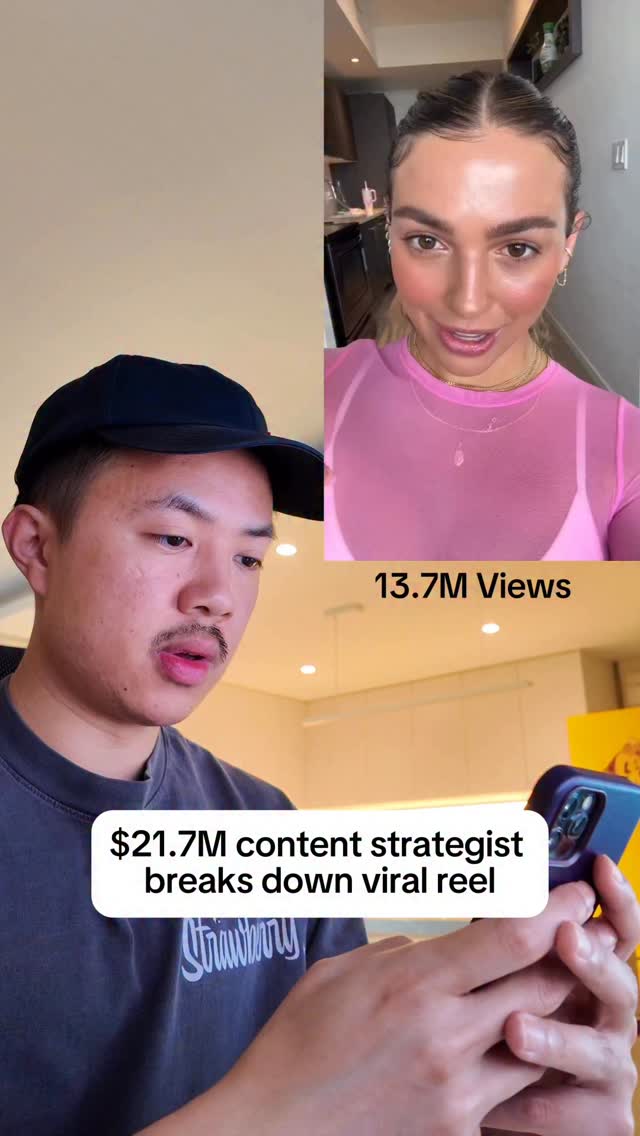 326K8.9×Strategist breaks down viral video@iamchrischung · Breakdown
[04]
[05]
What stops the scroll in the first 3 seconds
Title hook · 25%
grow with retention
Verbal hook · 60%
Hi. I'm Jun. I've posted content every single day for the last six years and grew an audience of over 5,000,000 followers.
Visual hook · 15%
A confident medium close-up of the speaker addressing the camera, immediately establishing authority, followed by the sudden appearance of analytical data graphs (Instagram Insights) to break visual monotony and set the educational premise.
[06]
Steal this for your own video
I've posted every single day for and grown — here's what I learned about .
[07]
The promise the opener makes, and how the video pays it back
Hook
Immediately establishes elite credibility through massive numbers, then pivots from a widely accepted truth to a hidden, nuanced problem.
Payoff
Frames the creator as a supportive mentor invested in the viewer's success, leading directly into a low-friction call to action.
[08]
The structural pattern this video runs on
Framework
The Scenario-Solution Matrix
Establish overwhelming authority, identify a nuanced problem within a common goal, and provide a systematic, categorized list of actionable solutions based on specific variables.
The Heavy Lifting Reveal
Creator states they have done an overwhelming amount of research or manual labor to distill complex data into a simple, digestible format for the viewer, establishing high value.
The Diagnostic Matrix: Phase 1
Introduces the first specific variable condition, identifies the failure state visually, and provides a precise, actionable fix.
The Diagnostic Matrix: Phase 2
Introduces the second variable condition, its corresponding failure state, and a distinct tactical fix tailored to this specific parameter.
The Diagnostic Matrix: Phase 3
Introduces the final variable condition, its failure state, and the most complex or comprehensive fix to round out the educational value.
@jun_yuh explains how you can use Insights to understand content performance and improve content strategy 📈💡
title · beginning
grow with retention
informational · middle
1-15 sec
informational · middle
15-60 sec
informational · middle
60+ sec
contextual · throughout
good
contextual · throughout
bad
call-to-action · end
more content breakdowns!
Hi. I'm Jun. I've posted content every single day for the last six years and grew an audience of over 5,000,000 followers. The truth is everyone knows that retention is the key metric for growth. But what nobody talks about is how the shapes of these retention curves vary based on the video's duration. So I sat down and analyzed over a thousand graphs to populate what is good, what is bad, and how to fix it to make this super simple for you. If your video has this duration and this bad retention graph, try adding a rehook five seconds in, like asking a question or switching the frame to keep your viewers engaged. No, if your video has this duration and this bad retention graph, try out a transformation video. The viewers will first see themselves in your struggle and want to learn how they can transform with the method that you used. And lastly, if your video has this duration and this bad retention graph, try stacking visual, best, and sound hooks at the beginning of your video while solving a core problem or a specific avatar throughout the video. I wanna see you win no you can follow-up for more content just like this.