@lukas.mullen
Instagram · Split screen
@lukas.mullen Shoutout to the designers at Quartrs for bringing earnings reports design into the digital era

@lukas.mullen
Instagram · Split screen
@lukas.mullen Shoutout to the designers at Quartrs for bringing earnings reports design into the digital era
Performance
Video #39567 · Split screen
[01]
The creator presents a historical analysis of corporate annual reports, showing how they evolved from creatively designed art pieces to standardized, boring documents. He explains the cultural and economic reasons for this shift (the internet, 2008 financial crisis) and then highlights a modern "renaissance" where a company is using strong graphic design to make financial data engaging again, concluding that good design is key to capturing attention.
[02]
[03]
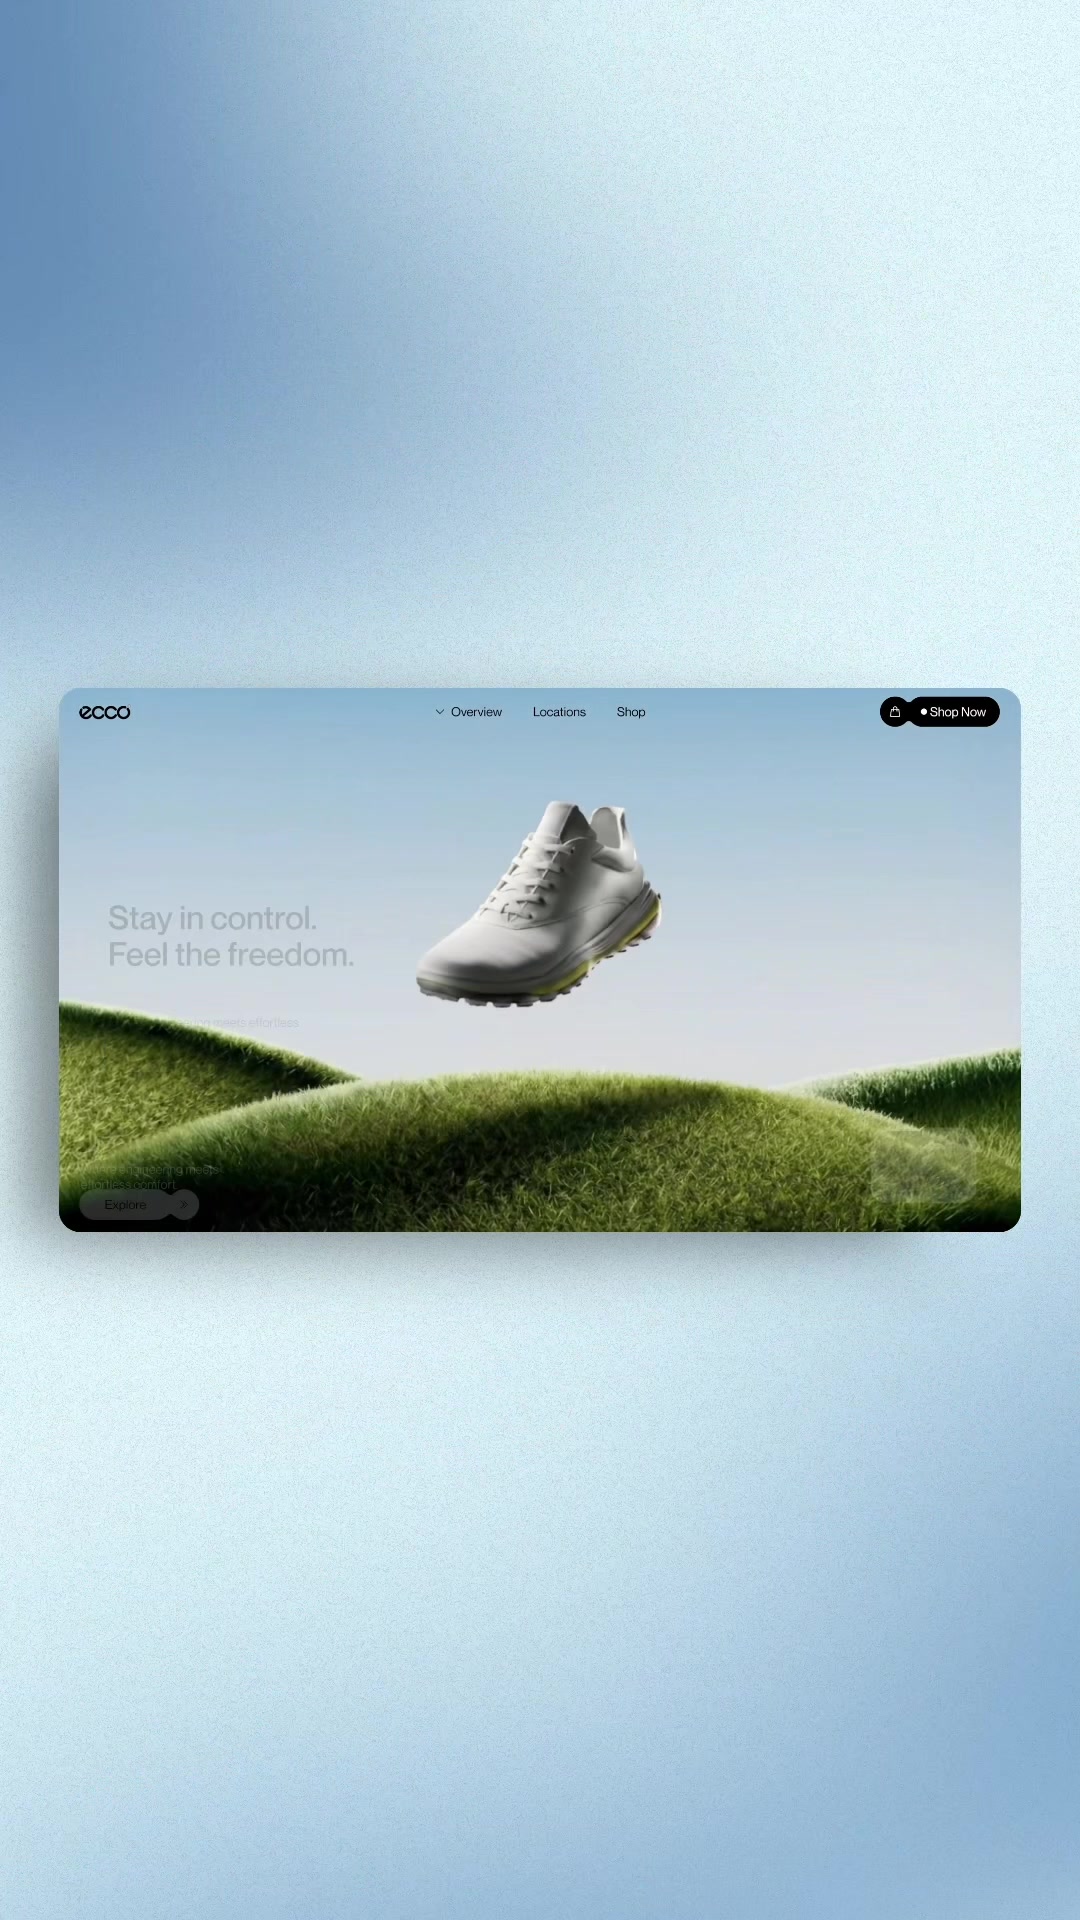 495.3K20.4×Contrasting bad vs good web design@marcelodesignx · Good vs Bad
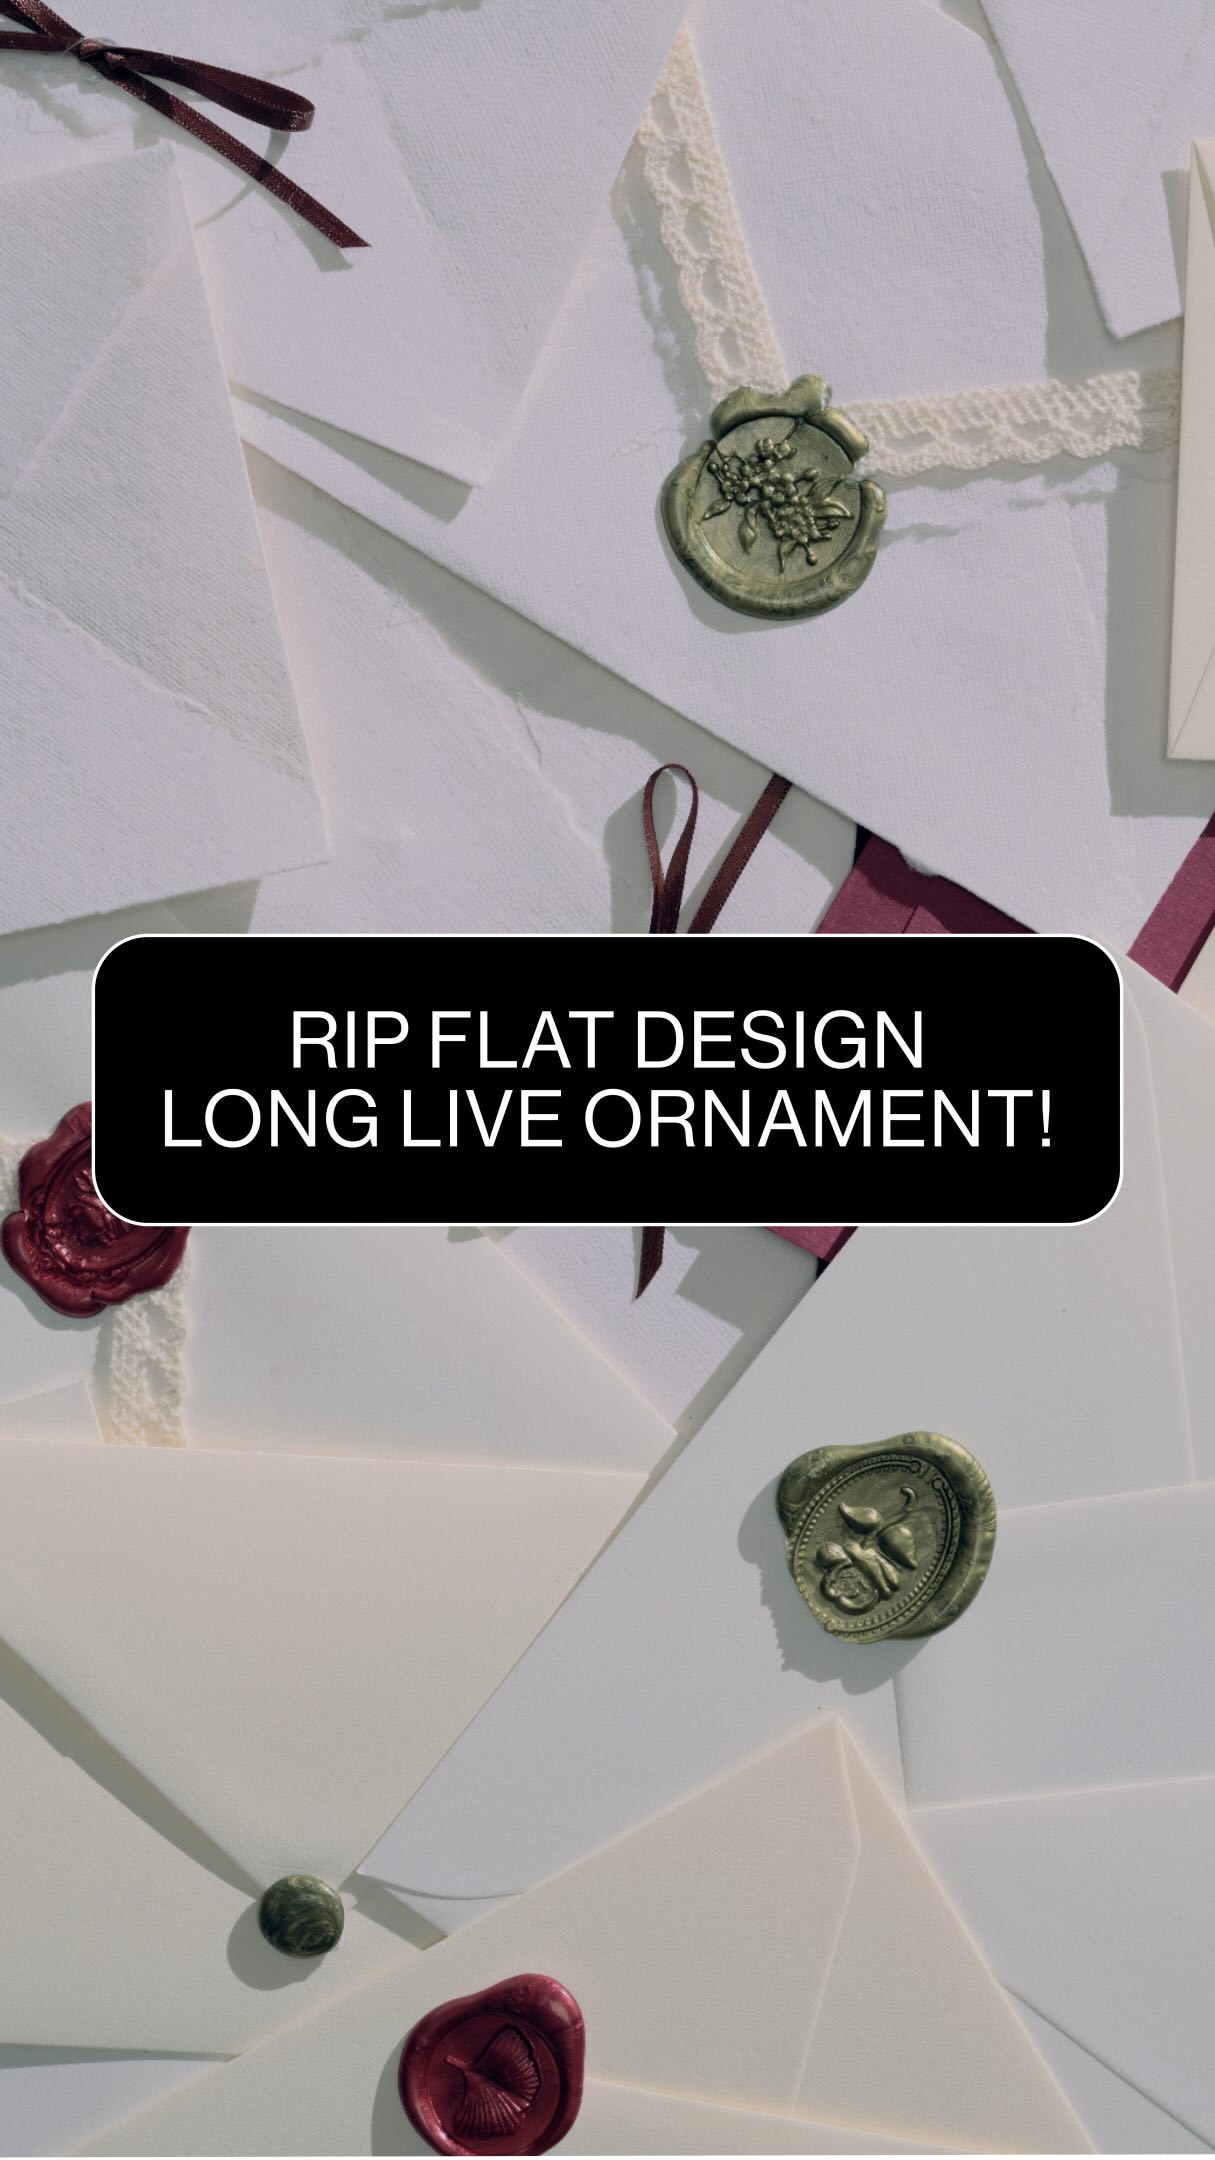 341.8K3.3×Explaining the ornate design trend@deathtostock · Breakdown
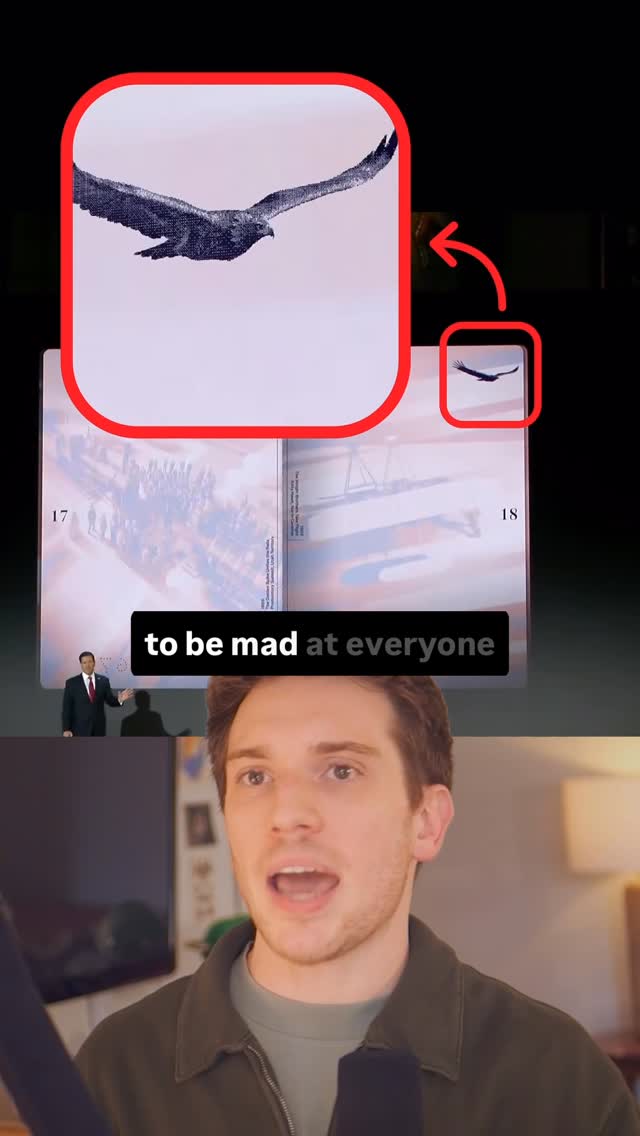 280.9K1.1×Analyzing government's new tech aesthetic@ryanselvy · Breakdown
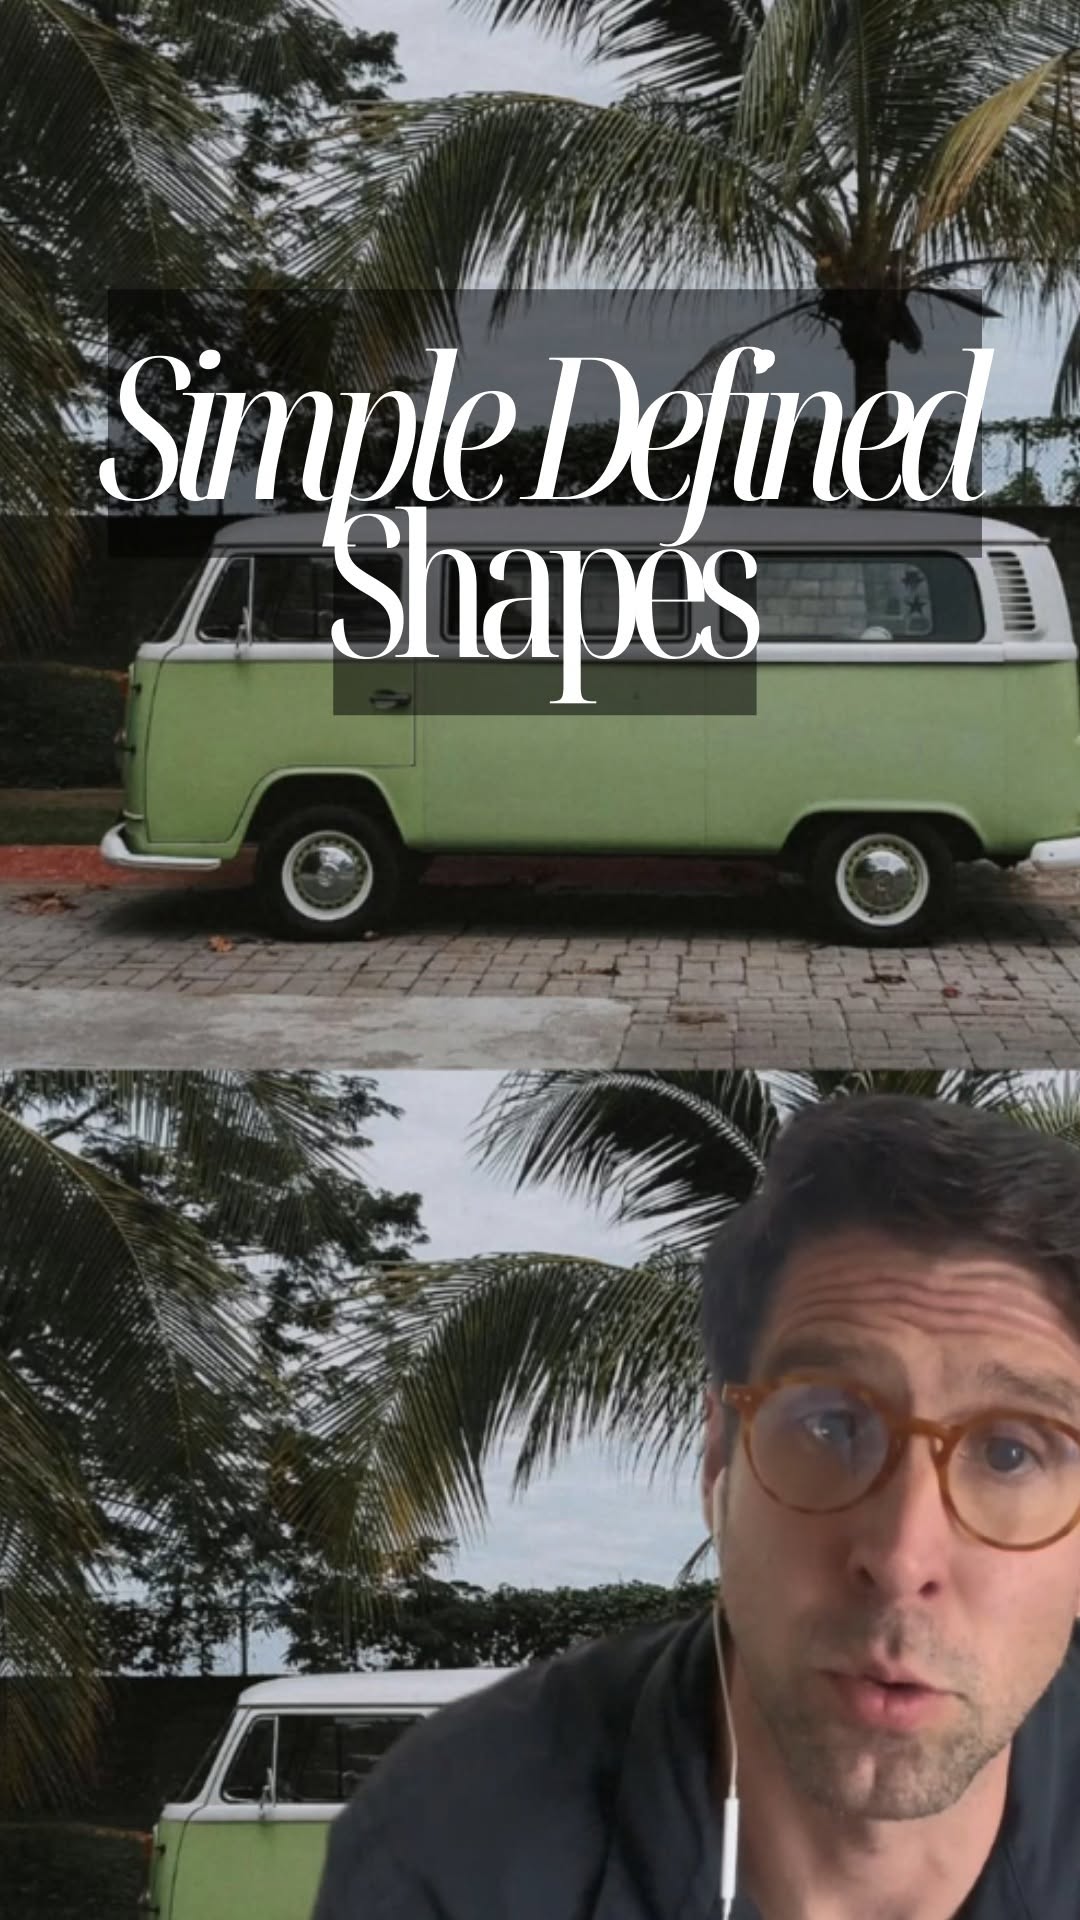 1.2M14.7×Argument that simple defined shapes make for better design@hansloreidesign · Breakdown
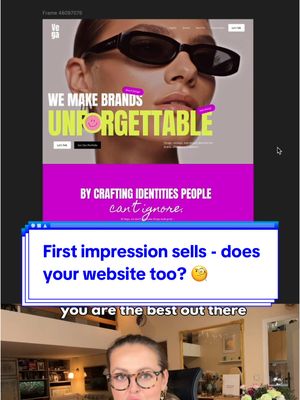 54K1.1×Explaining a website design transformation@pixeldesignlab · Before/After Transformation
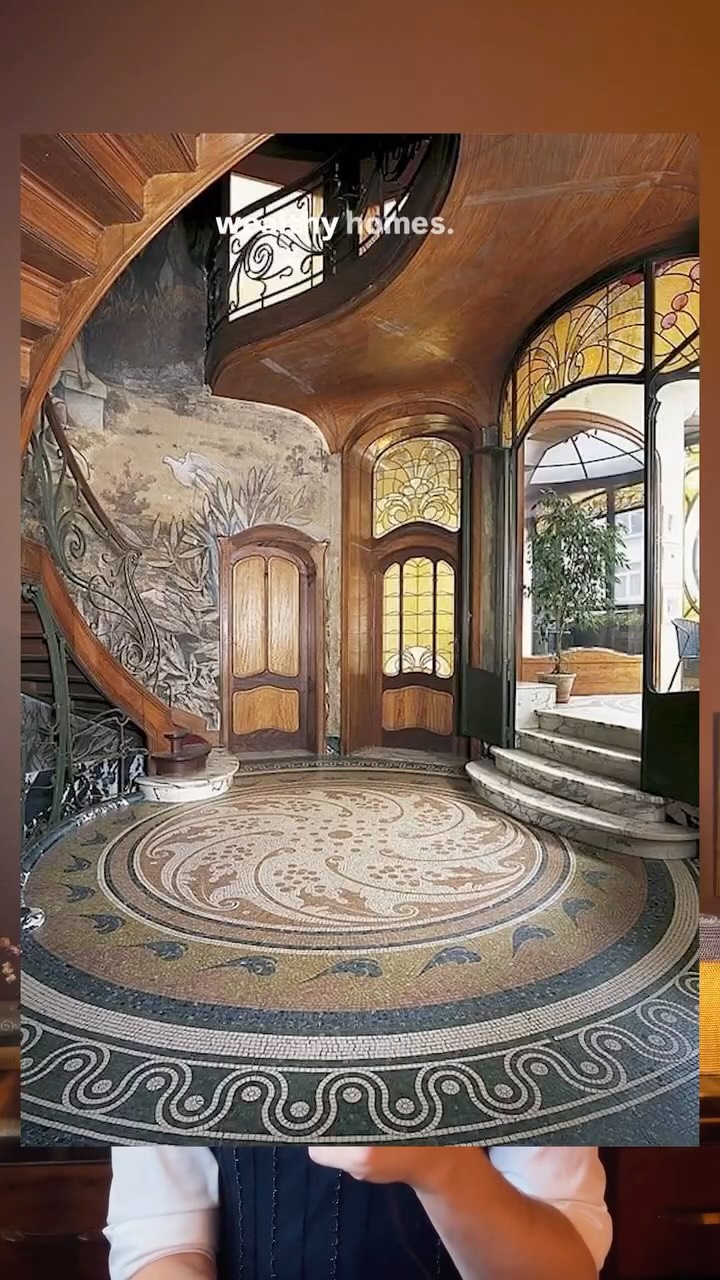 842.9K8.1×Comparing historical art styles today@kylewilliamdesign · Breakdown
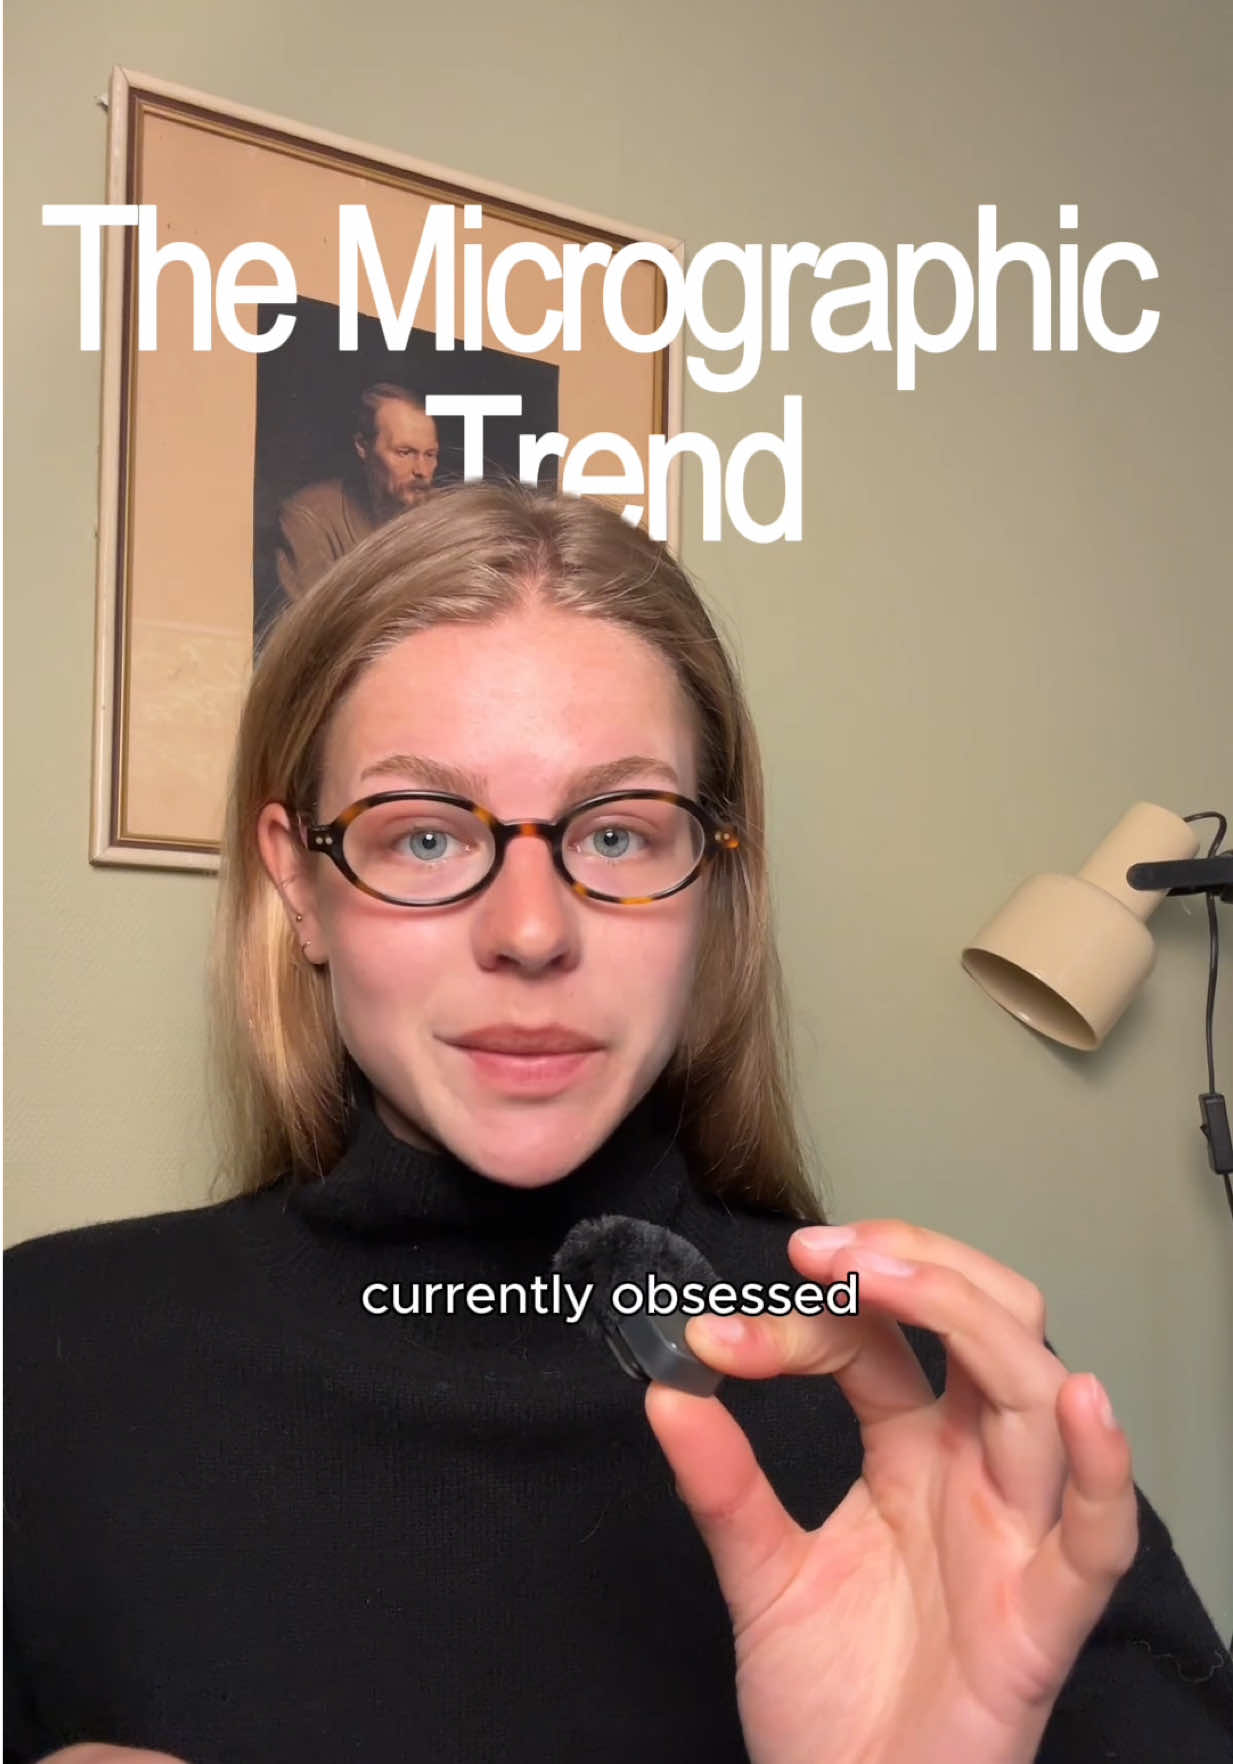 99.1KExplaining the micrographic design trend@var.aunevik · Breakdown
 580.6K2.6×Creator breaks down web design trends@deathtostock · Breakdown
 76.6KTalking head design trend breakdown@var.aunevik · Breakdown
 3.9M6.7×Before and after design fixes@createwithalena · Rapid Fire Listicle
 216.9K1.3×Analyzing a web design trend@joshfromyolkk · Breakdown
 738.8K4.2×Landing page teardown and tool pitch.@calebulf · Case Study Breakdown
[04]
[05]
What stops the scroll in the first 3 seconds
Title hook · 55%
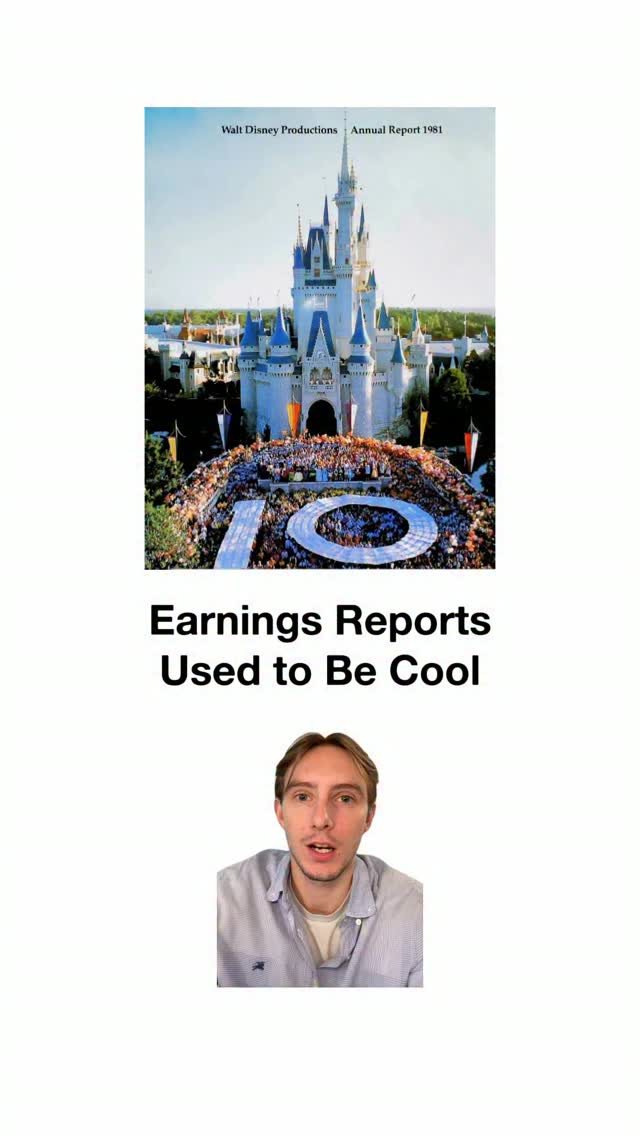
Earnings Reports Used to Be Cool
Verbal hook · 30%
Corporations used to treat annual reports like modern art, but today it's just another spreadsheet.
Visual hook · 15%
A vintage, colorful photograph of the Disney castle from a 1981 annual report is prominently displayed, creating a nostalgic and visually interesting opening.
[06]
Steal this for your own video
Used to Be
[07]
The promise the opener makes, and how the video pays it back
Hook
Present a stark 'Then vs. Now' comparison, framing a past practice as superior to its modern, degraded equivalent to create a nostalgia-driven curiosity gap.
Payoff
Conclude by abstracting the entire narrative into a simple, powerful, and universally applicable lesson about human nature, creativity, or strategy, providing a valuable takeaway for the viewer.
[08]
The structural pattern this video runs on
Framework
The 'Lost Art' Revival
This framework tells the story of a once-great practice or art form that declined due to specific historical or technological shifts, only to be revived in a new, modern context by an unexpected player. The story culminates in a universal lesson derived from this revival.
The Golden Age Showcase
Provide compelling visual evidence of the superior past, establishing its quality and explaining the strategic 'why' behind its excellence.
The Catalyst of Decline
Pinpoint the 1-2 specific historical events or forces (e.g., technology, regulation, cultural shift) that caused the practice to lose its quality or relevance, providing a clear cause-and-effect explanation.
The Unexpected Rebirth Pivot
Shift the narrative from decline to hope by introducing a contemporary person, company, or movement that is bringing back the 'lost art' in a new and relevant way.
The Modern Validation Montage
Deliver a rapid-fire sequence of examples showing the modern revival in action, providing tangible proof that the rebirth is real and successful.
Shoutout to the designers at Quartrs for bringing earnings reports design into the digital era
title · beginning
Earnings Reports Used to Be Cool
contextual · middle
reports
contextual · middle
touchpoint
contextual · middle
had
contextual · middle
success
contextual · middle
innovation
contextual · middle
they
contextual · middle
expensive
contextual · middle
bespoke
contextual · middle
was
contextual · middle
to
contextual · middle
table
contextual · middle
report
contextual · middle
happened
contextual · middle
it
contextual · middle
necessary
contextual · middle
2008
contextual · middle
crisis
contextual · middle
guidelines
contextual · middle
this
contextual · middle
so
contextual · middle
companies
contextual · middle
of
contextual · middle
cute
contextual · middle
story
contextual · middle
seeing
contextual · middle
in
contextual · end
because
contextual · end
data
contextual · end
realized
contextual · end
more
contextual · end
when
contextual · end
now
contextual · end
content
contextual · end
and
contextual · end
respectable
contextual · end
truth
contextual · end
nature
contextual · end
people
contextual · end
that
contextual · end
to
contextual · end
something
contextual · end
have
contextual · end
it
Corporations used to treat annual reports like modern art, but today it's just another spreadsheet. Pre Internet, these reports were the only touchpoint businesses had with best, so it had to communicate success, innovation, stability. So they went all out. Beautiful graphic design, expensive paper, bespoke techniques. Techniques. It was the corporate flex to make a coffee table book level report. Then two things happened. First, the internet made it so the physical report was no longer necessary. And then the two thousand and eight financial crisis spawned strict guidelines on the way this data is presented. So in the eyes of these companies, it became too much of a risk to get cute with the design. But the story doesn't end there because we're seeing a bit of a renaissance in this space. Because this random data storage company realized people pay more attention to data when the design around it looks good. No now tier entire content strategy is just making mock up designs for earnings reports, and they do respectable numbers on x. The story is exposing a fundamental truth about human nature that too many business people ignore. And that's that if you want people to pay attention to something, the first thing you have to do is make it fun to look at.